科技部補助專題研究計畫成果報告
期末報告
電子化健康服務管理議題研討:服務設計,服務遞送,服
務績效
計 畫 類 別 : 個別型計畫
計 畫 編 號 : MOST 103-2410-H-004-106-
執 行 期 間 : 103 年 08 月 01 日至 104 年 08 月 31 日
執 行 單 位 : 國立政治大學資訊管理學系
計 畫 主 持 人 : 張欣綠
計畫參與人員: 碩士班研究生-兼任助理人員:蔡耀賢
碩士班研究生-兼任助理人員:蕭博修
碩士班研究生-兼任助理人員:賴智祥
博士班研究生-兼任助理人員:顏婉竹
報 告 附 件 : 出席國際會議研究心得報告及發表論文
處 理 方 式 :
1.公開資訊:本計畫涉及專利或其他智慧財產權,2 年後可公開查詢
2.「本研究」是否已有嚴重損及公共利益之發現:否
3.「本報告」是否建議提供政府單位施政參考:是,衛福部
中 華 民 國 104 年 09 月 11 日
中 文 摘 要 : 面對今日老化嚴重的社會, 電子健康照護的需求遽增,也成
為健康照護中最快速發展的一塊。因此,如何設計一個具永
續經營力的電子健康服務是十分重要的。根據適配的概念,
本研究嘗試找出跟病人偏好最適配的電子健康服務特性,並
且提出高適配度的電子健康服務有助於服務績效的提昇。我
們以台大醫院電子健康照護中心為例,收集該中心的資料驗
證我們的假說。我們研究顯示如何透過服務設計找出具高適
配度的服務特性,並且如何解決妨礙適配的障礙。
中文關鍵詞: 電子健康, 服務管理, 台大醫院, 個案研究
英 文 摘 要 : Because of today's rapidly aging society, the demand
for eHealthcare has dramatically increased, and
eHealthcare has become one of the fastest growing
areas of healthcare today. How to design a
sustainable eHealth service has therefore become a
critical issue in the eHealth industry. Based on the
concept of fit, this study attempts to identify the
fit between eHealth service features and patient
preferences and proposes that high levels of fit
contribute to eHealth service performance. We
conducted a case study in which data were collected
from the eHealthcare program at the National Taiwan
University Hospital. The results of the study
corroborate our previous proposition that eHealth
services are more sustainable when there is an
existing fit between service features and patient
preferences. Our findings also empirically
demonstrate that eHealth service providers can create
service fit in practice through activities that
identify fit and resolve potential barriers to
achieving fit.
英文關鍵詞: eHealth, service management, National Taiwan
University Hospital, case study
eHealth Service Design: A Case Study of National Taiwan University Hospital
1. Introduction
Due to our rapidly aging society (Celler et al. 1995), the demand of home health care has
dramatically increased, causing e-Health to become one of the fastest growing
areas in healthcare
(Ruggiero et. al, 1999). Eysenbach (2001) has defined e-Health as “an emerging field in the
intersection of medical informatics, public health and business, referring to health services and
information delivered or enhanced through the Internet and related technologies”.
To respond to this trend, the design of well-devised e-Health service that fulfills patients’
needs is an important issue. Past studies have classified different service features (Lovelock,
1983; Tatikonda and Zeithaml, 2001). For example, some scholars emphasize that customization
is a critical dimension of service schemes (e.g., Kellogg and Nie, 1995); they argue that a high
quality service design should be able to deal with customers’ individual problems and deliver
customized solutions to meet these customers’ needs (Karmarkar, 2004). Donabedian (1988) has
indicated that interpersonal attributes (such as empathy, concern, caring, or tact) should be
considered in the healthcare service design; additionally, non-interpersonal attributes (such as
access, availability, or functionality) should also be considered in order to avoid systemic
incidents (Johnston, 1995).
Interestingly enough, however, some scholars have found that good service design doesn’t
always lead to good service sustainability (Johnston and Clark, 2001). According to Teboul (2006),
a design gap exists in the form of discrepancies between the analysis of general customer needs
and the changing demand of an individual customer, where the changing demand is the main
contributing factor of these discrepancies. After all, service design is not a one-size-fits-all task;
designing a service framework that meets the needs of different customers with varying needs is
still a challenge. In the context of e-Health, we find different patient groups have different
expectations of service design; therefore, we argue that a fit should exist between e-Health service
features and the preferences of different patient segments. Using the concept of “fit as matching”
(Venkatraman, 1989), this study proposes that each patient segment requires a specific set of
service features, and when the proposed service features match the patient segment, such match
will enhance service sustainability. Our research questions are summarized as follows:
1. What service features should be considered in the design of e-Health?
2. In terms of generating better service sustainability, how do e-Health service features match
different patient segmentations?
We’ve carried out this research with the cooperation of the National Taiwan University
Hospital (NTUH), one of the largest and most remarkable hospitals in Taiwan. In year 2009,
NTUH established an e-Health center for conducting a healthcare reforming project, which utilizes
physical home healthcare service and electric sensor networks to provide quality care treatment to
those patients living in distant areas (Chang et al., 2010). The outcome of this research is expected
to guide them to design sustainable e-Health services.
2. Conceptual Background
2.1 The e-Health Service in NTUH
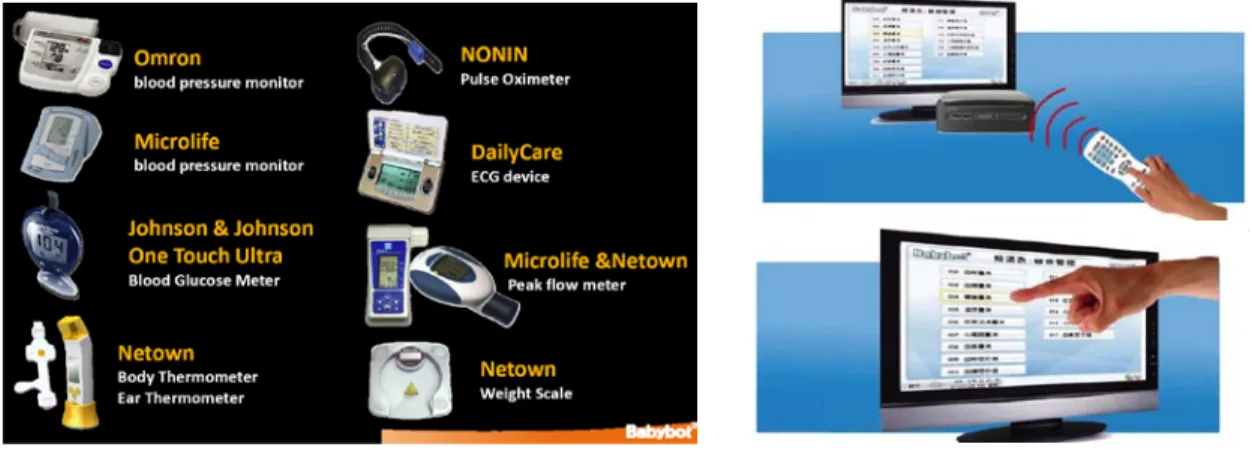
The e-Health service in NTUH emphasized the delivery of healthcare services through
different Internet-connected devices. Patients use remote controls and touch panels for uploading
their daily biometric information into the database (Figure 1). Physicians read this information
using their mobile phones and provide real-time medical advice. Subsequently, patients and their
physicians engage in an interactive video conference every week in order to discuss the data
analysis results and methods for improving the patients’ health. The NTUH e-Health service
focuses on four types of patients: (1) post-discharge patients, (2) patients suffering from
cardiovascular disease, (3) patients suffering from chronic disease, and (4) patients who require
hospice care.
Figure 1. Devices used in the NTUH e-Health service system.
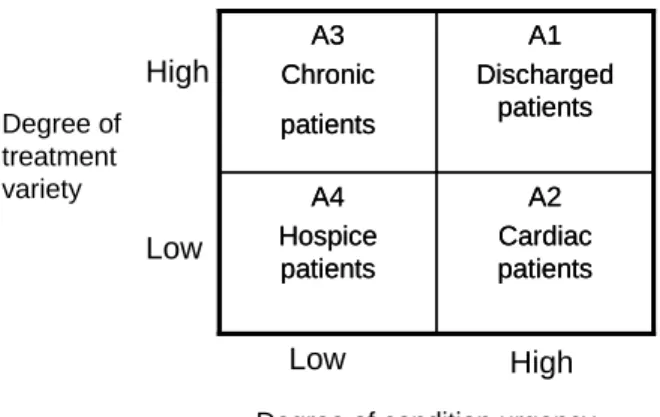
2.2 The e-Health Patient Classification
While there are several ways of classifying e-Health patients, the position taken in this
research is that e-Health service design will be aided if one can segment e-Health patients into
clusters that share certain relevant service requirements. We use “degree of condition urgency”
and “degree of treatment variety” as our evaluating criteria. Degree of condition urgency has been
used pervasively as a classification criterion, especially in treatment areas such as emergency care,
and has provided doctors with a method for understanding and treating patient problems. On the
other hand, having various treatments in one patient segment is very prevalent. For patients
suffering from several different kinds of chronic diseases, addressing these needs with different
treatments is very commonplace. In this way, categorizing patients by the degree of treatment
variety helps practitioners to optimize and allocate medical and health resources in an efficient
way. Using this classification, the patient segments in NTUH e-Health program can be
positioned in the following two-by-two matrix.
Figure 2. The e-Healthcare patient classification in NTUH
As Figure 2 shows, patients in NTUH e-Health program can be divided into the four
different segments -- A1 to A4, as defined below:
A1: Patients in this category are discharged from hospital after an operation or serious
medical crises. They suffer from urgent disease conditions and require varied treatments.
A2: Patients in this category have heart failure disease which requires urgent treatments, but
the diseases they suffer are similar.
A3: Patients in this category suffer from a variety of chronic diseases, but the conditions are
much more stable than those in A1 and A2.
A4: Patients in this category suffer from terminal cancer and need a qualitative and
comfortable hospice
treatment for their rest of life. The treatments among patients are similar,
and conditions are relatively stable.
2.3 The e-Health Service Features
Based on the service concept proposed by Goldstein et al. (2002), we outlined e-Health
service features with the following evaluative questions: by whom, what, for whom, when, and
how. These questions include:
1. Through what kind of devices are e-Health services delivered?
2. What service offerings are customized?
3. What values are e-Health services trying to achieve?
4. When the service offerings should be supplied?
5. How should services be delivered to patients?
The five design schemes are thus related to the following key ideas: device complexity,
service customization, value focus, service supply, and process complexity respectively. We will
describe each in the following section.
Device Complexity. In recent years, Internet-connected devices have shown impressive
results in advancing service delivery and making e-Health services more efficient. There are three
different types of devices that are most common in e-Health delivery. The first type relates with
the use of telecommunication technologies such as telephones to provide remote care for old
persons with physical disabilities in their own living place. The second type is the use of various
videoconferencing systems to provide interactive care. The last type is to monitor the patient’s
clinical measurements through electronic sensors in the hospital or at home (Celler et al. 1995).
We believe that the adoption of different types of devices will significantly affect the efficiency
A2 Cardiac patients A4 Hospice patients A1 Discharged patients A3 Chronic patients A2 Cardiac patients A4 Hospice patients A1 Discharged patients A3 Chronic patients
Degree of condition urgency High Low Degree of treatment variety Low High
of service delivery, and thus we consider device complexity as one service feature that needs to
be addressed.
Service Customization. Some scholars emphasize customization as a critical dimension of
service schemes (Kellogg and Nie, 1995; et al); they argue that a good service design should be
able to deal with individual customers’ problems and deliver customized solutions to meet their
needs (Karmarkar, 2004). Customization is an important dimension that has been applied in
numerous service frameworks. For example, Kellogg and Nie (1995) have differentiated service
packages into four categories of customization: unique, selective, restricted, and generic. Lovelock
(1983) believes that the amount of leeway given to customer contact personnel to exercise
judgment should be used as a dimension to define the level of customization. Silvestro et al. (1992)
state that the level of customization should be determined by the complexity of the service process.
In this research, we adopt Kellogg and Nie (1995) to define the degree of customization as the
extent of e-Health service options provided to customers.
Value Focus. Previous studies have considered value focus as an important feature of
healthcare. For example, Donabedian (1988) has indicated that the interpersonal factor, which
expresses the intangible “soft value” of a service, should be considered during the delivery of
healthcare. He argues that several soft values such as caring, friendliness, thoughtfulness,
listening, honesty, and empathy have had profound impacts on the performance of healthcare. On
the other hand, Armistead (1990) has posited that non-interpersonal attributes that can be easily
quantified (e.g. the availability of service or response time to a customer) have been applied in
several assessment scales measuring healthcare service quality. These attributes which embrace
entirely physical and calculable quantities are distinguished as hard values (Johnson 1995).
Consequently, we consider “hard or soft” value focus as another important service feature of
e-Health.
The Supply of Service Offerings. To store or inventory a service is out of the realm of
possibility (Parasuraman et al, 1988); therefore, how to make the balance between supply and
customers’ needs is another key design issue (Lovelock, 1983). For example, the demands of
patients with acute diseases and recently discharged from a hospital will be more fluctuating than
the demands of patients with stable chronic diseases, and thus the supply of service offerings
should be designed differently between these two groups of patients.
Process Complexity. According to Chase (1973), “length of customer contact” is defined as
the extent to which a customer is physically present during a service. This dimension is an
important evaluation assessment of the complexity of service process. For higher levels of
customer contact services, the service process is usually professional, more complicated than
standard services, and focuses more on front-stage processes; take for example, law consulting or
accounting services. In the lower levels of customer service processes, customer contact is
generally more simple and focuses more on back-stage processes such as car repairs; for the
customer, the only contact they will have is sending the car to the store and picking it up after it’s
repaired (Lovelock,1983, Silvestro et al, 1992). Kellogg and Nie (1995) further suggest that higher
process complexity requires a higher level of knowledge and technical support to facilitate quality
service. Since degrees of process complexity may highly affect service quality, we include it as
one important e-Health service feature.
3. Research Framework
We use the concept of “fit as matching” (Venkatraman 1989) to develop our research framework
(Figure 2).
Figure 3. Research Framework
According to the concept of “fit as matching”, the measure of fit between two variables can be
theoretically defined, and it can be tested with the external criterion of performance. Therefore,
we will use theories to derive the fit between patient segments and e-Health service features and
argue that a fit exists when the e-Health service features match the preference of different patient
segments, and such a match enhances service sustainability. In this study, patient segments are
characterized by two medical conditions: “degree of treatment varieties” and “degree of disease
urgency,” and service features are described by five dimensions of service concept: device
complexity, value focus (i. e. hard or soft value factors), service customization, supply of service
offerings, and process complexity (Lovelock, 1983; Silverstro et. al, 1993; Kellogg and Nie, 1995;
Tatikonda and Zeithaml, 2002; Johnston, 2001). Two theories are used to derive the fit:
information processing theory and service-dominant logic. Details are described below.
3.1 Information Processing Theory
According to Galbraith (1973) and Premkumar et al. (2005), information processing theory
identifies three important concepts: information processing needs, information processing
capability, and the fit between the two to obtain optimal performance. Environmental complexity,
frequent changes, and dynamism increase the need of quality information, and thus superior
information capability that can improve information flow and reduce the effect of uncertainty
becomes significant to organizations. Premkumar et al. (2005) have mentioned that such
information capability can be resulted from the redesign of business processes and integrated
information systems.
Uncertainty is greater for patients with urgent disease conditions. Healthcare practitioners require
fast, simple, and accurate information to deal with acute patients. In that situation, high levels of
device complexity, measured by the numbers and varieties of ICT-facilitated devices (e.g.,
electric sensors, video-conferencing monitors, etc.), require more efforts for interaction and
information handling, inhibiting efficiency of decision making. We thus propose that,
Patient Segments
1.Treatment variety 2. Disease urgency
e-Health Service Features
1.Device complexity 2.Value focus i)hard-attribute ii)soft-attribute 3.Customization 4.Service supply 5.Process complexity Service Sustainability FIT
P1: Patients with high degrees of disease urgency prefer service delivery with lower device
complexity than higher device complexity.
Past literature also suggests that customization require greater interaction and information
sharing with customers and joint action in the delivery process (Premkumar et al. 2004). It is not
suitable for patients who have urgent disease conditions and can not actively participate in the
delivery process. We thus propose that,
P2a: Patients with a higher degree of disease urgency prefer less- customized service.
Many past studies have proposed different discussions and definitions of process complexity; (e.g.,
Kellogg and Nie, 1995) in our research, we define process complexity in terms of the number of
back-stage process steps used in operations. If patients with a high degree of disease urgency are
treated with high process complexity, the service process will cost more time during the back-stage
steps than during front-stage part of the operation. However, in many cases the patient has an
emergency and cannot wait. Thus, we propose that,
P3: Patients with a higher degree of disease urgency prefer less complex process services.
3.2 Service-Dominant Logic
Service-dominant logic suggests that marketing should be built on a customer-centric,
market-driven, and focus on intangible resources, co-creation of value, and relationships (Vargo
and Lusch 2004). It is commonly used to study high-contact services, which the interaction is
intense as many specialists interplay with the client, who often cooperates. When the patient
segment involves multiple treatments, the service offerings are complex and related with
different activities and resources. Hult and Lukas (1995) have summarized four different types of
treatments that are used to deal with health problems, including: medical, social, cognitive, and
emotional treatments. We can expect that, when physicians need to adopt various treatment
methods, patient participation is usually necessary. Since the interaction with patients is intensive,
service-dominant logics suggests that customization is a better marketing strategy than
standardization (Teboul 2006), because physicians need to tailor their treatments to fulfill
patients’ needs. Thus, we propose that,
P2b: Patients with a higher degree of treatment variety prefer customized service.
Johnston (1995) have distinguished service value attributes from interpersonal attributes (or soft
attributes) which consists of personal social characteristic like care, courtesy, and friendliness.
Non-interpersonal attributes (hard attributes) consist of values that are quantifiable and systematic
like effeteness, functionality, and security. Service dominant logic advocates that customers
appreciate soft values when the front-stage experience is more important than back-stage
operations. In contrast, customers are concerned with hard values when managing a contact in
the front stage is not so important. In terms of our study, we propose that patients with higher
degrees of disease urgency may focus more on back-stage professionalism than front-stage
experience because services with hard attributes like responsiveness or reliability would ensure
that patients receive treatments in a timely manner. Besides, tangible and measurable value
indicators are easy to assess in the conditions of emergency. We thus propose that these types of
patients focus more on hard value than soft value. However, for patients with a higher degree of
treatment variety, intensive contact with patients is necessary, and service experience is enriched
by the increased contacts. We thus propose that these types of patients focus more on soft value
than hard value.
P4a: Patients with higher degree of disease urgency prefer hard attributes than soft
attributes.
P4b: Patients with higher degree of treatment variety prefer soft attributes than hard
attributes.
Since it’s impossible to quantify services (Parasuraman et al, 1988), understanding the extent of
demand fluctuations over time and controlling the balance between the cycle of the demand wave
and the supply/service capacity is important (Lovelock, 1983). In our case, patients with acute
diseases have more fluctuating demands than patients with stable chronic diseases. Expanding
upon this, it is clear that patients with acute diseases will need more intensive care than others.
Similarly, for patients with high degrees of treatment variety, it is more difficult to predict the
demand for different treatments, and thus the demand is more fluctuating. We can also expect
that multiple treatments request for intensive service contacts.
P5a: Patients with a higher degree of disease urgency will need more intensive service
supplies than patients with lower degree of disease urgency.
P5b: Patients with a higher degree of treatment variety will need more intensive service
supplies than patients with lower degree of treatment variety.
4. Research Methodology
Seven focus group interviews were conducted from February 2010 to May 2010. We interviewed
five physicians and six case managers across four service segments. In order to gain research
insight from each interview, we designed an interview format that embraced semi-structured
questions and specific statements that were directed to each service segment. In addition, we set
the length of interview to be at least 60 minutes to ensure a thorough examination. In order to
ensure the internal validity, external validity, construct validity, and reliability of case study, we
applied Yin (2003)’s tactics for the case study phases. The analyzed results of the interviews
applied to our research framework are summarized in following section.
5. Case Analysis
5.1 Framework Application
In different situations, understanding which service feature is more suitable for different patient
segments is essential to service sustainability. In this section, we will interpret the cases in light of
the research framework we proposed in the earlier section (Figure 3).
Device Complexity. Device complexity is measured by “the number of e-sensors or ICT
applications used in a patient segment.” In general, A1 has the lowest level of device complexity.
One physician commented, “We don’t use overly complex devices, because it’s hard for one
single device to cover all the needs of the disease.” The analysis results are shown in Table 2a.
Table 2a. Cross-case analysis result: device complexity
Patient segment A1 A2 A3 A4
Device complexity Low (1 device) High (6 devices) Medium (3 devices) Medium (2 devices)
In A1, only telephones are involved as an ICT device. In A2, six ICT devices are involved: the telephone, electrocardiogram, hemadynamometer, glucometer, scales, and thermometer. A3 also relies on IT device, though only 3 in total are involved: the telephone, hemadynamometer, and glucometer. 2 ICT devices, telephone and webcam monitor are involved in A4.
Value Focus. Hard values especially are emphasized in cardiovascular disease care (A2). From the
case manager’s perspective, these include providing “first aid” service to prevent any problem
occurring or giving the patient a way to call in for food or medicine consulting. One case manager
cited from patients’ point of view that “the most important value is their disease condition can be
monitored intensively in case of any emergency happened. That’s why our service is 24 hours
available. Once they have any question, they can call back soon.” The analysis results are
summarized in Table 2b.
Table 2b. Cross-case analysis result: value focus
Patient segment A1 A2 A3 A4
Value focus Hard Hard Soft Soft
A1 and A2 focus on hard values, such as the service availability and emergency prevention procedures, because the main objective of these two divisions is to monitor the patient’s condition. Unlike A1 and A2 division, patients in A3 have a stable condition and need long-term care so interpersonal value was emphasized by A3 in order to keep a long term relationship with patients. To the hospice care department (A4), providing warm and soft value to relieve patient stress and stabilizing their minds are the main priorities.
Customization. We define customization by, “the number of service options offered in the service
category”, which indicates that the more service items provided, the higher the possibility that the
service can be customized to meet the customer needs. In this study, A4 is marked as the highest
service customization among four cases by providing more than 6 service offers. More details can
be referred to Table 2c.
Table 2c. Cross-case analysis result: customization
Patient segment A1 A2 A3 A4
Customization Low Medium Medium High
All the segments have call in/out services. Besides, A2, A3, and A4 monitor patients’ conditions through devices. Moreover, A3 provides medicine usage consults and helps patients schedule an appointment. A4 provide the most services, including call in/out service, tele-consultations, religious, psychologist, spiritual mentor, and pain alleviation.
Service Supply. In general, A2 has the most intensive service supply. Case managers provide
24-hour tele-consultation to patients through video conferences or telephonic interviews. If the
case managers identify any symptoms that demand immediate attention, they provide immediate
guidance to the patient and alert the patient’s physician. More details can be referred to Table 2d.
Table 2d. Cross-case analysis result: the supply of service offerings
Patient segment A1 A2 A3 A4
Service supply Medium High Low Low
In A1, a designated line is provided to patients from 8:00 a.m. to 9:00 p.m. every day. If required, case managers can organize a follow-up health check. In A2, 24-hour tele-consultation is provided to patients every day. In A3 and A4, 12-hour call-in service is provided to patients in the week days.
Process Complexity. We define process complexity as number of operation steps involved in the
service. In the A1 division, the operations are much simpler than that of other divisions. The
process of call-in service follows a fixed standard of operations that is well-structured. More
details can be referred to Table 2e.
Table 2e. Cross-case analysis result: process complexity
Patient segment A1 A2 A3 A4
Process complexity Low Medium Medium High
A1, A2, and A3 follow a relatively more standard process than A4. But the processes of A2 and A3 are a little more complicated than A1 because patients need to upload their physiological data daily. The operation process of A4 is the most complicated of the other three divisions. If a patient has a need for pressure relief, then a case manager might find and use outside resources, such as linking the patient with a psychologist.
Service Sustainability. We consider the rate of case withdrawal to be the key measurement in that
a lower rate of case withdrawal is associated with a larger number of patients who would like to
continue this service, and thus a higher potential for service sustainability. The data was acquired
from October 2009 to May 2010, showing that the average rate of case withdrawals in A1 was
5.59%, A2 was 33.1%, A3 was 18.75%, and A4 was zero (Table 3).
Table 3. Cross-case analysis result: service sustainability
Patient segment A1 A2 A3 A4
Case enrolled 423 242 32 38
Case withdrawal 23 80 6 0
Rate of case withdraw 5.59% 33.1% 18.75% 0 Rate of case continuance 94.41% 76.9% 81.25% 100%
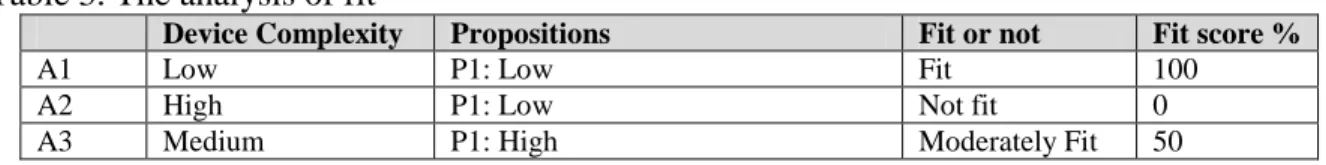
5.2 The Analysis of Fit
In this section, we analyze the fit for the four cases. For each case, we evaluate the fit by
calculating the percentages of propositions are met. Taking A1 as an example, we propose that
A1 patients with high disease urgency prefer lower device complexity (P1). The results of case
analysis show that A1 has the lowest device complexity, with only one device incorporated into
the services, and thus fits our proposition. The results are shown in Table 3.
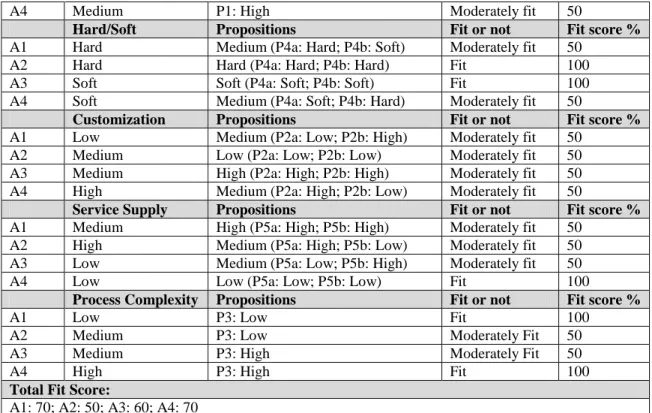
Table 3. The analysis of fit
Device Complexity Propositions Fit or not Fit score %
A1 Low P1: Low Fit 100
A2 High P1: Low Not fit 0
A4 Medium P1: High Moderately fit 50
Hard/Soft Propositions Fit or not Fit score % A1 Hard Medium (P4a: Hard; P4b: Soft) Moderately fit 50
A2 Hard Hard (P4a: Hard; P4b: Hard) Fit 100 A3 Soft Soft (P4a: Soft; P4b: Soft) Fit 100 A4 Soft Medium (P4a: Soft; P4b: Hard) Moderately fit 50
Customization Propositions Fit or not Fit score % A1 Low Medium (P2a: Low; P2b: High) Moderately fit 50
A2 Medium Low (P2a: Low; P2b: Low) Moderately fit 50 A3 Medium High (P2a: High; P2b: High) Moderately fit 50 A4 High Medium (P2a: High; P2b: Low) Moderately fit 50
Service Supply Propositions Fit or not Fit score % A1 Medium High (P5a: High; P5b: High) Moderately fit 50
A2 High Medium (P5a: High; P5b: Low) Moderately fit 50 A3 Low Medium (P5a: Low; P5b: High) Moderately fit 50 A4 Low Low (P5a: Low; P5b: Low) Fit 100
Process Complexity Propositions Fit or not Fit score %
A1 Low P3: Low Fit 100
A2 Medium P3: Low Moderately Fit 50
A3 Medium P3: High Moderately Fit 50
A4 High P3: High Fit 100
Total Fit Score:
A1: 70; A2: 50; A3: 60; A4: 70
We then compared the service sustainability and the fit scores of the four cases. In Figure 4, it
shows the fit between patient segment and service features can contribute the service sustainability,
thus supporting our earlier propositions.
Figure 4. Cross-analysis of four cases
6. Discussion and Conclusion
Nowadays, e-Health service is becoming a very important issue in aging societies, especially when
many governments are aiming to provide cost- efficient and high quality healthcare services to
people in need. This research discusses the fit between patient preferences and service features.
We propose two dimensions of patient segmentation: (1) degree of disease urgency, (2) degree of
treatment variety, and five service features: (1) device complexity, (2) value focus, (3) service
supply, (4) process complexity, and (5) customization.
To test our framework, we incorporated a thorough focus group interview and a case study at
NTUH, conducted from February of 2010 to December of 2010 to gain general research insights.
After collecting and analyzing our data, we found that our results closely matched our pervious
0 20 40 60 80 100 A1 A2 A3 A4 Case continuance Fit score
propositions. Therefore, in order to improve service sustainability, e-Health service systems
should match the service features with patient preference.
The results of this study can help NTUH to improve their service offerings. For example,
Table 3 and Figure 4 show that A2’s service sustainability is highly decreased by its unstable and
complicated devices. In fact, the current devices such as electrocardiogram and
hemadynamometer used in A2 would not help in providing first-aid service to any patient with a
sudden heart failure. The results also show that A3 can improve its sustainability by increasing
customized service options. This finding is consistent with the observation of one physician in
A3 sector, “Our patients want more available customized services to fulfill their diverse needs.”
With regard to A4, webcam is the device used to monitor patients’ disease condition and keep
them company, but patients somewhat complained about quality of pictures and weak connection
signals while patients stay at remote sites. So A4 can enhance service sustainability by improving
the quality of the device which is an important channel between case manager and patients. At last,
A1 segment has the best fit of all four divisions, thus boasting high service sustainability.
Currently, the hospital personnel in A1 would call out the first, third, fifth, seventh, and 30th day
after patients discharge to make sure no emergencies occurred. We suggest that increasing the
call-out frequency after the first week of discharge may improve its sustainability even further.
This study has limitations. The major one was that we were not able to do an empirical study
because we couldn’t acquire any patient data, as a result of the privacy policies at the hospital. In
the future, this will still be a challenge to overcome.
References
1. Armistead C.G. “Service Operations Strategy: Framework for Matching the Service Operations Task and the Service Delivery System,” International Journal of Service Industry Management, (1:2), 1990, pp. 6-17.
2. Chang H., Shaw M., La F., Ko W., Ho Y., Chen H., Shu C. “U-Health: an Example of a High-Quality Individualized Healthcare Service”, Journal of Personalized Medicine, (7:6), 2010, pp.677-687. 3. Chase R. B. “Where Does the Customer Fit in a Service Operation?” Harvard Business Review,
(56:4), 1978, pp. 137-142.
4. Celler B.G., Earnshaw W., Ilsar E.D., Betbeder -Matibet L., Harris M.F., Clark R., Hesketh T., and Lovell N.H. "Remote Monitoring of Health Status of the Elderly at Home. A multidisciplinary Project on Aging at the University of New South Wales", International Journal of Bio-Medical Computing (40:2), 1995, pp.147-155.
5. Donabedian A. “The Quality of Care: How Can It Be Assessed?” Journal of the American Medical
Association, (260:12), 1988, pp. 1743–1748.
6. Eysenbach G. “What is e-Health?” Journal of Medical Internet Research, (3:2), 2001, e20 7. Galbraith, J.R. Designing Complex Organizations. Reading, MA; Addison-Wesley, 1973.
8. Goldstein S. M., Johnston R., Duffy J. and Rao J. “The Service Concept: The Missing Link in Service Design Research?” Journal of Operations Management, (22:2), 2002, pp.121–134.
9. Hult G.T.M. and Lukas B.A. “Classifying Health Care Offering to Gain Strategic Marketing Insights,”
Journal of Service Marketing,” (9:2), 1995, pp. 36-48.
10. Johnston R. “The Determinants of Service Quality: Satisfiers and Dissatisfiers,” International Journal
of Service Industry Management, (6:5), 1995, pp. 53-71.
11. Johnston R. and Clark, G. Service Operations Management, Prentice-Hall Press, UK, 2001.
12. Karmarkar U. “Will You Survive the Services Revolution?” Harvard Business Review, (82:6), 2004, pp. 100–108.
13. Kellogg D. L. and Nie W. “A Framework for Strategic Service Management,” Journal of Operations
Management, (13:4), 1995, pp. 323–337.
14. Lovelock, C.H. "Classifying Services to Gain Strategic Marketing Insights", Journal of Marketing, (47), 1983, 9-20.
15. Parasuraman A., Zeithaml V. A., Berry L. L. “SERVQUAL: A Multiple-Item Scale for Measuring Customer Perceptions of Service Quality,” Journal of Retailing, (64:1), 1988, pp. 12–40.
16. Premkumar, G., Ramamurthy, K., and Saunders, C. S. “Information Processing View of Organizations: An Exploratory Examination of Fit in the Context of Interorganizational Relationshps,” Journal of
Management Information Systems (22:1), 2005, pp. 257-294.
17. Ruggiero C., Sacile R., Giacomini M. “Home Tele-care”, Journal of Telemedicine and Telecare, (5:1), 1999, pp. 11–17.
18. Silvestro R., Fitzgerald L., Johnston R., Voss C. “Towards a Classification of Service Processes,”
International Journal of Service Industry Management, (3:3), 1992, pp 62–75
.
19. Tatikonda M. V. and Zeithaml V. A. Managing the New Service Development Process: Multi-Disciplinary Literature Synthesis and Directions for Future Research. In T.Boone and R.Ganeshan (Eds.), New Directions in Supply-Chain Management, New York, 2001, pp. 200–233. 20. Teboul J. Service is Front Stage: Positioning Services for Value Advantage, INSEAD Business Press,
England, 2006.
21. Vargo S. L. and Lusch R.F. “Evolving to a New Dominant Logic for Marketing,” Journal of
Marketing, (68), 2004, pp. 1-17.
22. Venkatraman N. “The Concept of Fit in Strategy Research: Toward Verbal and Statistical Correspondence,” Academy of Management Review, (14:3), 1989, pp.423–444.
出席國際學術會議心得報告
本人出席 ICEC 國際學術會議,並發表論文。其心得報告分述如下:
ICEC—The 17
thInternational Conference on Electronic Commerce
計畫編號
NSC
103-2410-H-004 -106
計畫名稱
電子化健康服務管理議題研討:服務設計,服務遞送,服務績效
出國人員姓名
服務機關及職稱
張欣綠,國立政治大學資訊管理學系
會議時間地點 Seoul, Korea
會議名稱
中文:第十七屆國際電子商務會議
英文:The seventeenth international conference on electronic commerce
發表論文題目 Examine the effects of social media marketing on tourism
一、
參加會議經過
The International Conference on Electronic Commerce (ICEC) has been one of the first and premier
information systems conference specializing on e-commerce issues since 1998. There are two themes in
this year conference. One is the conference topic -- application of big data in e-commerce. Another
theme of the conference is the revitalization. Hanyang University hosted the conference, featuring two
keynote speeches, 25 paper sessions, and 4 free tutorial session. My paper was arranged in C2 section
(social media), the first afternoon session on August 4.
二、
與會心得
Besides my paper, two interesting papers were presented in the sessions that I participated. One paper is entitled "Reconceptualization of SNS Use in Orgnaizations" by Yoon Kim,Jae Yun Moon, and Ji Hye Park from Korea University. The title of the other paper is "The business value of firms' social media efforts: evidence from Facebook," by Sunghun Chung, Animesh Animesh, Kunsoo Han, and Alain Pinsonneault.
參、 建議
Comments to the paper are summarized below.
1. The subject of this paper is interesting and practical.
2. Presentation of this paper is clear and comprehensible.
3. Suggested to apply the propensity score mathcing method to address a slection bias issue in a more
rigorous way.
4.
Suggested to look at the nature of campaigns and code their characteristics (e.g., design
characteristics) to make the paper more interesting.
肆、 攜回資料名稱及內容
A. Conference paper abstracts B. Conference program outline
C. Revision strategy and comments to my presented paper
伍、發表論文
Examining the Effect of Social Media Marketing
in Tourism
Hsin-Lu Chang
National Chengchi University
Taipei 11605, Taiwan
[email protected]
Dai-Yu Wu
National Chengchi University
Taipei 11605, Taiwan
[email protected]
ABSTRACT
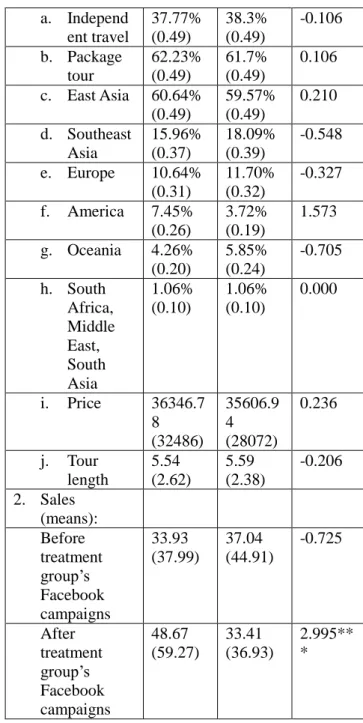
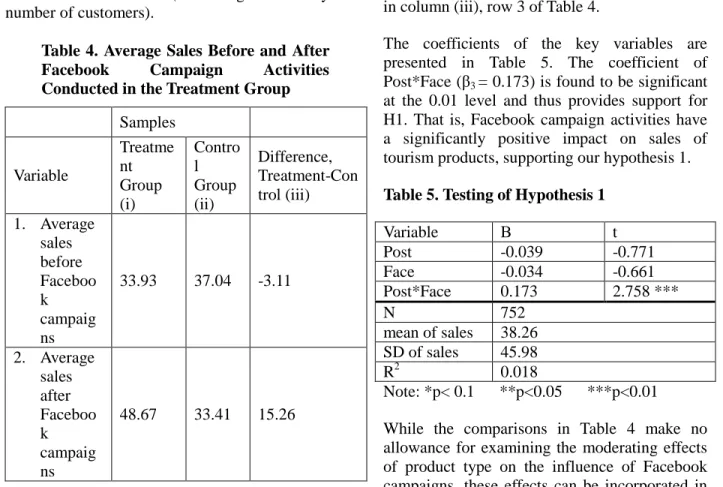
A growing number of travel agencies in the tourism industry use social media to promote their services and reach target customers despite some doubt regarding the effectiveness of these tools. Nevertheless, few researchers have examined the effects of social media marketing, and especially its effects on sales. Therefore, our study aims to assess the impact of social media on the purchase of tourism products. Additionally, to explore whether the influence of social media marketing changes among different types of tourism products, we develop a typology of tourism products that classifies tourism along the following five dimensions: (1) the structure of tourism, (2) the involvement of tourists, (3) the scope of tourism, (4) the price of products, and (5) the length of a tour. All tours with Facebook campaigns conducted by our case company from February 1, 2012 to November 30, 2013 are selected as our target tourism products. Moreover, we choose certain products without Facebook campaigns that were available for purchase during the same time period as a control group. We obtain the sales data from the case company and calculate the sales of each product before and after the Facebook campaigns. We then apply a difference-in-difference approach, comparing the average changes in sales performance of the treatment group with those of the control group. The results show that Facebook campaign activities have a positive impact on purchases of tourism products. Furthermore, sales are more likely to increase when a travel agency promotes products that are less structured, limited in scope, relatively lower-priced, or require less tourist involvement.
Keywords
Social media marketing, tourism, travel agency,
social media performance, Facebook campaign. INTRODUCTION
In tourism, social media have dramatically changed how consumers plan and buy travel-related products (Buhalis and Law 2008). A study conducted by the Opinion Research Corporation indicates that 82 percent of respondents expressed that they had checked online reviews, blogs, and other online customer feedback before purchasing a travel-related product, accounting for the largest portion of all products and services (eMarketer 2008). As social media have appeared to gradually change existing marketing practices on a fundamental level, companies cannot ignore this new marketing channel. However, companies appear to have different views on the effect of social media marketing. According to the Social Media Marketing Industry Report in 2013, 97 percent of marketers indicate that they participate in social media marketing, but only approximately one in four marketers claim that they are able to measure the return from their social media activities. Additionally, regarding the effectiveness of Facebook marketing, 37 percent of marketers agree that their Facebook efforts are effective, whereas the remainders are uncertain or have opposite opinions (Stelzner 2013).
A number of studies have discussed opportunities related to social media marketing and provided strategies and principles for utilizing online social networking applications for managers (e.g., Berthon et al. 2012, Kaplan et al. 2010); however, few researchers have examined the effects of social media marketing, especially the effects on sales. Moreover, although some studies have focused on the important influence of social media usage such as online reviews or word of mouth in the travel planning process (Sparks and Browning 2011, Chen et al. 2013), few studies have considered the effect of social media on travel-related purchasing decisions.
Therefore, our study aims to assess the effects of social media marketing in the tourism industry Permission to make digital or hard copies of all or
part of this work for personal or classroom use is granted without fee provided that copies are not made or distributed for profit or commercial advantage and that copies bear this notice and the full citation on the first page. Copyrights for components of this work owned by others than the author(s) must be honored. Abstracting with credit is permitted. To copy otherwise, or republish, to post on servers or to redistribute to lists, requires prior specific permission and/or a fee.
Request permissions from [email protected].
ICEC '15, August 03-05, 2015, Seoul, Republic of
by examining the influence of social media on the purchase of tourism products. We are also interested in exploring whether the influence of social media marketing changes among different types of tourism products. The results can help companies in the tourism industry to justify the financial outcome of social media marketing and further enhance their understanding of which types of tourism products are suitable for selling through social media.
CONCEPTUAL BACKGROUND Social Media Activities in Tourism
Bernoff and Li (2008) have found that companies launch social media for five different purposes-- listening, talking, energizing, supporting, and managing. Among them, talking and energizing directly link to marketing and sales. Bernoff and Li (2008) have noted that social media are widely used as a “talking” channel by which companies can promote products and services to customers. Companies also use social media to “energize” enthusiastic customers to increase sales. In tourism, we note that companies conduct social media campaigns for similar reasons. For example, Malaysia's low-cost airline AirAsia conducted the Friendsy campaign to increase brand awareness of Sydney as a new Australian hub. The company developed a Facebook app showing a virtual plane that AirAsia’s fans could fill with 302 of their Facebook friends. The winner of the campaign would have an opportunity to take their friends from Sydney to Kuala Lumpur, where they would then spend three nights with accommodations paid for by AirAsia, before returning home on their private plane. As a result, the AirAsia Facebook fan base grew by 30 percent, and the Friendsy competition reached 2,291,483 people on Facebook. The campaign helped achieve an average 82.5 percent load factor on all routes from Sydney, exceeding the initial goal of AirAsia (Facebook Studio 2013).
Obermutten is another noted example of the use of social media marketing. This village, located in Switzerland's remote mountain region of Graubunden, uses Facebook to increase
awareness of this place that has fewer than 80 residents. Obermutten began a campaign that allows anyone who likes the village's Facebook page to have their pictures posted on the village bulletin board. Because generating the connection between the online world and this remote village attracts attention from users all over the world, the Facebook page quickly reached more 40,000 fans. Additionally, this activity also draws traffic to the Graubunden tourism website, with visits increasing by 250 percent. An effort that cost 10,000 Swiss francs resulted in the media equivalent of $2.4 million, with approximately 60 million media impressions (Advertising Age 2012).
The above-mentioned examples show that various social media activities are conducted by travel providers to serve different objectives with respect to talking and energizing. In this study, we would identify these types of social media activities from all the campaigns conducted on the Facebook fan page of our case company and further explore their influences by examining changes in the sales of its tourism products. Moreover, we would explore whether these influences change with the promotion of different types of tourism products.
Media Effects with Different Types of Products The suitability of the media for marketing to consumers greatly depends on the characteristics of the marketed products and services (Peterson et al., 1997). Legg and Baker (1987) proposed that the effectiveness of service advertising depends on both the service type and the media forms that are selected. Therefore, it is necessary to clearly consider product and service characteristics when evaluating the effects of media.
Some early research suggested that different categories of products were likely to affect the marketing performance of traditional media (e.g., Stafford and Day 1995). Some more recent studies explored the effects of Internet advertising campaigns on different types of products (e.g., Choi and Lee 2012). There are also studies interested in comparing Internet
with traditional media with respect to the marketing effects based on types of products (Dijkstra et al. 2005, Peterson et al. 1997, Yoon and Kim 2001). However, few studies have examined the effectiveness of social media based on different types of products.
In this study, we would investigate the effectiveness of social media along five dimensions of tourism products:
(1) Structure of tourism (structure versus independence)
Highly structured travel refers to trips that are to a large extent arranged by travel agencies. This type of tour generally contains transportation, food, accommodation and entertainment, which are advertised and sold together at an inclusive price. In contrast, independent travel does not include a set of scheduled sightseeing activities, and hence, tourists have more flexibility in making their own travel arrangements.
(2) Involvement of tourists (stimulation versus tranquility)
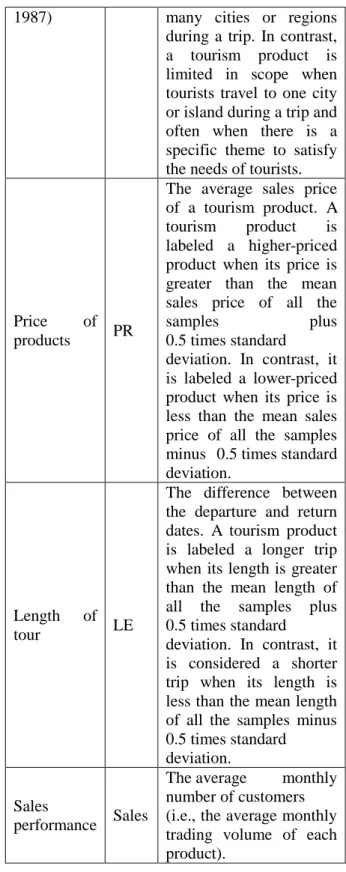
Stimulation indicates a desire for high levels of interaction with surrounding environments that can be satisfied by participating in adventure activities, water sports (e.g., sailing, scuba diving, whitewater rafting) or winter activities (e.g., skiing, snowboarding). In contrast, a more tranquil journey involves little interaction with the local environment. Tourists merely want to relax and escape to a vacation destination. They enjoy the change of pace and want to take it easy during their stay (Dolnicar and Leisch, 2003). (3) Scope of tourism (broad versus limited) Specific tourism proposed by Lew (1987) means that tourism is limited in scope and there is often a specific theme to satisfy the needs of tourists. An island destination is usually regarded as specific tourism. In contract, when tourists visit many cities or regions during a trip, we consider the tourism is broad in scope.
(4) Price of products (high versus low)
The cost of tourism to visitors includes the cost
of transportation to and from the destination and the cost of ground content, such as accommodation, tour services, food and beverages, and entertainment (Dwyer et al. 2000). In our study, tourism products were classified as either higher- or lower-priced based on their selling price.
(5) Length of tour (long versus short)
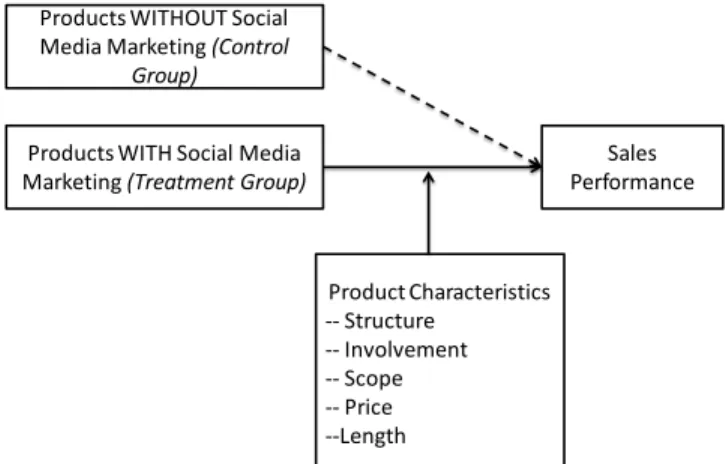
Length of stay is one of the key elements in a tourist’s decision-making process, and promotional campaigns must therefore be adjusted to the tourist’s decisions with regard to the length of time spent at a destination (Martínez-Garcia and Raya, 2008). In this study, tourism products were classified as either longer or shorter trips based on duration of travel. Our conceptual framework is shown in Figure 1. We aim to explore the effect of social media marketing on sales performance and examine the moderating effects of various product characteristics. Therefore, two research questions would be answered: (1) can social media marketing facilitate the sale of tourism products, and (2) what types of tourism products are more suitable to conduct social media marketing activities for increasing sales, whereas what types of products are less suitable?
Figure 1. Conceptual Framework
Products WITHOUT Social Media Marketing (Control
Group)
Products WITH Social Media Marketing (Treatment Group)
Sales Performance Product Characteristics -- Structure -- Involvement -- Scope -- Price --Length
HYPOTHESIS DEVELOPMENT
Traditional E-Commerce Marketing Versus Social Media Marketing
Traditional e-commerce is enabled by Web 1.0, featuring one-way communication. Social commerce is enabled by Web 2.0, a platform that allows bidirectional communication, making consumers become better informed than ever before (Baghdadi 2013). According to Stephen and Toubia (2010), social media allow people to actively participate in the marketing and selling of products and services in online communities. Moreover, Kim and Hawamdeh (2011) state that companies utilize social media that help them improve their marketing strategies, increase website traffic and improve sales. That is, traditional e-commerce marketing has some weaknesses that can be complemented by social media, and thus, companies that incorporate social media marketing into traditional EC marketing can generate better sales.
Some companies can indeed increase sales using social media marketing activities. Dell, for example, state that its use of Twitter has generated $1 million in incremental revenue resulting from sales alerts (Kaplan et al. 2010). The Royal Opera House in London makes 30 percent of its sales through its Facebook fan page (Ang 2011). Old Spice, an American brand of male grooming products, successfully increases its sales through posting on YouTube with millions of downloads, humorous tweets on Twitter, and the creation of a massively popular fan page on Facebook (Berthon et al. 2012). Therefore, we expect that tourism agencies can increase the sales of tourism products with the assistance of social media marketing. Our hypothesis is as follows:
H1. Marketing tourism products in dual channels (i.e., e-commerce and social media) is likely to achieve better sales performance than simply marketing in traditional e-commerce.
Effect of Social Media Marketing on Tourism Products
Structure of Tourism
The structure of tourism indicates the level of planning that is performed by travel agencies. Accordingly, highly structured travel refers to trips that are to a large extent arranged by travel agencies, such as package tours. In contrast, less structured travel refers to trips that are primarily planned by tourists themselves, such as independent travel, flight and hotel packages. According to Lo et al. (2011), people who like to share travel photos on social networking sites appear to prefer independent travel rather than package tours. Such individuals are more likely to become acquainted with locals and even attempt to learn some of the local language. Shih (2011) also notes that Facebook can be a preferable channel for companies to market independent travel compared with package tours because independent travel typically requires more conversations between companies and tourists than package tours do, and Facebook can thus provide a more flexible channel for companies to discuss with customers in terms of travel dates and travel plans compared with traditional websites. Our hypothesis is as follows:
H2. Incorporating social media into the marketing of independent travel is more likely to increase the sales than in the marketing of package tours.
Involvement of Tourists
A high-involvement tourist refers to an individual’s need for active stimulation from his/her surrounding vacation environment. Their desires can be satisfied by physical or adventure activities that require more interactions with the surrounding environment. In contrast, those who prefer tranquil environments tend to have little interaction with local tourist attractions.
One of the main characteristics of social media is that these media gather engaged and active participants of a given company (Kaplan et al., 2010). Bartram (2001) has stated that increased
exposure of adventure activities in the media may indeed stimulate involvement in an activity. Additionally, those who primarily use social media to share their trips appear to want a deeper, more authentic travel experience (Lo et al., 2011). Therefore, using social media to promote tourism products that include more exciting activities may attract active users and increase their intention to engage in these activities and to subsequently purchase the products. Thus, our hypothesis is formed as follows:
H3. Incorporating social media into marketing products that require greater tourist involvement is more likely to increase sales than in marketing products that require less tourist involvement. Scope of Tourism
According to Section 2, tourists may have fewer opportunities to gain a deeper understanding of local destinations when tourism is broad in scope. In contrast, specific tourism is relatively limited in scope, such as visiting only one city or island during a trip. Moreover, there is often a specific theme to satisfy the needs of tourists. According to Lew (2008), specialty tourism products that are different from mass tourism destinations may have less information available and may be treated with greater caution by consumers. However, advances in communication technology and social media have led to rapid growth in special-interest travel destinations and experiences as well as travel to more remote corners of the globe. Therefore, tourism businesses can also participate in online social media to build a web presence and reputation for these products. For example, providing special interest blogs and tailoring the content may be an effective approach to target specific interest groups (Schmallegger and Carson 2008). Consequently, we hypothesize as follows:
H4. Incorporating social media into marketing tourism that is limited in scope is more likely to increase sales than in marketing tourism that is broad in scope.
Price of Products
When the price of a product is relatively high, customers tend to search for more information (Beatty and Smith 1987). Because product price is a stimulus for customer thinking, high-priced products lead customers to devote more thought to their purchase intentions (Wathieu and Bertini 2007). Additionally, product price is related to perceived risk (Wang and Chang 2013). That is, higher risk is involved when selecting products with higher prices.
According to the research findings of Wang and Chang (2013), if a product’s price is relatively high, then the information and recommendations provided by strong-tie contacts from Facebook have a more significant effect on purchase intentions than the information and recommendations provided by weak-tie sources from Facebook. However, this effect is not found for low-priced products. Accordingly, we expect that interpersonal influence and communication on social media are more important when consumers consider buying relatively high-priced tourism products. Thus, we develop the following hypothesis:
H5. Incorporating social media into the marketing of higher-priced tourism products is more likely to increase sales than in the marketing of lower-priced tourism products. Length of Tour
In general, the risk of travel increases with the length of stay. Consequently, the anticipation of a longer trip stimulates more information search (Fodness and Murray, 1999). According to Tsiotsou and Ratten (2010), Web 2.0 technologies can foster the sharing of information and lower product uncertainty. Additionally, Litvin et al. (2008) described online interpersonal influence or eWOM as a potentially cost-effective means of marketing tourism, especially for high-risk tourism products. Therefore, we believe that social media supported by Web 2.0 technologies can be an effective tool to reduce the perceived risk of a longer trip and thus to promote better marketing effects. Our hypothesis is as follows:
H6. Incorporating social media into the marketing of longer trips is more likely to increase sales than in the marketing of shorter trips.
RESEARCH METHODOLOGY Case Background
The tourism industry has grown and developed into one of the largest businesses in the world because of the increased interest in leisure activities. For outbound tourism from Taiwan, the official tourism bureau indicated that the total count of overseas travel in 2012 was greater than 10.2 million. Approximately 20.6 percent of people traveled abroad at least once in 2012. Moreover, approximately 85 percent of them have sought the assistance of travel agencies, whereas less than 5 percent of people would entrust their domestic travel to travel agencies. In view of the importance of international travel for travel agencies, we would focus on this type of travel product of our case company (called Company A).
Company A was founded in 1978 and is one of the most well-known travel agencies in Taiwan. Company A has three subsidiary companies, one of which takes responsibility for managing e-commerce and online marketing. The company sells various tourism products on the official website, including domestic travel, international travel, personal travel, corporate travel, and inbound tourism. When business would most likely benefit from the advantages of Web 2.0 applications, Company A began to exploit them for interactions with consumers. Company A built its own Facebook business fan page as a marketing platform to interact with its consumers since September 2009, and the page currently has more than 250,000 Facebook fans.
Based on our interview with their e-commerce managers, we understand that the Facebook fan page manager encounters problems in developing effective campaigns for a particular tourist product. The page manager makes ad hoc decisions, which are mostly based on heuristic methods. Furthermore, they lack direct evidence to justify the investments on
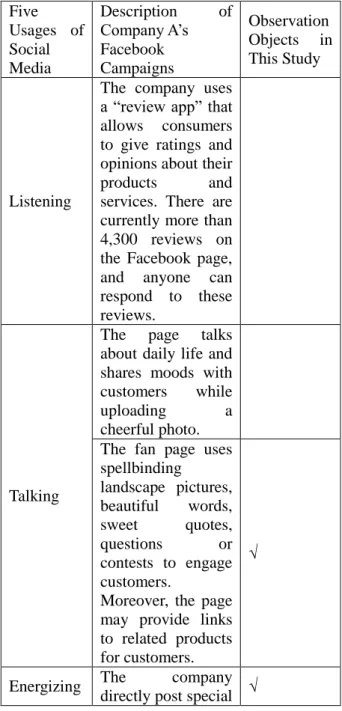
Facebook, which affects the budget allocation of the e-commerce expense in a great amount. According to prior literature on the five uses of social media (Bernoff and Li 2008, Li and Soonius, 2012), we classified Company A’s Facebook campaigns which have been posted and identified those that would be studied in this research (see Table 1).
Table 1. Classification of Company A’s Facebook Campaigns Five Usages of Social Media Description of Company A’s Facebook Campaigns Observation Objects in This Study Listening
The company uses a “review app” that allows consumers to give ratings and opinions about their products and services. There are currently more than 4,300 reviews on the Facebook page, and anyone can respond to these reviews.
Talking
The page talks about daily life and shares moods with customers while uploading a cheerful photo. The fan page uses spellbinding landscape pictures, beautiful words, sweet quotes, questions or contests to engage customers.
Moreover, the page may provide links to related products for customers.
√
Energizing The company directly post special √
offers and links on Facebook.
Supporting
When customers raise questions about their products or services, the company can address customers’ doubts quickly. Managing Company A does not use Facebook as an internal tool for sharing knowledge or recruiting new employees. Data Collection
First, we identified all international tours that have been marketed using any of the Facebook campaigns listed in Table 1. All the tours with campaigns conducted from February 1, 2012 to November 30, 2013 were selected as our target tourism products. Because we want to inspect the changes in the sales of tourism products before and after Facebook campaigns, we excluded the products if the product has been ready to sell just few days before the marketing campaigns are posted or the product would be removed from online store soon after the campaigns (i.e., there might be no purchase order for the product before or after Facebook campaigns). We obtained the sales data of all our target products from Company A.
The manager of the case company indicated that the sales price of each product changes over time, and hence the company uses the number of customers to evaluate annual sales performance. Therefore, according to the trading volume of each target product, we calculated the average monthly number of customers to measure sales performance before and after the Facebook campaigns. Additionally, because some products might be the subjects of more than one campaign, for each target product, we calculated the sales (i.e., the average monthly
number of customers) before and after the first campaign activity began. However, if the length of time between the first campaign and any subsequent ones to market the same product exceeded four months, we also calculated the sales performance before and after the later campaign to examine its influence on the target product.
Essentially, we calculated the sales result of each target product based on its sales start and end dates. That is, for each target product, sales performance of pre-Facebook campaign was measured from its sales start date to the time when its first Facebook campaign was conducted. Sales performance of post-Facebook campaign was calculated from the first Facebook campaign to its sales end date. However, there are long and short periods for products sold in the store. Hence, if the sale's start date was earlier than three months before the first Facebook campaign, the sales performance was calculated based on the three-month sales data before the first campaign. Additionally, if the sale’s end date was later than three months after the first Facebook campaign concluded, the sales result was calculated based on the first three-month sales data after the campaign was conducted. To examine the effects of Facebook marketing activities based on different types of tourism products, the measurements of tourism product classification, including the structure of tourism (ST), the involvement of tourists (IN), the scope of tourism (SC), the price of products (PR) and the length of tour (LE), are defined in Table 2. Another point to note is how to determine the price and the length of a product. Although package tours and independent group trips had fixed departure and return dates, consumers who bought flight and hotel packages could decide their length of stay at tourism destinations for themselves. Therefore, for each flight and hotel package, the number of travel days was decided by calculating the average length of tour in the sales data. Additionally, travel agencies sell the same product at different prices that vary according to the moment, the place of purchase