科技部補助專題研究計畫成果報告
期末報告
探討在臺灣學校中反生產力行為之系列研究(I)
計 畫 類 別 : 個別型計畫 計 畫 編 號 : MOST 103-2410-H-004-143- 執 行 期 間 : 103 年 08 月 01 日至 104 年 07 月 31 日 執 行 單 位 : 國立政治大學教育學系 計 畫 主 持 人 : 胡悅倫 共 同 主 持 人 : 莊俊儒 計畫參與人員: 碩士班研究生-兼任助理人員:巫幼芸 博士班研究生-兼任助理人員:洪兆祥 報 告 附 件 : 出席國際會議研究心得報告及發表論文 處 理 方 式 : 1.公開資訊:本計畫涉及專利或其他智慧財產權,2 年後可公開查詢 2.「本研究」是否已有嚴重損及公共利益之發現:否 3.「本報告」是否建議提供政府單位施政參考:否中 華 民 國 104 年 08 月 17 日
中 文 摘 要 :
「探討在臺灣學校中反生產力行為之系列研究(I)」計劃包 含四項子研究,其中英文摘要如下:
一、 Examining the Counterproductive Work Behaviors within Taiwan Academic Setting: A Pilot Study 台灣學 術界中反生產力行為之前導研究
Most mainstream occupational studies tend to focus more on the factors that instill a positive work environment. In reality, besides these positive factors, negative factors such as Counterproductive Work Behaviors (CWB) do exists in all levels of the workplace; even within an academic setting. In order to arrive into a CWB Taiwan (CWB-T) survey, a series of focus group interviews with both current and retired school presidents, professors, education ministry officials, and academic staff are
accomplished. Resulting list of CWB is then subjected to a pilot study with 217 participants consisting of faculty and staff. Then after, the results are
psychometrically validated with the use of Structure Equation Modelling (SEM) to form the 46 items CWB-T. It is hoped that through a validated CWB-T, a clearer understanding of the deviant behaviors within the academe can be explained. More important, results can help serve as a way of measuring the organizational health of academic institutions. As with the tenured status of most faculty and staff, proper counselling and guidance is the key in minimizing CWB.
二、 台灣中小學校園反生產力量表正式問卷分析 本研究根據預試結果,確立怠惰偷時、公器私用、師生 相處、親師相處、教學不佳、缺乏熱情、政治炒作、拒絕行 政等八個因素共 46 題目進行正式問卷之施測,參與對象主要 來自現職之中小學教師與行政人員,共計 718 人,包含網路 問卷 280 人及紙本問卷 438 人。分析結果顯示中小學教師反 生產力量表具有良好的信度與效度,並揭露現今中小學校園 內反生產行為的盛行與心態之偏差。 三、 知覺賦閒、監督制裁對校園反生產行為之影響:以報復 動機為中介
本文以台灣中小學校園為主體,探究教師所知覺到的同事賦 閒程度與學校內的監督制裁如何影響其反生產行為,並納入 報復動機為中介變數,以正反二種途徑建構動態的反生產行 為模型。透過隨機叢集取樣,總計共 1074 位現職中小學教師 參與本研究,包含導師、科任教師、兼任行政教師、行政人 員及校長等五類。分析方法包含描述統計、相關分析與結構 方程模式(驗證性因素分析與中介效果檢驗)。本研究所有 假設接獲得支持,且模型適配程度良好。數據結果顯示: (1)教師的知覺賦閒程度越高,其報復動機與反生產行為也 越高。(2)報復動機能有效預測反生產行為的增加。(3) 報復動機可做為知覺賦閒與反生產行為之間的中介變數。 (4)提高校園內的監督制裁能有效降低反生產行為的發生 率。 四、 邁向更優質的校園職場:反生產行為的角色及其成因 本文以台灣中小學校園為主體,探究教師所知覺到的環境支 持程度如何影響其反生產行為與組織公民行為,並以工作投 入為中介變數,以探索環境支持與工作投入如何影響校園職 場中的行為表現。透過隨機叢集取樣,總計共 1074 位現職中 小學教師參與本研究,包含導師、科任教師、兼任行政教 師、行政人員及校長等五類。本研究所有假設接獲得支持, 且模型適配程度良好。數據結果顯示:(1)教師知覺環境支 持的程度越高,其工作投入與組織公民行為也越高。(2)工 作投入能有效預測反生產行為的減少。(3)工作投入可做為 知覺環境支持對反生產行為及組織公民行為的中介變數。 中文關鍵詞: 反生產力行為、社會期許性、量表發展、中介效果 英 文 摘 要 : 英文關鍵詞:
科技部補助專題研究計畫成果報告
探討在臺灣學校中反生產力行為之系列研究(I)
計畫類別:■個別型計畫 □整合型計畫
計畫編號:MOST 103-2410-H-004-143-
執行期間:103 年 8 月 1 日至 104 年 7 月 31 日
執行機構及系所:國立政治大學教育學系
計畫主持人:胡悅倫
共同主持人:莊俊儒
計畫參與人員:洪兆祥、李彥玫、巫幼芸、陳誼芳
本計畫除繳交成果報告外,另含下列出國報告,共 1 份:
□執行國際合作與移地研究心得報告
■出席國際學術會議心得報告
期末報告處理方式:
1.公開方式:
□非列管計畫亦不具下列情形,立即公開查詢
□涉及專利或其他智慧財產權,□一年■二年後可公開查詢
2.「本研究」是否已有嚴重損及公共利益之發現:■否 □是
3.「本報告」是否建議提供政府單位施政參考 ■否 □是,
(請列舉提供之單位;本部不經審議,依勾選逕予轉送)
中 華 民 國 104 年 8 月 12 日
目錄
一、 目錄---I 二、 探討在臺灣學校中反生產力行為之系列研究(I): 期末報告總摘要---II~V 三、 附錄 (1) 附錄一:台灣中小學校園反生產力量表正式問卷分析---1~8 (2) 附錄二:知覺賦閒、監督制裁對校園反生產行為之影響:以報復動機為中 介---9~19 (3) 附錄三:邁向更優質的校園職場:反生產行為的角色及其成因---20~30 (4) 附錄四:校園職場工作經驗調查表---31~40 (5) 附錄五:科技部補助專題研究計畫成果報告自評表---41 (6) 附錄六:科技部補助專題研究計畫出席國際學術會議心得報告---42 (7) 附錄七:國際學術會議發表論文之全文---45~60 (8) 附錄八:Examining the Counterproductive Work Behaviors within TaiwanAcademic Setting: A Pilot Study---HEED(9:1)63~82
探討在臺灣學校中反生產力行為之系列研究(I)
期末報告總摘要
執行期限:2013 年 8 月 1 日至 2015 年 7 月 31 日 主持人: 胡悅倫 國立政治大學教育學系教授 計畫參與人員: 莊俊儒 輔仁大學教育領導與發展研究所助理教授 洪兆祥 國立政治大學教育研究所博士候選人 李彥玫 國立政治大學教育研究所碩士生 陳誼芳 國立政治大學教育研究所碩士生 巫幼芸 國立政治大學教育研究所碩士生 「探討在臺灣學校中反生產力行為之系列研究(I)」計劃包含四項子研究,其 中英文摘要如下:一、Examining the Counterproductive Work Behaviors within Taiwan Academic Setting: A Pilot Study 台灣學術界中反生產力行為之前導研究
Most mainstream occupational studies tend to focus more on the factors that instill a positive work environment. In reality, besides these positive factors, negative factors such as Counterproductive Work Behaviors (CWB) do exists in all levels of the workplace; even within an academic setting. In order to arrive into a CWB Taiwan (CWB-T) survey, a series of focus group interviews with both current and retired school presidents, professors, education ministry officials, and academic staff are accomplished. Resulting list of CWB is then subjected to a pilot study with 217 participants consisting of faculty and staff. Then after, the results are psychometrically validated with the use of Structure Equation Modelling (SEM) to form the 46 items CWB-T. It is hoped that through a validated CWB-T, a clearer understanding of the deviant behaviors within the academe can be explained. More important, results can help serve as a way of measuring the organizational health of academic institutions. As with the tenured status of most faculty and staff, proper counselling and guidance is the key in minimizing CWB.
二、台灣中小學校園反生產力量表正式問卷分析 本研究根據預試結果,確立怠惰偷時、公器私用、師生相處、親師相處、教 學不佳、缺乏熱情、政治炒作、拒絕行政等八個因素共 46 題目進行正式問卷之 施測,參與對象主要來自現職之中小學教師與行政人員,共計 718 人,包含網路 問卷 280 人及紙本問卷 438 人。分析結果顯示中小學教師反生產力量表具有良好 的信度與效度,並揭露現今中小學校園內反生產行為的盛行與心態之偏差。 三、知覺賦閒、監督制裁對校園反生產行為之影響:以報復動機為中介 本文以台灣中小學校園為主體,探究教師所知覺到的同事賦閒程度與學校內 的監督制裁如何影響其反生產行為,並納入報復動機為中介變數,以正反二種途 徑建構動態的反生產行為模型。透過隨機叢集取樣,總計共 1074 位現職中小學 教師參與本研究,包含導師、科任教師、兼任行政教師、行政人員及校長等五類。 分析方法包含描述統計、相關分析與結構方程模式(驗證性因素分析與中介效果 檢驗)。本研究所有假設接獲得支持,且模型適配程度良好。數據結果顯示:(1) 教師的知覺賦閒程度越高,其報復動機與反生產行為也越高。(2)報復動機能 有效預測反生產行為的增加。(3)報復動機可做為知覺賦閒與反生產行為之間 的中介變數。(4)提高校園內的監督制裁能有效降低反生產行為的發生率。 四、邁向更優質的校園職場:反生產行為的角色及其成因 本文以台灣中小學校園為主體,探究教師所知覺到的環境支持程度如何影響 其反生產行為與組織公民行為,並以工作投入為中介變數,以探索環境支持與工 作投入如何影響校園職場中的行為表現。透過隨機叢集取樣,總計共 1074 位現 職中小學教師參與本研究,包含導師、科任教師、兼任行政教師、行政人員及校 長等五類。本研究所有假設接獲得支持,且模型適配程度良好。數據結果顯示: (1)教師知覺環境支持的程度越高,其工作投入與組織公民行為也越高。(2) 工作投入能有效預測反生產行為的減少。(3)工作投入可做為知覺環境支持對 反生產行為及組織公民行為的中介變數。 III
Abstract
Development and Psychometric Study of the Taiwan Counterproductive Work Behaviors Scale
Based on the result of pretest research (Hu, Hung, & Ching, 2015), an eight factors with 46 items structure is confirmed. The 46 items CWB-T factors are composed of the following: time theft, inappropriate use of resources, inappropriate student-teacher relationship, inappropriate parent-teacher relationship, lack of professionalism, apathy, political tactics, and reluctant to accept administrative duties. Both web and paper surveys with 718 participants consisting of school presidents, faculty and staff are accomplished. The psychometric properties, tested with use of Structure Equation Modelling (SEM), of the CWB-T are acceptable and can be used in assessing CWB in Taiwan campus. The prevalence of deviant attitude and behavior in Taiwan campus is revealed, hoped the policy makers and school presidents notice and be devoted to minimize CWB.
Exploring the Relationships among the Perceived Loafing, Monitoring and Sanctioning, and Counterproductive Work Behaviors: The Mediating Role of a Revenge Motive
This paper build up a dynamic model with positive and negative paths to figure out how perceived loafing (PL), monitoring and sanctioning (MAS) influence the
prevalence of counterproductive work behaviors (CWB), and take revenge motive (RM) as a mediator. Data collected from Taiwan elementary, junior high, and high school by random cluster sampling, 1074 participants consisting of faculty and staff. Analysis is conducted by using descriptive statistic, Pearson correlation, and structure equation modelling (confirmatory factor analysis and mediation test). All research hypotheses are supported and shown good model fit indices. Results show that 1) more loafing perceived, higher RM and CWB. 2) RM could predict the increase of CWB significantly. 3) RM mediates the RM-CWB relationship. 4) More MAS, lower
prevalence of CWB on campus.
Toward a Better School Workplace: the Role of Counterproductive Work Behaviors and its Determinants
This study focus on the effect of perceived support (PS) on counterproductive work behaviors (CWB) and organization citizenship behaviors (OCB), while job engagement (JE) is regarded as a mediator. Data collected from Taiwan elementary,
junior high, and high school by random cluster sampling. A total of 1074 teachers consisting of faculty and staff participated. Analysis is conducted by using descriptive statistic, Pearson correlation, and structure equation modelling (confirmatory factor analysis and mediation test). All research hypotheses are supported and shown good model fit indices. Results show that 1) More PS, more JE and OCB. 2) JE could predict the decrease of CWB. 3) JE mediates PS-CWB and PS-OCB relationships.
附錄一、台灣中小學校園反生產力量表正式問卷分析
本研究根據預試之結果,確立怠惰偷時、公器私用、師生相處、親師相處、 教學不佳、缺乏熱情、政治炒作、拒絕行政等八個因素共 46 題目進行正式問卷 之施測。分析結果顯示中小學教師反生產力量表具有良好的信度與效度,++++ 並揭露現今中小學校園內反生產行為的盛行與心態之偏差。壹、
參與對象
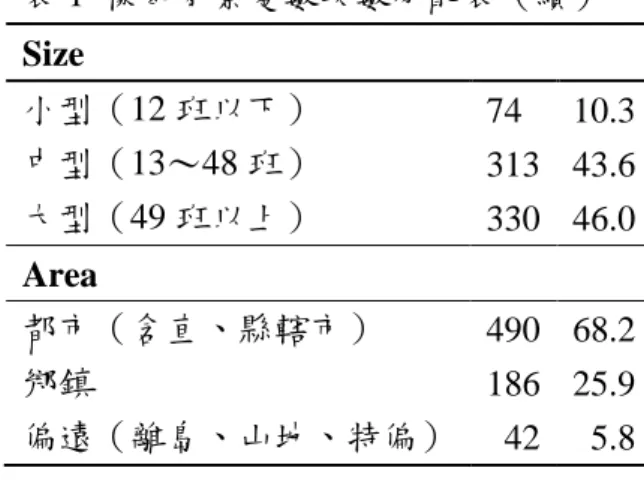
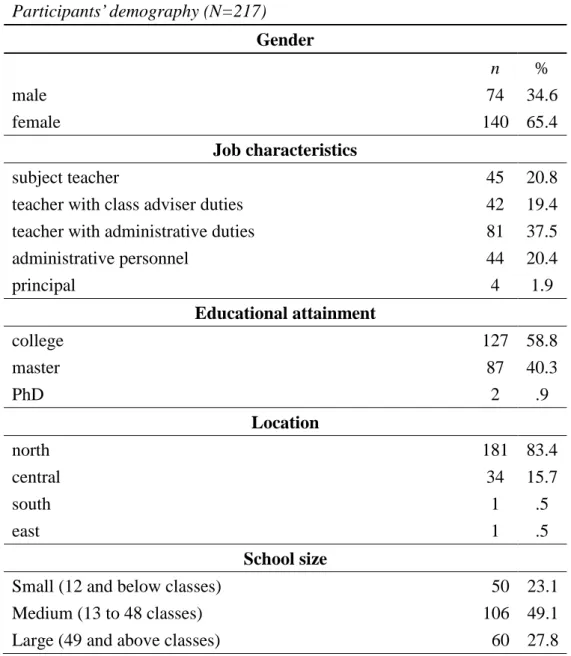
參與對象主要來自現職之中小學教師與行政人員,共計 718 人,包含網路問 卷 280 人及紙本問卷 438 人。為求更多元、仔細地檢視校園各個角落的反生產力 行為,本研究抽樣範圍涉及各種人員,包含科任教師、教師兼導師、教師兼行政 職、行政人員及校長。學歷主要集中在大學及碩士,所在區域主要以台灣北部及 中部為主。學校規模以 13~48 班的中型學校為主,並包含了都市、鄉鎮及偏遠 地區的學校。在兼顧各種條件的情況下,本次抽樣可確保樣本具有足夠的代表性 與差異性。詳細數量與比例請見表 1,若人數總和不等於 718 乃因遺漏值所致。 表 1 樣本背景變數次數分配表 Gender 次數 百分比 男性 372 52 女性 343 48 Job 科任教師 328 45.9 教師兼導師 379 53.0 教師兼行政職 8 1.1 行政人員 328 45.9 校長 379 53.0 Education 大學 127 58.8 碩士 87 40.3 博士 2 .9 Location 北部 310 43.2 中部 343 47.8 南部 60 8.4 東部 5 .7 1表 1 樣本背景變數次數分配表(續) Size 小型(12 班以下) 74 10.3 中型(13~48 班) 313 43.6 大型(49 班以上) 330 46.0 Area 都市(含直、縣轄市) 490 68.2 鄉鎮 186 25.9 偏遠(離島、山地、特偏) 42 5.8
貳、
研究工具
本研究所擬定之 CWB 量表具有八個因素結構,包含怠惰偷時、公器私用、 師生相處、親師相處、教學不佳、缺乏熱情、政治炒作、拒絕行政等。詳細定義 請見表 2。 表 2 CWB 因素定義摘要表 Factor Definition 1. 怠惰偷時 透過各種不當的理由減少自己的工作時數。 2. 公器私用 浪費、佔用、偷竊或破壞不屬於自己的公共財物。 3. 師生相處 教師與學生之間相處不當,不符合身分與專業倫理。 4. 親師相處 教師與家長之間相處不當,不符合身分與專業倫理。 5. 教學不佳 教師的專業知能不足,導致教學效能不佳。 6. 缺乏熱情 教師缺乏教學熱情,不願持續精進自己的專業。 7. 政治炒作 結黨營私,透過小團體來進行人際控制與攻擊。 8. 拒絕行政 不願意接受教學以外的行政業務,或隨意敷衍行政工作。 CWB 是一種負面的破壞性行為,對組織及個人都有所傷害,故在測量上必 定會遭遇到社會期許性(social desirability)的問題。所謂社會期許性,係指做答 者希望表現出符合社會或重要他人所期待的樣子,以此收集到的資料無法反應真 實的情況,乃是測驗學上的重要議題之一。 為了解決社會期許所帶來的偏差,本研究共採用二種作法: 一、 對測量尺度(scaling)進行轉換。參與者作答時,詢問此項 CWB 在做答 者學校中的發生頻率,計分為 0~3 分,分別由從不如此 never~總是如此 always。我們假設做答者也是從事反生產力行為的一份子,所以在回答時 社會期許性將會導致做答者偏好回答「1 偶爾如此」,我們認為這是社會 2期許性造成的低估現象。由於在規範上,任何的 CWB 都是不被允許的, 因此我們將頻率尺度由原本的 0~3 分,重新編碼(recode)為 0/1,只關 心是/否有發生,這樣一來就能避免社會期許所造成的低估現象,能做到 較精準的估計。而信度分析顯示,轉換前後的內部一致性係數並無太大的 差異,信度係數對比如下表。 表 3 CWB 量表轉換尺度前後信度對照表 Factor Original Transformed
1.怠惰偷時 0.81 0.81 2.公器私用 0.71 0.72 3.師生相處 0.84 0.86 4.親師相處 0.82 0.82 5.教學不佳 0.81 0.84 6.缺乏熱情 0.83 0.82 7.政治炒作 0.92 0.9 8.拒絕行政 0.78 0.79 二、 本研究在正式問卷實施時,連同社會期許量表一併納入,透過檢驗社會期 許量表與 CWB 量表的相關程度來判定題目是否容易受到社會期許性的影 響。使用的社會期許量表乃 Fischer 與 Fick(1993)針對 Marlowe-Crowne Social Desirability Scale(簡稱 SDS)所編修而來的短版問卷,共計 10 題。 其信度效度經過多位學者驗證,具有可靠的計量特性(Loo & Thorpe, 2000; Barger, 2002; Andrews & Meyer, 2003; Leite & Beretvas, 2005; Thompson
& Phua, 2005)。由於 SDS 乃單一向度的結構,故本研究以其平均數對 CWB
量表的八個因素進行相關分析,如下表。 表 4 社會期許量表與反生產量表之相關係數摘要表 CWB-Taiwan Social Desirability Scale
1.怠惰偷時 .030 2.公器私用 .066 3.師生相處 .087* 4.親師相處 .031 5.教學不佳 .076* 6.缺乏熱情 .057 7.政治炒作 .045 8.拒絕行政 -.019 Note: * p<.05 3
分析結果顯示,CWB 的八個因素與社會期許量表的相關都小於.1,且絕大 多數皆未達顯著水準(p>.05)。是故,從題目本身來看,本研究所提出的 CWB-Taiwan 應不致於受到嚴重的社會期許影響。
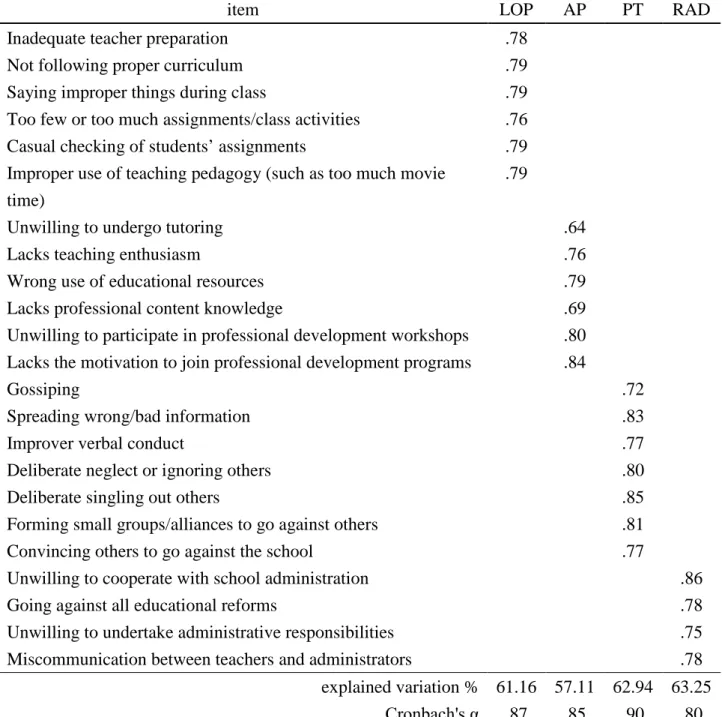
參、
分析結果
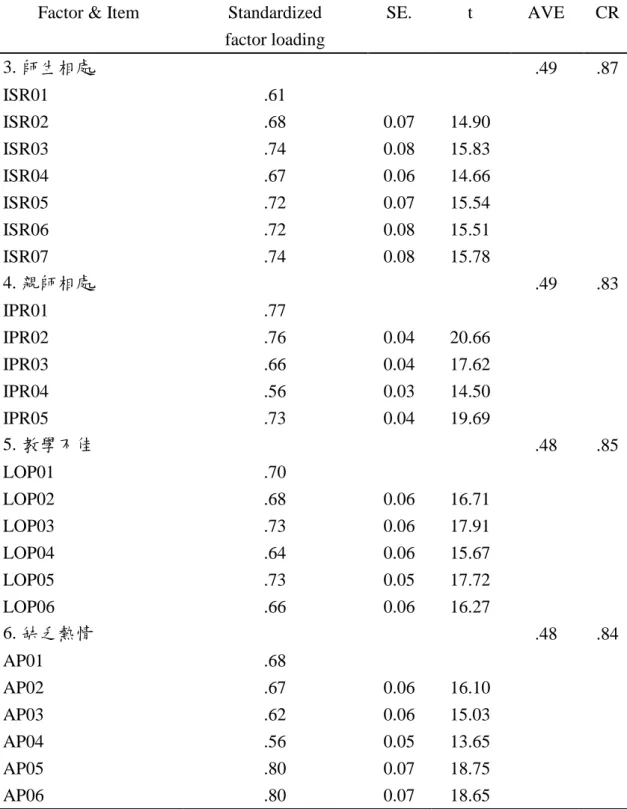
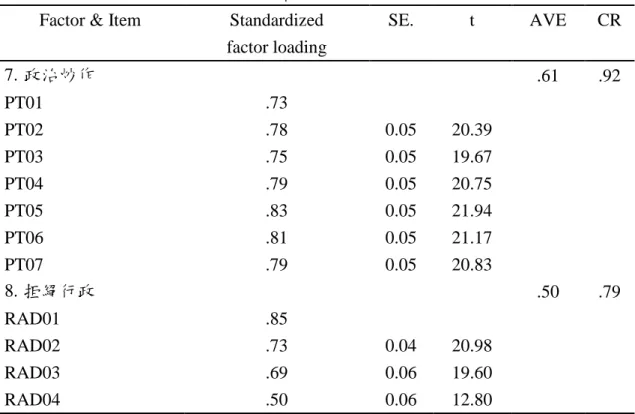
正式問卷分析採用發生頻率做為工具尺度,由於預試問卷已初步確認其理論 結構,故正式分析採驗證性因素分析進行之。分析結果顯示,46 道題目皆符合 預試分析的理論模式,依然可分為八個潛在因素,且適配良好(χ2 = 2870.97***, df= 961, GFI = .93, CFI = .91, TLI=.92, NFI= .93, RMSEA = .053, SRMR = .046)。 每個因素底下的題目,其因素負荷量(factor loading)皆達到.5 以上,代表 聚斂效度的平均變異抽取量(AVE)介於 46%~63%。在組合信度(CR)方面, 所有因素皆超過.7,符合 Fornell 與 Larcker(1981)所建議之標準,計量特性表 現良好。整體而言,正式問卷結果獲得良好的建構效度與信度證據。詳細數據請 見表 5。 表 5 反生產力量表驗證性因素分析摘要表 Factor & Item Standardized factor loading SE. t AVE CR 1.怠惰偷時 .46 .86 TT01 .65 TT02 .66 0.08 15.09 TT03 .66 0.07 15.18 TT04 .69 0.07 15.61 TT05 .70 0.07 15.79 TT06 .74 0.08 16.49 TT07 .73 0.08 16.38 2.公器私用 IUR01 .84 .48 .78 IUR02 .82 0.04 24.58 IUR03 .52 0.02 13.96 IUR04 .51 0.02 13.68
Note: All standardized factor loading are significant (p < .001).
表 5 反生產力量表驗證性因素分析摘要表(續) Factor & Item Standardized
factor loading SE. t AVE CR 3.師生相處 .49 .87 ISR01 .61 ISR02 .68 0.07 14.90 ISR03 .74 0.08 15.83 ISR04 .67 0.06 14.66 ISR05 .72 0.07 15.54 ISR06 .72 0.08 15.51 ISR07 .74 0.08 15.78 4.親師相處 .49 .83 IPR01 .77 IPR02 .76 0.04 20.66 IPR03 .66 0.04 17.62 IPR04 .56 0.03 14.50 IPR05 .73 0.04 19.69 5.教學不佳 .48 .85 LOP01 .70 LOP02 .68 0.06 16.71 LOP03 .73 0.06 17.91 LOP04 .64 0.06 15.67 LOP05 .73 0.05 17.72 LOP06 .66 0.06 16.27 6.缺乏熱情 .48 .84 AP01 .68 AP02 .67 0.06 16.10 AP03 .62 0.06 15.03 AP04 .56 0.05 13.65 AP05 .80 0.07 18.75 AP06 .80 0.07 18.65
Note: All standardized factor loading are significant (p < .001).
表 5 反生產力量表驗證性因素分析摘要表(續) Factor & Item Standardized
factor loading SE. t AVE CR 7.政治炒作 .61 .92 PT01 .73 PT02 .78 0.05 20.39 PT03 .75 0.05 19.67 PT04 .79 0.05 20.75 PT05 .83 0.05 21.94 PT06 .81 0.05 21.17 PT07 .79 0.05 20.83 8.拒絕行政 .50 .79 RAD01 .85 RAD02 .73 0.04 20.98 RAD03 .69 0.06 19.60 RAD04 .50 0.06 12.80
Note: All standardized factor loading are significant (p < .001).
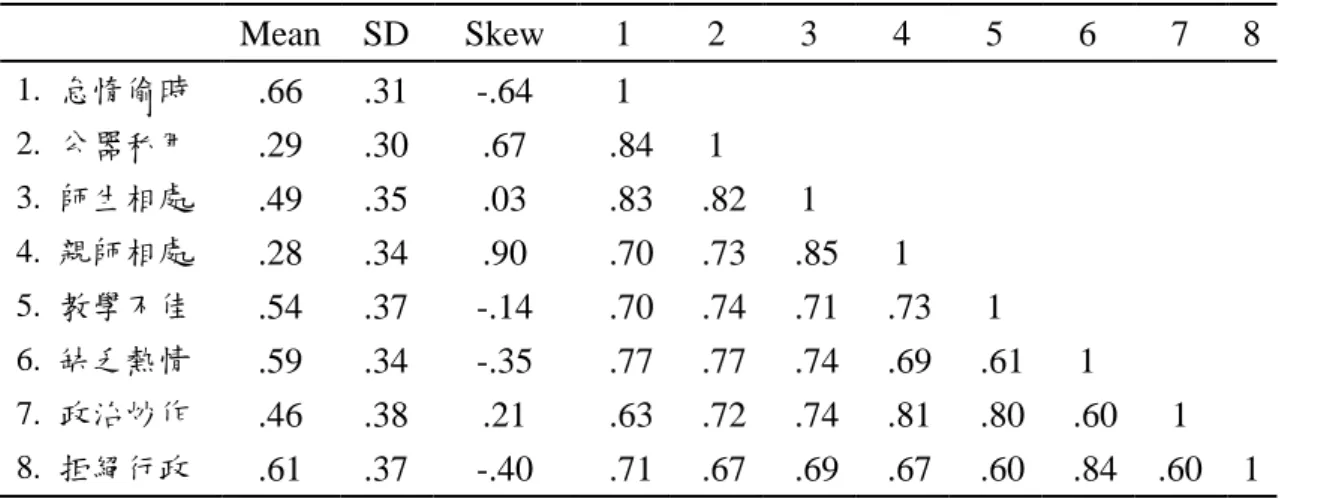
CWB 的測量模式除了提供整體與個別因素內的信度與效度資訊之外,數據 更顯示八個潛在變數之間的潛在相關皆超過.6 以上並達到顯著水準(p < .001)。 這樣的結果表示,在校園內的各種反生產力行為並不是單獨存在,而是較有可能 一同出現。平均數、標準差及偏態則是以個別合併的外顯變數形式呈現。其平均 數代表該行為在校園內的盛行率,可看出除了公器私用與親師相處二項盛行率低 於 30%以外,其餘反生產力行為皆接近或超過 50%,表示台灣中小學校園內的 反生產力行為相當盛行。標準差皆介於.30~.38,此數值可看做盛行率的變化程 度(%),數據顯示反生產行為的盛行率在不同學校間的盛行率變異頗大,表示 部分學校表現良好,而部分學校則是情況嚴重。偏態係數之絕對值皆小於 1,表 示反生產力行為的盛行率大致符合常態分配。詳細數據請見下表。 6
表 4 反生產力行為因素描述統計與潛在相關係數矩陣 Mean SD Skew 1 2 3 4 5 6 7 8 1. 怠惰偷時 .66 .31 -.64 1 2. 公器私用 .29 .30 .67 .84 1 3. 師生相處 .49 .35 .03 .83 .82 1 4. 親師相處 .28 .34 .90 .70 .73 .85 1 5. 教學不佳 .54 .37 -.14 .70 .74 .71 .73 1 6. 缺乏熱情 .59 .34 -.35 .77 .77 .74 .69 .61 1 7. 政治炒作 .46 .38 .21 .63 .72 .74 .81 .80 .60 1 8. 拒絕行政 .61 .37 -.40 .71 .67 .69 .67 .60 .84 .60 1 Note: All values of correlation are significant (p < .001)
肆、
結論
一、 透過尺度的轉換,以及納入社會期許性量表共同估計,可透過數據提供 證據支持 CWB 量表不致於受到社會期許性的影響。 二、 驗證性因素分析結果顯示,本研究針對台灣中小學校園所開發的 CWB-Taiwan 量表具有良好的組合信度、聚斂效度與因素效度。在良好的計 量特性基礎之上,未來可進一步進行相關變數的理論關係探究。 三、 CWB 的八個因素之間具有中高程度的相關,表示這些不良的行為並非 單獨發生,很有可能會共同出現。 四、 八個反生產力行為在校園中的盛行率,平均來說皆超過 30%~50%, 且變異程度頗為一切約為 30%,這表示雖然部分學校可能狀況輕微,但也有 部分學校存在著非常嚴重的破壞性行為,可能嚴重干擾校務推動以及學生學 習,學校管理人員應注重此現象。 7參考文獻
Andrews, P., & Meyer, R. G. (2003). Marlowe–Crowne social desirability scale and short form C: forensic norms. Journal of clinical psychology, 59(4), 483-492.
Barger, S. D. (2002). The Marlowe-Crowne affair: Short forms, psychometric structure, and social desirability. Journal of personality assessment, 79(2), 286-305.
Fischer, D. G., & Fick, C. (1993). Measuring social desirability: Short forms of the Marlowe-Crowne social desirability scale. Educational and Psychological Measurement, 53(2), 417-424.
Fornell, C., & Larcker, D. F. (1981). Evaluating structural equation models with unobservable variables and measurement error. Journal of marketing research, 39-50.
Hu, Y.-L., Hung, C. H., & Ching, G. S. (2015). Examining the Counterproductive Work Behaviors within Taiwan Academic Setting: A Pilot Study. Higher education evaluation and development,9(1), 63-82.
Leite, W. L., & Beretvas, S. N. (2005). Validation of scores on the
Marlowe-Crowne social desirability scale and the balanced inventory of desirable responding. Educational and Psychological Measurement, 65(1), 140-154.
Loo, R., & Thorpe, K. (2000). Confirmatory factor analyses of the full and short versions of the Marlowe-Crowne Social Desirability Scale. The Journal of Social Psychology, 140(5), 628-635.
Thompson, E. R., & Phua, F. T. (2005). Reliability among senior managers of the Marlowe–Crowne short-form Social Desirability Scale. Journal of Business and
Psychology, 19(4), 541-554.
附錄二、知覺賦閒、監督制裁與校園反生產行為之關係:以
報復動機為中介
Exploring the Relationships among Perceived Loafing, Monitoring and
Sanctioning, and Counterproductive Work Behaviors: The Mediating
Role of a Revenge Motive
摘要 當代組織行為研究中最重要的取向之一,乃探尋促進組織績效的正面因子及 理解作用機制。然而在真實世界中,也同時存在著許多降低組織績效的負面因子, 其中最具破壞性的行為被稱為反生產行為。本文以台灣中小學校園為主體,探究 教師所知覺到的同事賦閒程度與學校內的監督制裁如何影響其反生產行為,並納 入報復動機為中介變數,以正反二種途徑建構動態的反生產行為模型。 透過隨機叢集取樣,總計共 1074 位現職中小學教師參與本研究,包含導師、 科任教師、兼任行政教師、行政人員及校長等五類。分析方法包含描述統計、相 關分析與結構方程模式(驗證性因素分析與中介效果檢驗)。 本研究所有假設接獲得支持,且模型適配程度良好。數據結果顯示:(1) 教師的知覺賦閒程度越高,其報復動機與反生產行為也越高。(2)報復動機能 有效預測反生產行為的增加。(3)報復動機可做為知覺賦閒與反生產行為之間 的中介變數。(4)提高校園內的監督制裁能有效降低反生產行為的發生率。 根據研究結果,本研究提出相關建議,以供學校行政單位、政策制定者及未 來研究者參考。 關鍵字:反生產行為、知覺賦閒、報復動機、監督制裁、中介效果 9
Method
Design
This framework primarily builds on the perceived loafing (PL), monitoring and sanctioning (MAS) on campus, revenge motive (RM) as an aggressive intention, and the concept of CWB-T. It was hypothesized that the new model how CWB created on Taiwan campus. We had taken perceived loafing (PL), monitoring and sanctioning (MAS) as latent IV, revenge motive (RM) as latent mediator, CWB as latent DV, and five hypotheses were stated as following.
Hypothesis 1: PL has significant positive effect on RM. Hypothesis 2: RM has significant positive effect on CWB-T.
Hypothesis 3: RM mediates the relationship between PL and CWB-T. Hypothesis 4: MAS has significant negative effect on CWB-T.
Figure 1
Hypothesized theory model
Participants
This study involved 1074 Taiwan teachers enrolled in different level schools from primary school (60.0%), junior high school (30.1%), high school (6.2%), and vocational school (3.7%). The sample included 52% male and 48% female. Of the participants, 34.4% were tutor, 30.3% were subject teacher, 26.0% were with administrative position, 5.6% were staff, and 3.7% were school president. Most part of teacher has bachelor degree (45.7%) and master degree (53.0%).
Measures
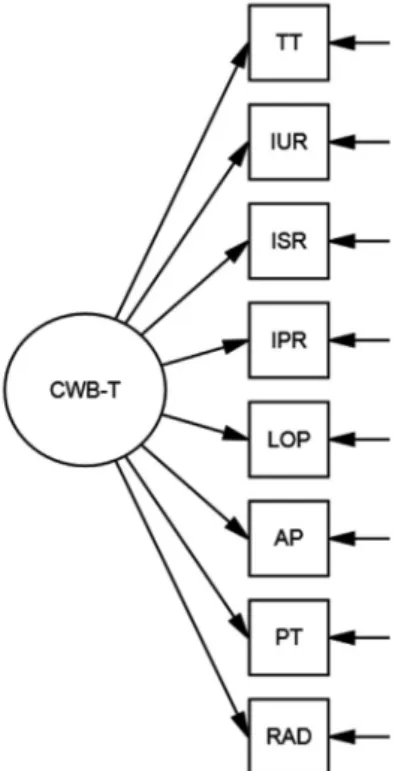
Counterproductive Work Behaviors Taiwan (CWB-T)
CWB-T had been used to describe prevalence of counterproductive work behaviors on campus. 46 items, developed by Hu et al. (2015), were used to measure the 8 latent variables under CWB-T. These 8 factors are as follows: time theft (TT) -- reducing work hours using any form of improper or inappropriate reasons, inappropriate use of resources (IUR) -- deliberate use, waste, theft, or destruction of schools’ properties, inappropriate student-teacher relationship (ISR) -- any inappropriate, unethical, or unprofessional interactions between teachers and students, inappropriate parent-teacher relationship (IPR) -- any inappropriate, unethical, or unprofessional interactions between teachers and parents, lack of professionalism (LOP) -- lack of pedagogical and professional content knowledge resulting in poor teaching performance, apathy (AP) -- lack of enthusiasm and/or unwilling to improve oneself, political tactics (PT) -- forming alliances to gain control and personal attacks, and reluctant to accept administrative duties (RAD) -- unwilling to accept any duties besides teaching. Items were dichotomous scale ranging (Happened / None). In order to lower the complexity of computation, eight factors were put into model as manifest variables.
Perceived Loafing (PL)
Perceived loafing of coworkers was measured using Mulvey and Klein’s (1998) four-item scale (example items are: my co-workers were ‘‘free-loaders;’’ my co-workers were contributing less than I anticipated). Responses were made on a 4-point scale (1 = strongly disagree to 4 = strongly agree). The Cronbach’s alpha for this scale was .74.
Revenge Motive (RM)
Two sub-scales were included in Revenge Motive, named toward the
organization (RMTO) and toward coworkers (RMTC). Two items from Jones’ (2009) scale to measure the revenge motive toward the organization (i.e., if I were mistreated by the company, the satisfaction of ‘‘getting even’’ would outweigh the risks of getting caught; if I were mistreated by the company, it would feel good to ‘‘get back’’ in some way). Responses were made on a 4-point scale (1 = strongly disagree to 4 = strongly agree). Cronbach’s alpha for this scale was .87. Likewise, Jones’ (2004) two items were modified to measure the revenge motive toward coworkers (i.e., if I were mistreated by my coworkers, the satisfaction of ‘‘getting even’’ would outweigh the risks of getting caught; if I were mistreated by my coworkers, it would feel good to ‘‘get back’’ in some way). Responses were made on a 4-point scale (1 = strongly disagree to 4 = strongly agree). Cronbach’s alpha for this scale was .82. According to Hung, Chi, and Lu (2009) and Jones (2009), RMTO and RMTC should be regarded as two latent variables separately in order to predict CWB-Organization and CWB-Individual. However, in our model, CWB-Taiwan indicated it was a high order factor; both organization and individual approach were included. Therefore, we combined RMTO and RMTC into a 1-factor construct called RM to predict CWB-T.
Monitoring and Sanctioning (MAS)
Monitoring and Sanctioning were measured by a scale with eight items developed by Fine, Horowitz, Weigler, and Basis (2010). Examples of items include: “This workplace tends to deal strictly with employees who deviate from policies and instructions” and“This place of work actively monitors and inspects its employees” . Responses were made on a 4-point scale (1 = strongly disagree to 4 = strongly agree). The Cronbach’s alpha for this scale was .80. In order to lower the complexity of computation, we used the mean of eight items to put into model as single indicator.
Data analysis
The sample had been separated into two parts by random (33% sample, n = 358; 67% sample, n = 716). The 33% sample used in measurement model (Confirmatory Factor Analysis, CFA), while the other 67% sample used in structure model (Structure model and mediation test).
Descriptive statistics and correlation estimated using SPSS 21 program, composite reliability (CR) and average variance extracted (AVE) were used to prove the reliability and validity of measurement model. Structure model was used to explain the relationship and effect among latent variables. Structure equation modeling (SEM) was estimated using the maximum-likelihood method in the AMOS 20 program (Arbuckle, 2011).
Results
Preliminary Analyses
Means, SDs, and zero-order correlations for the 14 measured variables are shown in Table 2. Because the number of item were not equal in every variable, we used mean to represent. All the means of observed variables ranging .29~2.25, while SD ranging .30~.61. Multivariate normality test was used to examine whether the data met the normality assumptions underlying the maximum-likelihood procedure used to test the models in the present study. The results of the multivariate normality test indicated that the data were multivariate normal, multivariate kurtosis was 12.30. Therefore, maximum-likelihood method was appropriate.
Measurement Model
Before a structural model is tested, Anderson and Gerbing (1988) suggested conducting a confirmatory factor analysis to examine whether the measurement model provides an acceptable fit to the data. Once an acceptable measurement model is developed, the structural model can be tested. As suggested by Tucker and Lewis(1973), Byrne(1994), Hu and Bentler (1999), six fit indices were used to assess goodness of fit for the models: the goodness of fit index(GFI; values >0.90 indicate good fit), the comparative fit index (CFI; values >0.90 indicate good fit), the Tucker-Lewis Index (TLI; values >0.90 indicate good fit), the non-normed fit index(NFI; values >0.90 indicate good fit), and the root-mean-square error of approximation (RMSEA; values <0.08 indicate good fit), standardized root mean square residual (SRMR; values <0.08 indicate good fit).
A test of the measurement model resulted in a relatively good fit to the data(χ2 = 184.90***, df = 72, GFI = .93, CFI = .96, TLI=.95, NFI= .94, RMSEA = .066, SRMR = .035). All of the standardized loadings of the measured variables on the latent variables were statistically significant ( p < .001, see Table 4). CR of latent variables ranging .73~.93, AVE ranging .48~.79, both CR and AVE fit to the standard suggest by Fornell & Larcker(1981)and Hair et al (2010). Therefore, all of the latent variables appear to have been adequately operationalized by their respective indicators. In addition, most of correlations among the independent latent variables, the mediator latent variable, and dependent latent variables were statistically significant ( p < .001, see Table 5).
Table 2
Means, standard deviations, and zero-order correlations matrix(all sample, n = 1074)
Mean SD 1 2 3 4 5 6 7 8 9 10 11 12 13 14 1. TT .65 .30 1 2. IUR .29 .30 .62*** 1 3. ISR .49 .35 .59*** .65*** 1 4. IPR .28 .34 .52*** .64*** .69*** 1 5. LOP .54 .37 .59*** .62*** .73*** .67*** 1 6. AP .59 .34 .55*** .57*** .66*** .62*** .74*** 1 7. PT .46 .38 .52*** .54*** .65*** .66*** .64*** .65*** 1 8. RAD .61 .37 .49*** .49*** .56*** .58*** .62*** .69*** .70*** 1 9. RMTO 2.23 .51 .29*** .26*** .29*** .33*** .25*** .29*** .34*** .27*** 1 10. RMTC 2.25 .54 .29*** .25*** .29*** .35*** .29*** .33*** .35*** .31*** .79*** 1 11. PL01 1.93 .47 .17*** .24*** .18*** .26*** .17*** .21*** .22*** .24*** .25*** .26*** 1 12. PL02 1.79 .58 .17*** .17*** .20*** .21*** .18*** .18*** .22*** .20*** .28*** .31*** .50*** 1 13. PL03 2.09 .61 .18*** .20*** .17*** .20*** .19*** .22*** .23*** .22*** .30*** .32*** .39*** .51*** 1 14. MAS 2.24 .50 -.06 -.07 -.05 -.01 .00 -.03 .02 .02 .24*** .27*** .17*** .25*** .20*** 1 *** p < .001 14
Table 3
Model Fit Indices
Indices Measurement model Structural model Criteria N 358 716 χ2 184.90*** 356.74 df 72 73 GFI .93 .93 >.90 CFI .96 .95 >.90 TLI .95 .94 >.90 NFI .94 .93 >.90 RMSEA .066 .068 <.08 SRMR .035 .040 <.05 *** p < .001 Table 4
Factor Loadings for the Measurement Model(33% sample, n = 358)
Factor & Item Standardized
factor loading SE. t AVE CR
CWB- Taiwan .63 .93 TT .68 IUR .73 0.08 12.72 ISR .83 0.09 14.30 IPR .82 0.09 14.05 LOP .85 0.10 14.53 AP .84 0.09 14.40 PT .80 0.10 13.87 RAD .77 0.10 13.38 Revenge Motive .79 .88 RMTO .85 RMTC .93 0.08 14.06 Perceived Loafing .48 .73 PL01 .63 PL02 .78 0.16 9.43 PL03 .66 0.15 9.08
Monitoring and Sanctioning
MAS 1.00
Note: All standardized factor loading are significant (p < .001). 15
Table 5
Correlations matrix for the Measurement Model(33% sample, n = 380)
Latent Variables 1 2 3 4
1. CWB-T 1
2. Revenge Motive .42*** 1
3. Perceived Loafing .35*** .46*** 1
4. Monitoring and Sanctioning -.02 .29*** .31*** 1 *** p < .001
Structural Model for Testing Mediated Effects
Perceived Loafing, Monitoring and Sanctioning were taken as latent IV, Revenge Motive as latent mediator, and CWB-T as latent DV. The results shows a good fit of the model to the data(χ2 =356.74***, df = 73, GFI = .93, CFI = .95, TLI=.94, NFI= .93, RMSEA = .068, SRMR = .040). Path effect is frequently referred to as direct effect. All the effect size of structural paths were medium and significant (p < .001, see Table 6).
MacKinnon, Lockwood, Hoffmann, West, & Sheets(2002)assessed many approaches to examine mediation considering Type I error and statistical power. Found the most often used strategy by Baron & Kenny(1986)has the least power. Then, many studies using this approach have relied on the Sobel test (1982) to examine the significance of mediation effect. However, there is evidence that the distribution of mediation effect is not normal (Bollen & Stine, 1990; MacKinnon & Dwyer, 1993; Stone & Sobel, 1990), and the utilization of a significance test, such as the Sobel test, which assumes a normal distribution when examining the mediation effect, is not appropriate. Most recently, Shrout and Bolger(2002)suggest bootstrap method can be a better way to examine mediation. Bootstrap method acquires 95% confidence intervals (CI) for the indirect effect by resampling procedure. Based on central limit theorem, bootstrap method is robust even the distribution of mediation effect is not normal.
As Shrout and Bolger’s suggestion, if the 95% CI for the estimates of the indirect effects based on these 5000 indirect effect estimates does not include zero, then it can be concluded that the indirect effect is statistically significant at the .05 level.
Therefore, after the structural models were examined through the AMOS 20 program, the bootstrap procedure was used to test whether or not the indirect effects were statistically significant.
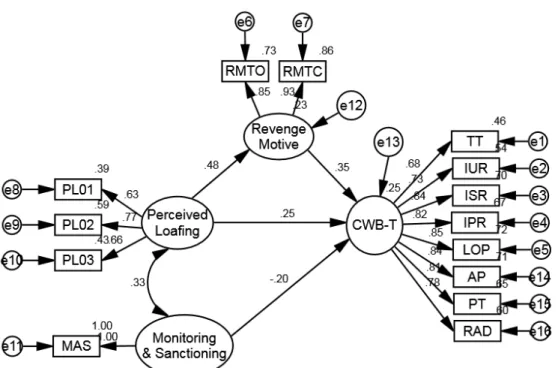
Figure 2 Structure equation model with maximum likelihood estimates (standardized)
Mediation effect is frequently referred to as indirect effect. The indirect effect from Perceived Loafing to CWB-T is -.17. The 95% CI for the estimates of the indirect effects ranging .11~.24 does not include zero, and then it can be concluded that the mediation effect is statistically significant at the .05 level. On Taiwan campus, Revenge Motive plays a role as mediator between Perceived Loafing and CWB-T. Total effect is the summation of direct effect and indirect effect, the total effect from Perceived Loafing to CWB-T is .42, the 95% CI for total effects ranging .29~.52 does not include zero, the total effect is statistically significant at the .05 level. On the other hand, the total effect from Monitoring and Sanctioning to CWB-T is -.20. The 95% CI for total effects ranging -.30~-.10 does not include zero, the total effect is statistically significant at the .05 level. The data shows a good explained variance on CWB-T in both positive and negative path.
Table 6
Bootstrap Analysis of Structural Model(67% sample, n = 763)
Path Standardized
Coefficient
95% CI
H1 Perceived LoafingRevenge Motive .48***
H2 Revenge Motive CWB-T .35***
H3 Perceived LoafingRevenge Motive CWB-T .17 .11~.24 H4 Monitoring and Sanctioning CWB-T -.20***
Total effect on CWB-T by Perceived Loafing .42 .29~.52 Total effect on CWB-T by Monitoring and Sanctioning -.20 -.30~-.10 *** p < .001
Conclusion
The results of structure model shown the theory model can explain CWB-T well on Taiwan campus. As above, hypotheses 1~4 are supported. The test of mediation confirmed the mediator role of revenge motive between perceived loafing and CWB-T. In summary, one path from perceived loafing and revenge motive will rise up CWB-T, the other path from monitoring and sanctioning can decrease CWB-T on campus. In addition, according to Baron et al. (1986), the paths of direct effect is still
significant, the mediation path in our model is partial mediation, shown there may be other effective mediator can be taken into consideration in the future.
References
Anderson, J. C., & Gerbing, D. W. (1988). Structural equation modeling in practice: A review and recommended two-step approach. Psychological bulletin, 103(3), 411. Arbuckle, J. L. (2011). IBM SPSS Amos 20 user’s guide. Armonk, NY: IBM.
Baron, R. M., & Kenny, D. A. (1986). The moderator–mediator variable distinction in social psychological research: Conceptual, strategic, and statistical
considerations. Journal of personality and social psychology, 51(6), 1173. Byrne, B. M. (2009). Structural equation modeling with AMOS: Basic concepts,
applications, and programming. CRC Press.
Efron, B., & Tibshirani, R. (1993). An Introduction to the Bootstrap. New York:
Chap-man & Hall.
Fine, S., Horowitz, I., Weigler, H., & Basis, L. (2010). Is good character good enough? The effects of situational variables on the relationship between integrity and
counterproductive work behaviors. Human Resource Management Review, 20(1), 73-84.
Finney, S. J., & DiStefano, C. (2006). Non-normal and categorical data in structural equation modeling. Structural equation modeling: A second course, 269-314. Fornell, C., & Larcker, D. F. (1981). Evaluating structural equation models with unobservable variables and measurement error. Journal of marketing research, 39-50.
Hu, L. T., & Bentler, P. M. (1999). Cutoff criteria for fit indexes in covariance structure analysis: Conventional criteria versus new alternatives. Structural
Equation Modeling: A Multidisciplinary Journal, 6(1), 1-55.
Hung, T. K., Chi, N. W., & Lu, W. L. (2009). Exploring the relationships between perceived coworker loafing and counterproductive work behaviors: The mediating role of a revenge motive. Journal of Business and Psychology, 24(3), 257-270. Jones, D. A. (2009). Getting even with one's supervisor and one's organization:
relationships among types of injustice, desires for revenge, and counterproductive work behaviors. Journal of Organizational Behavior, 30(4), 525.
Kline, R. B. (2005). Principles and practice of structural equation modeling (2nd ed.). New York, NY: Guilford.
MacKinnon, D. P., Lockwood, C. M., Hoffman, J. M., West, S. G., & Sheets, V. (2002). A comparison of methods to test mediation and other intervening variable effects. Psychological methods, 7(1), 83.
Tucker, L. R., & Lewis, C. (1973). A reliability coefficient for maximum likelihood factor analysis. Psychometrika, 38(1), 1-10.
附錄三、邁向更優質的校園職場:反生產行為的角色及其成因
Toward a Better School Workplace: the Role of
Counterproductive Work Behaviors and Determinants
摘要 校園做為教師的職場環境,其好壞直接影響教學品質與學校運作。過往研究 聚焦於探尋促進職場環境的正面因子及理解作用機制。然而在真實世界中,也同 時存在著許多降低組織績效的負面因子,其中最具破壞性的行為被稱為反生產行 為。本文以台灣中小學校園為主體,探究教師所知覺到的環境支持程度如何影響 其反生產行為與組織公民行為,並以工作投入為中介變數,以探索環境支持與工 作投入如何影響校園職場中的行為表現。 透過隨機叢集取樣,總計共 1074 位現職中小學教師參與本研究,包含導師、 科任教師、兼任行政教師、行政人員及校長等五類。分析方法包含描述統計、相 關分析與結構方程模式(驗證性因素分析與中介效果檢驗)。 本研究所有假設接獲得支持,且模型適配程度良好。數據結果顯示:(1) 教師知覺環境支持的程度越高,其工作投入與組織公民行為也越高。(2)工作 投入能有效預測反生產行為的減少。(3)工作投入可做為知覺環境支持對反生 產行為及組織公民行為的中介變數。 根據研究結果,本研究提出相關建議,以供學校行政單位、政策制定者及未 來研究者參考。 關鍵字:反生產行為、知覺環境支持、工作投入、組織公民行為、中介效果 20
Method
Design
This framework primarily builds on the perceived support (PS), organization citizenship behaviors (OCB), job engagement (JE), and the concept of CWB-T. It was hypothesized that the new model how CWB decreased on Taiwan campus. We had taken perceived support as latent IV, job engagement as latent mediator, OCB and CWB as latent DVs, and five hypotheses were stated as following.
Hypothesis 1. Perceived support has significant positive effect on job engagement. Hypothesis 2. Job engagement has significant negative effect on CWB-T.
Hypothesis 3. Job engagement has significant positive effect on OCB. Hypothesis 4. Job engagement mediates the JE to CWB-T relationship. Hypothesis 5. Job engagement mediates the JE to OCB relationship.
Fig.1
Hypothesized theory model
Participants
This study involved 1074 Taiwan teachers enrolled in different level schools from primary school (60.0%), junior high school (30.1%), high school (6.2%), and vocational school (3.7%). The sample included 52% male and 48% female. Of the participants, 34.4% were tutor, 30.3% were subject teacher, 26.0% were with administrative position, 5.6% were staff, and 3.7% were school president. Most part of teacher has bachelor degree (45.7%) and master degree (53.0%).
Measures
Counterproductive Work Behaviors Taiwan (CWB-T).
CWB-T had been used to describe prevalence of counterproductive work behaviors on campus. 46 items, developed by Hu et al. (2015), were used to measure the 8 latent variables under CWB-T. These 8 factors are as follows: time theft (TT) -- reducing work hours using any form of improper or inappropriate reasons, inappropriate use of resources (IUR) -- deliberate use, waste, theft, or destruction of schools’ properties, inappropriate student-teacher relationship (ISR) -- any inappropriate, unethical, or unprofessional interactions between teachers and students, inappropriate parent-teacher relationship (IPR) -- any inappropriate, unethical, or unprofessional interactions between teachers and parents, lack of professionalism (LOP) -- lack of pedagogical and professional content knowledge resulting in poor teaching performance, apathy (AP) -- lack of enthusiasm and/or unwilling to improve oneself, political tactics (PT) -- forming alliances to gain control and personal attacks, and reluctant to accept administrative duties (RAD) -- unwilling to accept any duties besides teaching. Items were dichotomous scale ranging (Happened / None). In order to lower the complexity of computation, eight factors were put into model as manifest variables.
Perceived Support (PS).
Two scales used to measure perceived support of Taiwan teachers, including perceived organizational support (POS) and perceived supervisor support (PSS).
To assess employees’ perception that the organization valued their contribution and cared about their well-being, we used a six-item scale, developed by Eisenberger, Stinglhamber, Vandenberghe, Sucharski, & Rhoades (2002), to measure POS.
In order to assess employees’ perception that their supervisor valued their contribution and cared about their well-being, Eisenberger et al. (2002) adapted the POS scale in replacing the word organization with the term supervisor. For POS and
PSS measure, respondents rated their agreement with each statement using a 4-point Likert-type scale (1 = strongly disagree; 4 = strongly agree). The Cronbach’s alpha for two scales were .85 and .83.
Job Engagement (JE).
A six-item scale was designed by Saks (2006) to measure job engagement. Items were written to assess participant’s psychological presence in their job. A sample item for job engagement is, “Sometimes I am so into my job that I lose track of time” . Participants indicated their response on a four -point Likert-type scale (1 = strongly disagree to 4 = strongly agree). The Cronbach’s alpha for this scale was .84.
Organization Citizenship Behaviors (OCB).
Organizational citizenship behavior directed to the individual (OCBI) and organization (OCBO) was each measured by four-items each from Lee and Allen (2002). Participants responded using a four-point Likert-type scale (1 = never to 4 = always). A sample item from the OCBI scale is, “Willingly give your time to help others who have work-related problems” and a sample item from the OCBO scale is, “Take action to protect the organization from potential problems”. The Cronbach’s alpha for two scales were .75 and .73.
Data analysis
The sample had been separated into two parts by random (33% sample, n = 358; 67% sample, n = 716). The 33% sample used in measurement model (Confirmatory Factor Analysis, CFA), the other 67% sample used in structure model (Structure model and mediation test).
Descriptive statistics and correlation estimated using SPSS 21 program, composite reliability (CR) and average variance extracted (AVE) were used to prove the reliability and validity of measurement model. Structure model was used to explain the relationship and effect among latent variables. Structure equation modeling (SEM) was estimated using the maximum-likelihood method in the AMOS 20 program (Arbuckle, 2011).
Results
Preliminary Analyses
Means, SDs, and zero-order correlations for the 14 measured variables are shown
in Table 2. Because the number of item were not equal in every variable, we used mean to represent. All the means of observed variables ranging .29~2.92, SD ranging .30~.65. Multivariate normality test was used to examine whether the data met the normality assumptions underlying the maximum-likelihood procedure used to test the models in the present study. The results of the multivariate normality test indicated that the data were multivariate normal, multivariate kurtosis was 12.30. Therefore, maximum-likelihood method was appropriate.
Measurement Model
Before a structural model is tested, Anderson and Gerbing (1988) suggested conducting a confirmatory factor analysis to examine whether the measurement model provides an acceptable fit to the data. Once an acceptable measurement model is developed, the structural model can be tested.
As suggested by Tucker and Lewis(1973), Byrne(1994), Hu and Bentler (1999), six fit indices were used to assess goodness of fit for the models: the goodness of fit index(GFI; values >0.90 indicate good fit), the comparative fit index (CFI; values >0.90 indicate good fit), the Tucker-Lewis Index (TLI; values >0.90 indicate good fit), the non-normed fit index(NFI; values >0.90 indicate good fit), and the root-mean-square error of approximation (RMSEA; values <0.08 indicate good fit), standardized root mean square residual (SRMR; values <0.08 indicate good fit).
A test of the measurement model resulted in a relatively good fit to the data(χ2 = 189.74***, df = 71, GFI = .93, CFI = .96, TLI=.95, NFI= .94, RMSEA = .068, SRMR = .037). All of the standardized loadings of the measured variables on the latent variables were statistically significant ( p < .001, see Table 4). CR of latent variables ranging .77~.93, AVE ranging .63~.77, both CR and AVE fit to the standard suggest by Fornell & Larcker(1981)and Hair et al (2010). Therefore, all of the latent variables appear to have been adequately operationalized by their respective indicators. In addition, most of correlations among the independent latent variables, the mediator latent variable, and dependent latent variables were statistically significant ( p < .001, see Table 5).
Table 2
Means, standard deviations, and zero-order correlations matrix(all sample, n = 1074)
Mean SD 1 2 3 4 5 6 7 8 9 10 11 12 13 14 1. TT .65 .30 1 2. IUR .29 .30 .62 1 3. ISR .49 .35 .59 .65 1 4. IPR .28 .34 .52 .64 .69 1 5. LOP .54 .37 .59 .62 .73 .67 1 6. AP .59 .34 .55 .57 .66 .62 .74 1 7. PT .46 .38 .52 .54 .65 .66 .64 .65 1 8. RAD .61 .37 .49 .49 .56 .58 .62 .69 .70 1 9. OCB-I 2.86 .41 -.21 -.22 -.16 -.19 -.18 -.24 -.25 -.27 1 10. OCB-O 2.84 .39 -.25 -.26 -.22 -.22 -.25 -.26 -.26 -.27 .70 1 11. POS 2.84 .44 -.13 -.19 -.12 -.17 -.11 -.19 -.19 -.20 .39 .44 1 12. PSS 2.76 .56 -.13 -.15 -.10 -.17 -.11 -.18 -.17 -.18 .40 .45 .79 1 13. JE01 2.82 .59 -.26 -.26 -.19 -.23 -.21 -.26 -.25 -.28 .48 .52 .31 .36 1 14. JE02 2.92 .65 -.29 -.31 -.25 -.26 -.23 -.27 -.27 -.27 .42 .52 .25 .31 .63 1 Note: All zero-order correlations are significant (p < .001).
Table 3
Model Fit Indices
Indices Measurement model Structural model Criteria N 358 716 χ2 189.74*** 345.36*** df 71 72 GFI .950 .925 >.90 CFI .961 .955 >.90 TLI .950 .962 >.90 NFI .940 .933 >.90 RMSEA .068 .071 <.08 SRMR .037 .041 <.08 *** p < .001 Table 4
Factor Loadings for the Measurement Model(33% sample, n = 358)
Factor & Item Standardized
factor loading SE. t AVE CR
CWB- Taiwan .63 .93 TT .68 IUR .73 0.08 12.72 ISR .83 0.09 14.30 IPR .81 0.09 14.05 LOP .85 0.10 14.53 AP .84 0.09 14.40 PT .80 0.10 13.87 RAD .77 0.10 13.38 OCB .70 .82 OCB-Individual .79 OCB-Organization .88 0.08 14.06 Perceived Support .77 .87 POS .87 PSS .89 0.16 9.43 Job Engagement .63 .77 JE01 .81 JE02 .78 0.07 14.20
Note: All standardized factor loading are significant (p < .001). 26
Table 5
Latent correlations matrix for the measurement model(33% sample, n = 380)
Latent Variables 1 2 3 4
1. CWB-T 1
2. OCB -.34 1
3. Job Engagement -.32 .66 1
4. Perceived Support -.24 .57 .41 1
Note: All latent correlations are significant (p < .001).
Structural Model for Testing Mediated Effects
Perceived Loafing, Monitoring and Sanctioning were taken as latent IV, Revenge Motive as latent mediator, and CWB-T as latent DV. The results shows a good fit of the model to the data(χ2 =345.36***, df = 72, GFI = .93, CFI = .96, TLI=.96, NFI= .93, RMSEA = .071, SRMR = .041). Path effect is frequently referred to as direct effect. All the effect size of structural paths were medium and significant (p < .001, see Table 6).
MacKinnon, Lockwood, Hoffmann, West, & Sheets(2002)assessed many approaches to examine mediation considering Type I error and statistical power. Found the most often used strategy by Baron & Kenny(1986)has the least power. Then, many studies using this approach have relied on the Sobel test (1982) to examine the significance of mediation effect. However, there is evidence that the distribution of mediation effect is not normal (Bollen & Stine, 1990; MacKinnon & Dwyer, 1993; Stone & Sobel, 1990), and the utilization of a significance test, such as the Sobel test, which assumes a normal distribution when examining the mediation effect, is not appropriate. Most recently, Shrout & Bolger(2002)suggest bootstrap method can be a better way to examine mediation. Bootstrap method acquires 95% confidence intervals (CI) for the indirect effect by resampling procedure. Based on central limit theorem, bootstrap method is robust even the distribution of mediation effect is not normal.
As Shrout and Bolger’s suggestion, if the 95% CI for the estimates of the indirect effects based on these 5000 indirect effect estimates does not include zero, then it can be concluded that the indirect effect is statistically significant at the .05 level.
Therefore, after the structural models were examined through the AMOS 20 program, the bootstrap procedure was used to test whether or not the indirect effects were statistically significant.
Fig. 2
Structure equation model with maximum likelihood estimates (standardized)
Mediation effect is frequently referred to as indirect effect. The indirect effect from Perceived Support to CWB-T is -.16. The 95% CI for the estimates of the indirect effects ranging -.259~-.097 does not include zero, and then it can be concluded that the mediation effect is statistically significant at the .05 level. On Taiwan campus, Job Engagement plays a role as mediator between Perceived Support and CWB-T. As the PS to CWB-T path isn’t significant, according to Baron et al. (1986), it’s a complete mediation. Shown job engagement is a very important
mediator for decreasing the deviant behaviors on school workplace. Total effect is the summation of direct effect and indirect effect, the total effect from Perceived Support to CWB-T is -.25, the 95% CI for total effects ranging -.347~-.135 does not include zero, the total effect is statistically significant at the .05 level.
On the other hand, The indirect effect from Perceived Support to OCB is .27. The 95% CI for the estimates of the indirect effects ranging .171~.402 does not include zero, and then it can be concluded that the mediation effect is statistically significant at the .05 level. On Taiwan campus, job engagement plays a role as mediator between Perceived Support and OCB. Total effect is the summation of direct effect and
indirect effect, the total effect from Perceived Support to OCB is .57, the 95% CI for total effects ranging .431~.671 does not include zero, the total effect is statistically significant at the .05 level.
Table 6
Bootstrap Analysis of Structural Model(67% sample, n = 716)
Hypothesis Path Standardized coefficient 95% CI
H1 PSJE .44*** H2 JECWB-T -.36*** H3 JEOCB .60*** H4 PSJECWB-T -.16 -.259~-.097 H5 PSJEOCB .27 .171~.402 Total effect on CWB-T -.25 -.347~-.135
Total effect on OCB .57 .431~.671
*** p < .001
Conclusion
The results of structure model shown the theory model can explain CWB-T well on Taiwan campus. As above, hypotheses 1~5 are supported. The test of mediation confirmed the mediator role of job engagement between perceived support and CWB-T. In summary, one path from perceived support and job engagement will lower CWB-T, the same path can rise up OCB on campus. Therefore, the policy maker should focus on improve the support from organization and supervisor to reinforce job engagement of teachers. In addition, according to Baron et al. (1986), the paths of direct effect is still significant, the mediation path on OCB in our model is partial mediation, shown there may be other effective mediator can be taken into consideration in the future.
References
Anderson, J. C., & Gerbing, D. W. (1988). Structural equation modeling in practice: A review and recommended two-step approach. Psychological bulletin, 103(3), 411. Arbuckle, J. L. (2011). IBM SPSS Amos 20 user’s guide. Armonk, NY: IBM.
Baron, R. M., & Kenny, D. A. (1986). The moderator–mediator variable distinction in social psychological research: Conceptual, strategic, and statistical
considerations. Journal of personality and social psychology, 51(6), 1173. Byrne, B. M. (2009). Structural equation modeling with AMOS: Basic concepts,
applications, and programming. CRC Press.
Efron, B., & Tibshirani, R. (1993). An Introduction to the Bootstrap. New York:
Chap-man & Hall.
Eisenberger, R., Stinglhamber, F., Vandenberghe, C., Sucharski, I. L., & Rhoades, L. (2002). Perceived supervisor support: contributions to perceived organizational support and employee retention. Journal of applied psychology, 87(3), 565.
Fine, S., Horowitz, I., Weigler, H., & Basis, L. (2010). Is good character good enough? The effects of situational variables on the relationship between integrity and
counterproductive work behaviors. Human Resource Management Review, 20(1), 73-84.
Finney, S. J., & DiStefano, C. (2006). Non-normal and categorical data in structural equation modeling. Structural equation modeling: A second course, 269-314. Fornell, C., & Larcker, D. F. (1981). Evaluating structural equation models with unobservable variables and measurement error. Journal of marketing research, 39-50.
Hu, L. T., & Bentler, P. M. (1999). Cutoff criteria for fit indexes in covariance structure analysis: Conventional criteria versus new alternatives. Structural
Equation Modeling: A Multidisciplinary Journal, 6(1), 1-55.
Kline, R. B. (2005). Principles and practice of structural equation modeling (2nd ed.). New York, NY: Guilford.
Lee, K., & Allen, N. J. (2002). Organizational citizenship behavior and workplace deviance: the role of affect and cognitions. Journal of applied psychology, 87(1), 131.
MacKinnon, D. P., Lockwood, C. M., Hoffman, J. M., West, S. G., & Sheets, V. (2002). A comparison of methods to test mediation and other intervening variable effects. Psychological methods, 7(1), 83.
Saks, A. M. (2006). Antecedents and consequences of employee engagement. Journal of managerial psychology, 21(7), 600-619.
Tucker, L. R., & Lewis, C. (1973). A reliability coefficient for maximum likelihood factor analysis. Psychometrika, 38(1), 1-10.
附錄四、校園職場工作經驗調查表-A 版
各位老師您好: 這是一份關於校園職場工作環境的調查,目的旨在瞭解中小學教師在教學與行政上的現況,共 分為四個部分。做答所需時間約15~25分鐘,請依據您目前的工作環境現狀予以評估,您提供的訊 息十分重要,調查結果僅供學術用途,沒必要、也不會做其他用途且資料不會單獨個別使用或外洩, 敬請您安心填答。感謝您的協助、支持與合作。 為了表達感謝,研究團隊提供一台ipad mini2做為抽獎禮品,請您在最後一頁留下Email以便在 您獲獎時聯絡您。 敬祝 身體健康、事事如意 國立政治大學教育學系 主持人 胡悅倫 教授 助理 洪兆祥 博士生 敬上 聯絡方式: 胡悅倫 joyhu@nccu.edu.tw 洪兆祥 jshung@outlook.com 第一部分:基本資料 1.性別 □男 □女 2.職務 □科任教師 □教師兼導師 □教師兼行政職 □行政人員 □校長 3.服務年資 年 4.最高學歷 □大學 □碩士 □博士 5.學校所在區域 □北部 □中部 □南部 □東部 6.學校規模 (全校班級數) □小型(12 班以下) □中型(13~48 班)□大型(49 班以上) 7.學校所在地 □都市 □鄉鎮 □偏遠(離島、山地、特偏) 下一頁尚有題目,請翻頁 31第二部分: 此部份乃針對教師在教學及行政上可能從事的行為, 請依據您的工作環境,評估下列各項行為之發生頻率? 請在右欄勾選最適當的選項。 從未 偶爾 經常 總是 1 教師謊稱病假。 □ □ □ □ 2 教師不假外出。 □ □ □ □ 3 教師早退遲到。 □ □ □ □ 4 教師不顧工作情況,堅持要請假。 □ □ □ □ 5 教師於上班時間處理私人事務。 □ □ □ □ 6 教師於上班時間掛網、網購。 □ □ □ □ 7 教師於上班時間一直聊天。 □ □ □ □ 8 教師浪費軟硬體資源。 □ □ □ □ 9 教師佔用公共軟硬體資源。 □ □ □ □ 10 教師偷竊公款或公用器材。 □ □ □ □ 11 教師破壞公用器材。 □ □ □ □ 12 教師偏愛或討厭特定學生。 □ □ □ □ 13 教師懲處學生失當。 □ □ □ □ 14 教師嘲弄學生。 □ □ □ □ 15 教師歧視弱勢學生。 □ □ □ □ 16 教師愛找特定學生的麻煩。 □ □ □ □ 17 教師偏愛成績好的學生,忽略成績差的學生。 □ □ □ □ 18 教師粗糙或冷漠處理學生問題。 □ □ □ □ 19 教師刻意隱瞞或扭曲學校訊息。 □ □ □ □ 20 教師在家長面前舉止失當。 □ □ □ □ 21 教師鼓勵家長對抗學校。 □ □ □ □ 22 教師聯合家長四處陳情。 □ □ □ □ 23 教師漠視家長訊息或不願意與家長溝通。 □ □ □ □ 24 教師備課不充分。 □ □ □ □ 25 教師不按進度上課。 □ □ □ □ 26 教師在上課期間發表不當言論。 □ □ □ □ 27 教師指派過多或過少的作業給學生。 □ □ □ □ 28 教師不批改作業或隨便批改。 □ □ □ □ 29 教師經常以考試、自習或影片取代上課。 □ □ □ □ 30 教師不願意進行課業輔導。 □ □ □ □ 下一頁尚有題目,請翻頁 32
第二部分(續) 此部份乃針對教師在教學及行政上可能從事的行為, 請依據您的工作環境,評估下列各項行為之發生頻率? 請在右欄勾選最適當的選項。 從未 偶爾 經常 總是 31 教學無熱情。 □ □ □ □ 32 教師閒置教具,未充分發揮功能。 □ □ □ □ 33 教師對所負責科目不夠熟捻。 □ □ □ □ 34 教師不願意參加研習。 □ □ □ □ 35 教師缺乏進修意願。 □ □ □ □ 36 教師私下講同事壞話。 □ □ □ □ 37 教師散播不實言論。 □ □ □ □ 38 教師辱罵同事。 □ □ □ □ 39 教師刻意忽視同事。 □ □ □ □ 40 教師刻意排擠他人。 □ □ □ □ 41 教師搞小團體彼此對立。 □ □ □ □ 42 教師影響或煽動其他老師,為反對而反對。 □ □ □ □ 43 教師不配合行政,應作為而不作為。 □ □ □ □ 44 教師反對所有教育改革。 □ □ □ □ 45 教師不願意擔任行政工作。 □ □ □ □ 46 教師與各處室主任之間溝通不良。 □ □ □ □ 47 同仁們有多常發生爭執? □ □ □ □ 48 同仁們有多常對彼此大聲咆哮? □ □ □ □ 49 同仁們有多常對彼此無禮? □ □ □ □ 50 同仁們有多常對彼此做些令對方討厭的事情? □ □ □ □ 第三部分: 請依據您工作環境的情形,評估下列各項敘述的同意程度? 請在右欄勾選最適當的選項。 非常不同 意 不同意 同意 非常同意 1 我的組織非常關心員工的福祉。 □ □ □ □ 2 我的組織會考量員工的目標與價值觀。 □ □ □ □ 3 我的組織不太關心員工。 □ □ □ □ 4 我的組織尊重員工的看法。 □ □ □ □ 5 當員工需要特別幫助時,我的組織會願意伸出援手 □ □ □ □ 6 當員工碰到問題時,能從組織中得到協助。 □ □ □ □ 7 我的組織會原諒員工本意良善的過錯。 □ □ □ □ 8 一有機會,組織就會占員工便宜。 □ □ □ □ 9 我的上司尊重員工的看法。 □ □ □ □ 10 我的主管真的關心員工的福祉。 □ □ □ □ 33