College of Management
I-Shou University
Master Thesis
Investigating the Relationship between Service
Quality, Teaching Quality, Learning Environment
Quality, and Students Satisfaction
Advisor: Ming-Chi Tsai
Graduate Student: Van-Luom Dao (Kent)
Acknowledgements
My heartfelt thank my dissertation committee member for their extraordinary support. My deepest gratitude and appreciation to my instructor, Dr. Tsai, who was my guidance, unwavering supports, invaluable mentor, and insightful ideas shaped both my dissertation and my character.
A sincere thanks to my family for their moral and financial support and their encouragement during being staying away from home and my studies, I’m really appreciated.
A special thanks to my friends who gave me your advices and supports.
Finally, thank you to all the students that generously provided their thoughts and opinions on the satisfaction survey.
ii
Abstract
Over the past decade, because of increasing pressure for institutions to respond to the labour-market and prepare students for employment after graduation, many Taiwan universities have increased their quality standards for higher education. However, do the service quality, environment quality, and teaching quality they provided fit the requirement of foreign students? It is a question worth to investigate if Taiwan's university want to compete with other university in the world. To answer the above question, firstly, this study examines how international students feel about the service quality, environment quality, and teaching quality of the university they studied. Then, the relationship between service quality, teaching quality, learning-environment quality and student satisfaction are also investigated. Questionnaires were used for data collection. Samples are selected from the students in one university in south Taiwan and 250 questionnaires were collected. Three research questions guided the investigation, and the Statistical Package for Social Sciences was used for data analysis. Results reveal that the administrations of this university provide quality service standards at medium levels and quality service standards positively affect students’ satisfaction. Based on research results, recommendations to the University for improving the implementation of quality standards which will ensure continuous improvement and student satisfaction are provided. The empirical results of this study can provide support for the Parasuraman’s SERVQUAL (1985), which related to the factors contributing to students’ satisfaction.
Keywords: Service Quality, Teaching Quality, Learning Environment Quality, Satisfaction
Contents
Acknowledge ... i
Abstract ... ii
Contents ... iii
List of Tables ... v
List of Figures ... vi
Chapter 1 Introduction ... 1
1.1 Research Background ... 1
1.2 Statement Problem and Research Objective ... 3
1.3 Significance of Problem ... 5
Chapter 2 Literature Review ... 6
2.1 Service Quality ... 6
2.2 Teaching Quality ... 8
2.3 Learning Environment Quality ... 9
2.4 Student Satisfaction ... 11
2.5 Perceived Value ... 14
2.6 Outcome Quality ... 15
Chapter 3 Methodology ... 18
3.1 Research Design ... 18
3.2 Sampling Size ... 19
iv
3.4 Measure ... 20
3.5 Data Analysis ... 20
Chapter 4 Result and Discussion ... 21
4.1 Descriptive Analysis ... 21
4.2 Reliability and Factor Analysis ... 27
4.3 Regression Analysis ... 36
Chapter 5 Conclusion and Suggestions ... 42
5.1 Conclusion... 42
5.2 Limitations ... 43
5.3 Suggestions
...44
References ... 45
List of Tables
Table 4-1 Profile of Respondents ... 22
Table 4-2 Mean & Standard Deviations of Questionnaire Statement ... 24
Table 4-3 KMO and Bartlett’s test and Significant ... 27
Table 4-4 Exploratory Factor of Independent Variables ... 27
Table 4-5 Exploratory Factor of Dependent Variables ... 31
Table 4-6 Statistics of Measure ... 33
Table 4-7 Reliability Result ... 34
Table 4-8 Correlation Result ... 35
Table 4-9 The Relationship between Student Satisfaction and Independent
Variables ... 36
Table 4-10The Relationship between Perceived Value and Independent
Variables ... 37
Table 4-11The Relationship between Outcome Quality and Independent
Variables ... 38
vi
List of Figures
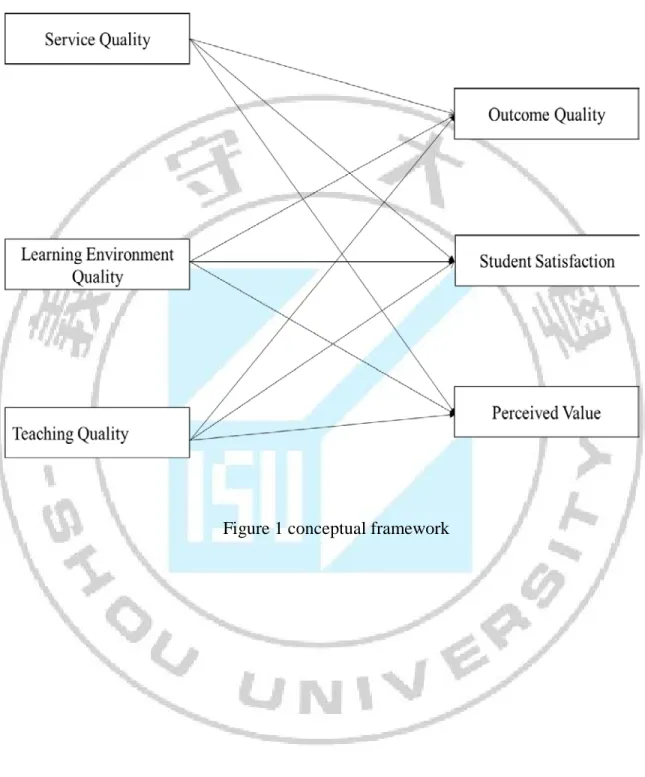
Figure 1 Conceptual Framework ... …..17
Figure 2 Model of Service Quality Measurement………40
Chapter 1 Introduction
Basically, students continue being enrolled at higher educational institutions and base on how well an institution’s services and training programs to which students satisfy. They will defect to competitive institutions if they are dissatisfied with an institution’s services. So higher educational institutions usually have to measure the service quality they provide in an ability to improve on them that stem possible student defection.
1.1 Research Background
With the competition of higher education institutions are increasing, the researchers indicated that service quality, teaching quality and learning environment quality is also the important determinants of students’ satisfaction.
And the quality education is one of the most important for a country’s comprehensive development (culture, society, economy, etc.). Therefore, higher education is also one of the most important institutions for training a skilled human workforce and represents an investment in human resources. Based on the level of the qualitative and quantitative development of the educational system can determine the development of a community (AkhavanKazemi, 2005).
The service quality measurement in higher educational institutions has still been an unfavorable and challenging endeavor. Because a number of students are very high and the most important things that institutions continue improving their services quality, many regional and national accrediting agencies have been improving by using tangible quality measures.
The evaluating of teaching quality in higher education is the problem that continues being contended, with some disagreement the definition and the methods of evaluation (Gage, 2001; Huber, 2000; Ramsden, 1991). Obviously, although the training quality has been challenged, the key obligation of higher educational organizations keep concentrated on studying.
The educational institution service supporting student is improving depend on increasing learner’s needs in its services that is registration and admissions, faculty, learning environment, and financial aid, the others. The Boards of higher education have to be coordinated to those changing needs to have the loyalty of learners and ensure that organizations are making student satisfy with they expect (Hanna & Wagle, 1989). Especially, educational institutions cannot be
2
exaggerated, because service perceptions of student impact to their selection of continuing enrolling or defecting to another organization (Plank & Chiagouris, 1997).
Nowadays, the academic environment is also the important element for students to choose and make educational institutions to attract and retain students ought to be seriously studied. Moreover, they need to start discovering for effective and creative ways to attract and retain and foster stronger relationships with students if they want to get competitive edge in the future. Especially, with the private schools that need to base on the interplay and the mechanism of education. From some papers, students may be defined as “potential customer”, and become more and more exquisite. This is also the difficult issue that the private institutions maybe not get any supports or government financial aid.
The main reasons for students’ withdrawal that is their expectation cannot be fulfilled on the institution (Alridge & Rowley, 2001). Based on the research by Kanji, Malek, & Wallace (1999) indicated that most institutions (educational institutions in Malaysia) did support a great deal of importance to meet student's needs as to business organization, but they still lack of awareness of student among the staffs, and become a common drawback for many institutions.
Quality directly evaluated by customers using, so in higher educational institutions the evaluation of service quality through customers’ opinion and the potential consumers is students that become very necessary. Thus, educational institutions or the Universities have objectively not only cared about investigating infrastructures, input-standard and output-standard and the results of studying of students and the others in education structure, but also recognized about what they had provided, expected. The literatures related to the relationship between service quality variables measurement and student satisfaction variables were still limited. The research on student satisfaction measures with the educational institution services is lacking, and thus warrants further learning.
From theories and realities of education quality and training quality, the topic was selected “Investigating the relationship between service quality, teaching quality and learning environment quality, and students’ satisfaction”.
1.2 Statement Problem and Research Objective
1.2.1 Statement Problem
In recent years, the system of higher education in Taiwan continuing developing both scale and quality in the public schools (National university, Religion university, open-university, main-point university, community university, interdisciplinary university), private schools and semipublic schools. Many universities are modernizing both tech-facilities and the staff, Lecturers, training programs. However, objectively, higher education in Taiwan is also facing some difficulties, challenges, effecting education quality and quality improvement directly.
Currently, the strong challenges affect to higher education is between requirement of developing and conditions of guarantee quality. In fact, because the difficulty of economic condition, budget contributed to education and higher education in particular are still low, not enough to support the necessary requirements that is school building, library, laboratory, practice department... Moreover, the acquirements are for higher education standardizing, modernizing, integration (in Taiwan, Viet Nam) associating with the areas and the world as well as innovating contents, programs, teaching methods requiring both efforts and determination.
As we have seen in the current context of Taiwan on education sector that we can see the government seems taking more action toward higher education standard and system especially the public school is not much different to private school about operating that are full of budget, teaching quality, material, and professional, which have been showing the efficiency of students from other countries. In this situation, many students are from rich and medium status families have been choosing their children to private school instead because they attach special importance to environment quality with full of modern facilities, service quality and perceived value,…
So, there are many international students have recently chosen Taiwan country to study especially, Vietnamese students make up a very high rate. Taiwan has the quality education system as well as the other developed and developing countries in Asia (Singapore, Japan, Korea…).
Taiwan’s education has been also evaluated that is very high in Asia, there are many the large of and the best Universities by some schools voted among Top of 100 best Universities in
4
world wide. In this country, students can select to study in English or in Chinese that is very comfortable for students who is from any others. In addition, the government of Taiwan always pays attention and investigate to coordinate to the developed countries in the world to study more and apply some modern and quality programs for home country education system and there are many programs cooperate and commit to support international students to study with grant scholarships, reduce tuition fee, allow oversea student to work in part-time job by the industrial law in Taiwan.
Beside there are also different opinions, some students are not whole trust on and these are a roost cause problem in Taiwan’s education especially in private Universities.
1.2.2 Research Objective
Generally, the research will state the association of service quality - environment quality - teaching quality and student satisfaction in higher educational institutions.
This study mixed from the importance of modern educational theory implementation, which gives learners in educational programs, show continuous improvements to the services of higher educational institution, and adapts these to achieve important improvements in service quality, teaching quality, learning environment quality.
This study was impetus arose from one university in Kaohsiung, Taiwan, which has been engaged in developing training programs to finish and compute its service quality, teaching quality and learning environment quality. Increasing and improving an educational institution have to know and understand it, and information derived from studies is the future improvement fuel.
This research indicated student satisfaction in university services and environment at the large universities by minimizing detractors to provide exceptional service quality, positively influencing student satisfaction, and building loyalty of students that is a long term mission. And the result of this study will help university administration, faculty, staff, lecturers…more and more improve the training quality in higher education.
The purpose of this study is:
(1) To explore the association of service quality–teaching quality–learning environment quality and satisfaction of student
(2) To explore the main item of service quality– teaching quality – learning environment quality that contributes most to satisfaction.
Research Questions :
1. What are the critical factors of service quality, teaching quality, learning environment quality that contribute most to student satisfaction?
2. How do student rank the implementation levels of the standard of services, teaching and learning environment among students in the university?
3. Do the implementation levels of service quality/teaching quality/learning environment quality standards affect student satisfaction in the university?
1.3 Significance of Problem
When higher education is one of services that mean all the higher educational organizations provide the service and customers that are students, we also can say that students play many roles because they are direct-customers and also product of training education so student is very important consumers.
The research departments of educational institution play role in considering a lot of design to meet student expectation and continue enrolling. Lecturers, staff, learners, parents and faculty may have a different demand.
Importantly, this paper measure service quality level, teaching quality level, learning environment quality level and student satisfaction level like Iacobucci, Ostrom & Grayson (1995, p. 296) showed that “Presumably, if quality programs were initiated based on marketing research- that is, the changes were market driven and customer oriented- the quality improvements should lead to customer satisfaction”. Based on this research results may be given valuable information on the items, which have been presented a priority by students in appreciating the services quality in educational institutions and their satisfaction. Moreover, the
6
paper also provide some useful recommendations and conclusions the private educational institutions
Beside the importance that measure student satisfaction with the University services, many institutions are evaluating indicators other than institutional services perception of student.
Chapter 2 Literature Review
This chapter definite the theoretical basis for the research, resulted from relevant literatures, concepts, and instruments of service quality and teaching quality and environment quality. The main reason is to improve and implement the definition of “service quality”, “teaching quality”, and “learning environment quality” at university and how effect student satisfaction. Furthermore, take a look about all the theory of relevant research topics.
2.1 Service Quality
In the period of the World War, the quality was measured by the product (physical features). At this time, “service quality” was likely to the exchange value of product or from a set of standard specifications (Tenner & Toro, 1992).
Service quality is the level of success or failure in meeting expectations that are accepted by student (Lewis & Booms, 1983). It is a measure of how well service level delivered matches customer expectations on a consistent basis.
The concepts of service quality and consumers’ expectation and perceiving that estimated by comparing the evaluation of consumers fore-and-aft enjoying the service quality Johnston (1995). This study will be clarified issues about service quality and the consumer segments. Found out from many different database resources and collected the famous researchers’ conception relating to the factors constructing service quality. Most they confirmed that customers’ expectation and perceiving was not only one aspect but also many different aspects.
The research of Parasuraman et al. (1988) showed the conceptual model of service quality for the service industry including 10 majorities of service quality: empathy, reliability, responsiveness, credibility, security, courtesy, competence, access, communication and tangibles.
With the explorations of Lassar, Manolis, & Winsor (2000), they found out two of the most prevalent and widely accepted perspectives on service quality that is the SERVQUAL model and the Technical (Functional) Quality framework.
The study of Walker (1987) told that the dimension determining is reliability of product, quality of environment and distribution channel assisting to assurance.
There are a lot of different frameworks that used to improve instrument which measure the service quality such as Rapid Assessment Methodology, Cost of Quality, Quality Function Development and Importance-Performance Analysis of Yasin & Yavas (2001), most of them remarked employees as the cornerstone of the service quality and the satisfaction of consumers.
However, the identification of Parasuraman et al. (1988) is the best. Because recently, there are many researches of service quality measurement, but the scale of SERVQUAL is the most concrete and trustful include 5 components:
1. Reliability: is the ability which perform the promised service dependably and accurately 2. Assurance is the ability of employees and their the knowledge and desirable to bring trust and confidence
3. Tangibles: the appearance of equipment, communication materials, personnel, physical facilities
4. Empathy: the provision of attention to customers, caring.
5. Responsiveness: the willingness to help customers and to provide prompt service.
Service Quality is a critical prerequisite for sustaining and establishing relationship with potential customers and the relationship of service quality and consumer satisfaction emerging as significant and strategic concern topic (Cronin & Taylor, 1992). Generally, an antecedent to satisfaction that is service quality is perceived (Spreng & Mckoy, 1996). So, understand about the prehistoric and customer satisfaction determinant may be get a high value deserved a organization service in a competitive environment (Lassar, Manolis, & Winsor, 2000).
According to the study of Dyson, Farr, & Hollis (1996), the service quality is likely to the better and standardized output delivered by a service. The service quality in the higher educational institutions is the fundamental aspect of educational excellence.
Gronroos (1984) said that “service quality” is highlighted by the items "the best outcome quality", "the basic interaction" and “the institution image”. He showed that the importance of quality is whether what university provided as the outcome or expectation appreciated by student after receiving.
Although it deals with these difficulties, generally, students are recognized to be the potential customers in educational institutions (Hill, 1995; Meirovich, & Romar, 2006). Kristensen, Martensen, & Grønholdt (1999) proved that the educational institutions would not do a business, could not conduct the research and could not provide service unless there are students to teach.
The previous studying about the service quality at university usually focus on administration less than academic, focusing on affective course conducting method and the desired effect (Cheng & Tam, 1997; Soutar & McNeil, 1996; Fuhrmann & Geyer, 2003). Moreover, the administration department also attends to measure student satisfaction enrolling and academic advising across the other faculties and other services to assure positive quality service that compliments the academic.
2.2 Teaching Quality
Teaching quality concentrates on how the teachers are selected and their development because of high-quality educational programs for which teachers are responsible for implementing, performing as academic adviser, and providing advice to their students (Bazargan, 1999).
In England, the teaching quality has been measured (since 1992) beginning with what became known as the Teaching Quality Assessment (TQA). TQA provided a review of external and improved evaluation of teaching quality and learning at level of educational institution. It also allowed institutions to choose their own goal, adopted a wide comprehension of teaching quality, depend on the management and promotion of student learning, and involved students in the evaluation of teaching quality they have received. It involved a system depending on self-evaluation, external evaluation, and peer review (Taggart, 2004).
The research departments of higher educational institution have been doing a survey and running to analysis student opinions via providing the institution services as relate to nation
Because service quality cover from business to education, a lot of higher educational organizations have been influenced and stimulated by popular framework for both conducting and administrative support functions (Martensen et al., 2000).
As far as we know teaching quality takes very important role to ensure the education quality and standard of every nation even developed or developing countries. That is the reason why an effective teacher who has to maintain it in order to perform the mechanism for transferring knowledge to students. Every student normally wishes to gain and possess the knowledge and skills from their teachers. Based on the Taiwan educational context, teaching quality depends on qualified teacher, enough motivation and incentive, enough capacity or professional development. By the way, the research of NGO Education Partnership showed that quality of teaching may be depend on a teacher's reputation, the extent to which the personal teacher has affected change in student acknowledge, behaviors, attitudes, values or a complete theory or ideology of acquisition and application of learning.
The poor education arises from the low teaching quality. That is also the reason why teacher have to discuss day by day, at school teacher meeting, training or workshop is very popular for further improving teacher quality and ability as well (Charlene, 2012). The most common causes of low teaching quality that there is lack of professional improvement and insufficient training or no training at all (Teaching in Cambodia, 2008). But the low pre-service quality leading to the opportunities for professional development are limited.
The study of Healey (2000) has showed that teaching quality in education influenced on student perception, high quality teaching encourages students to structure their knowledge and motivates
2.3 Learning Environment Quality
From the 3P model of Bigg (1996) which defined the process of learning is the interaction with 3 variables: “the learning environment and characteristics of student (presage), students’ target to learning (process) and studying outcomes (product)”. Basically, we can explain these as the factor of personal and environment attract student to adopt a specific target to learning or so-call mediate the types of outcomes achieved.
Learning environment existing prior to learning time, and comprising two major types: student’s enduring personal characteristics (e.g. pre-knowledge, skills, personal characteristics), and environment’s features proved the learning environment (e.g. teaching methods, workload, and course structure). Ramsden (1991) have proposed that students satisfy to learner academic environment, and the motivations and expectations that decided how learning environment items effected approaches to study and learning outcomes.
Smith & Ennew (2001) showed that there were some items of special assistance so-call the university facilities and the external aspects, which students utilize such as cafeterias, library, classroom facilities, dormitory, bookstore,… and residential accommodation that will directly and indirectly effect the university evaluation. Based on the study of Umbach & Porter (2002), also proposed that one of the important factors to measure student satisfaction is size or a number of departments at the University.
Students spent a lot of free times for physical, facilities, infrastructure dimensions of their learning experiences, thus, aspects of studying environment is an important factor and cannot forsake when evaluating service quality perception (Oldfield & Baron, 2000; Cuthbert, 1996). The literature show up the following common elements that are factors of physical environment quality:
(a) Course content (Atheeyaaman, 1997);
(b) Library facilities (Oldfield & Baron, 2000; Atheeyaman, 1997); (c) Computer room facilities (Atheeyaman, 1997);
(d) Lecture room facilities (Clemes, Ozanne, & Laurenson, 2001; Oldfield & Baron, 2000)
(e) University layout (Ford & Joseph, 1999). (f) Social factors (Brady & Cronin, 2001).
If any educational institution wants to be more attractive and effective, learning environments should be recovered by proving a variety of study programs and opportunities that can achieve the desired learning outcomes (Hersh, 2007).
Spooren, Mortelmans, & Denekens (2007) posited that the harmonious organization, teachers’ experiences or skills, professional, transparency in students’ evaluation, interaction and training are the main characteristics that mentally help learner develop.
Moreover, Dick, & Basu (1994) indicated that educational institution have to manage and update libraries as well, set security systems, improve facilities, class decoration, use multimedia associate with staff’ operation in administration to get a support and advice.
Faculty quality was evaluated by student when in class or any time their lecturer availability and faculty attitude toward students. Generally, learners very satisfied with the experiences, ability, job consultant, study sources, facilities as the e-portfolios to save their academic results (Greene, 2007).
2.4 Student Satisfaction
Satisfaction that means people feels happy and joy when they have met their expectations what they received. The University used right methodologies to indicate students’ satisfaction level with the services and programs they provide (Qureshi et al., 2011). Discovering the dimensions of student satisfaction by responding questions for student satisfaction with educational institution services whether students satisfied those services and would recommend prospectively learner to attend the institution.
The measurements of student satisfaction are identified a strategy for educational institutions. If the high satisfaction is, the more profits institution made as a result offered students with experiences, ability and goals. Student may be satisfied with their learning goals and their learning environment and will recommend positively about the university because satisfaction is the primary goal, and it reflects the level of service quality (Majeed et al., 2008).
López (2002) whose institutional study on student opinions indicated there are 5 effective criterions that were “limitation of academic; the interaction of learner and faculty; program and cooperation; developing educational experiences; and supportive campus environments” (p. 361). The paper was researched by a Myriad training organization directly influenced service quality and student satisfaction with the organization services.
Elliot & Shin (2002) discovered the variables get high P-value in the model that directly affected on overall consumer satisfaction with university performance:
12 (1) Able to get desired classes.
(2) Knowledgeable advisor/faculty. (3) Overall quality of instruction.
(4) Tuition paid is a worthwhile investment. (5) Approachable advisor.
(6) Safe and secure campus.
(7) Clear and reasonable requirements for major. (8) Adequate computer labs.
(9) Access to information.
According to the study of Kotler & Clarke (1987), “satisfaction” was described as a positive feedback by someone who has an outcome or knowledge that meets their human needs. Satisfaction is also a relative level function of expectations and perceived value. The expectations which arise prior to students even enroll the higher educational institution, it is important to the conductor to decide first what learner’s expectation is before enrolling the university (Palacio, Meneses, & Perez, 2002). But Carey, Cambiano, & Vore (2002), they posit that satisfaction certainly interact to student perceived value and acknowledge during their university years.
While most of study of student satisfaction concentrate upon consumer perspective, researchers is facing how to create a standard definition for student satisfaction and provide the theory of student satisfaction selected and modified in order to make clear the meaning of student satisfaction (Hom, 2002). Although, it really hard to define student as consumer but throughout some research of education field , posited that student was as “customer” and as fee payers, reasonably demand that their selection be heard and acted upon (William, 2002).
According to Zeithaml et al. (1988) satisfaction is the resultant outcome of the administrative institution as well as the performance of educational system. If higher educational institution provide a good learning environment which make learning more convenient as the best infrastructure for utilizing in education cumulated with essential parameters of academic and
professional development, students are going to be more motivated and satisfied with finishing their study result (outcome quality).
Rodie & Kleine (2000) presented a position that if educational institution provide necessary educational facilities associate with effective staff in training and teaching, students will be good, loyal, and motivated learners. The performance of lecturers in the class and after class is the key for students’ impartiality, motivation and satisfaction to be enhanced.
The study of Wachtel (1998) showed that the course lecturers’ performance and teaching methodology as the crucial conductors evaluated by learners in improving their education and successfully accomplishing their studies that mean the more professional the instructor the more positive is going to be appreciation of student (Edstrom, 2008) so the more is going to be the reliability on the faculties and lecturers (Sproule, 2000). Lecturers’ ability, professional skills, responsibility and mission sharply impact on students’ class performance. Students are positively influenced by the lecturer and training program and academic activities.
Shevlin et al. (2000) said that the lecturers performing with exactingness of time, propriety, rationality achievement are more popular (Elliot & Shin, 2002). Because level of student satisfaction grow by associating with those course lecturers who truly resolve the problem, projects, exams and facilitate students’ logical learning and competence development (Dalton & Denson, 2009).
Student satisfaction framework often concentrate on comparing student demands to the perceived service provided (Oliver, 1980), frequently as related to a gap in Parasuraman’s service quality model (1993). Service qualitative perceptions are existed prior to the needs of what should and will be made a comparison to the service provided (Boulding et al. (1993) and they also poster a model to develop a theory that student satisfaction proved a accumulative influence that may happen when student is received the service. This model indicated that students make comparing evaluation during every these private service encounters.
14
2.5 Perceived Value
According to the definition of Zammuto, Keaveney, & O’connor (1996), the perceived value was defined that consumer’ appreciation the quality of product or service.
Perceived value that means how student gain the target set up. There are some methods used in describing, but basically there are some researchers posited that students accept two basic orientations or approaches. The target to learning in ‘deep’ is related as contended for raising the value of acknowledge by performing and making the opinion comparison. Contrastingly, ‘surface’ studying relates to as the strategies of reproduction associate with comprehending value information (Marton & Salijo, 1976; Thomas & Bain, 1984).
Gronroos (1982) perceived value definition was arisen from method of disconfirmation (Churchill & Suprenant, 1982). In his model, perceived value from service was known as the comparison of student expectation and the reality they received.
Alridge & Rowley (2001) defined that when students perceived the educational institution’s service quality and learning environment standards associated with experienced faculty, modern and great facilities of study and infrastructure, they interested in their institution that will clearly be retained. The students are motivated from the academic as well as the capacity of administration in their organization.
Perceived value of quality service might be the result of the service dimension evaluation and in this case of a student, these could arrange from items with office faculty, conductor, the department head etc. (Hill, 1995). Beside, a result based on the study of Zammuto et al. (1996) if the value of service regularly perceived of the educational institutions at a level which exceeds student expectations, their evaluation of service will be positive (high quality). Conversely, if the institutions fail to meet student expectations, the service will be negatively judged (poor quality).
Students also get motivated from educational institutions where are provided with the reliability of the learning environment, because the high quality they perceive the high affiliative and attractive will be (Keller, 1993).
Ramsden & Entwistle (1981) proved the liking between to what student expected and the outcome value they received from university service. This relationship was researched by a study of the Approaches to Studying Inventory (ASI; Entwistle et al., 1979) and the Course
Perceptions Questionnaire (CPQ; Entwistlen & Ramsden, 1983), from the results cross-disciplinary sample of English higher education students, the conductor collaborated dimensions to indicate the positive relationship between academic environment and gain student learning target.
2.6 Outcome Quality
Outcome quality is the outcome of the production process, or what the customer receives in a customer encounter.
Outcome quality was defined as the studying outcomes (acknowledge, attractive) which learner obtain in the studying process. Basically, depth, the studying outcome has been basically presented via the cores (grade point averages). Effective or ‘satisfied outcomes’, in a state focusing on student appreciation of educational institution quality, more and more have been researched by many authors. There are 2 kinds of implementing global appreciation and perceptions of specific skill improvement (e.g. key or transferable skills).
It is important to know that the definition of higher education quality basically depend on the product appreciation (Ewell, 1994). Outcome quality is usually related to educational acknowledge; the final results of learning, program, or curricular goals (Anderson et al., 2005).
Judging students' outcome quality usually ask students what they attemp after they complete their studies (Anderson et al., 2005), or measuring student’s knowledge, skills and abilities gained after graduating in educational institutions (Gardiner, Anderson, & Cambridge, 1997)
Outcome quality (conducting and studying result) is as the achievement and results of what students have gained in their learning process (Anderson et al., 2005). Outcome quality is also acknowledged a principal instruction when learners satisfy the service quality. Basically, the achievement of product of study process may be as:
(a) General education (Drexler & Kleinsorge, 2000; Pace & Kur, 1998); (b) Personal and social (Tam, 2006; Pace & Kur, 1998);
(c) Vocational preparation (DeShields et al., 2005; Ford et al., 1999; Pace & Kur, 1998); (d) Information technology (Drexler & Kleinsorge, 2000; Pace & Kur, 1998).
(e) Intellectual development (DeShields et aI., 2005; Pace & Kur, 1998)
Principally, researchers have discussed previously that is to determine the level of outcome quality under assessments of understanding, skills, consequences or satisfaction. Furthermore, previously researches, those appear to be a constituted model of study that students’ an adoption of the consequences of deep approach being better able to indicate their understanding of material (Balla et al., 1990) or improve their definition of material. There is also evidence demonstrating that the results of students’ a deep approach to higher levels (Entwistle & Ramsden, 1983; Ramsden et al., 1986). But, it is important to overcome the study target and goals association that the justification used to assess students’ consequences itself focuses on experiences and acknowledge.
Hasan et al. (2008) showed that quality assurance of the institution have to establish faculty members by the way making student feel cooperative, coordinative, empathy (Jacoby & Chestnut, 1978).
From the literature following hypotheses can be postulated: H1: Services quality positively affects the students’ satisfaction. H2: Service quality positively affects the students’ perceived value. H3: Service quality positively affects the students’ outcome quality.
H4: Learning environment quality positively affects the students’ satisfaction. H5: Learning environment quality positively affects the students’ perceived value. H6: Learning environment quality positively affects the students’ outcome quality. H7: Teaching quality positively affects the students’ satisfaction.
H8: Teaching quality positively affects the students’ perceived value. H9: Teaching quality positively affects the students’ outcome quality.
From these the research framework was drawn:
18
Chapter 3 Methodology
This study was designed to use the model of SERVQUAL to indicate international student perceptions of service quality/environment quality/teaching quality in one university located in south Taiwan.
Moreover, this research examined if international student satisfaction depend personal information respondents, and satisfaction and university service comparison, comparison of learning environment and teaching quality in all universities.
Chapter 3 outlines the study plan and the methodology used to test the nine hypotheses formulated in chapter 2, and to achieve the three research objectives stated in Section 1.2. This chapter focuses on research design, population and sample, instrument, data collection, data organization, questionnaire design, and the data analysis methods used in the study.
3.1 Research Design
Research will be carried out in two ways: preliminary research and official research. Firstly, this study used quantitative research: the skill of discussing on group that could explore and fulfill to the model. Secondly, the paper used quantitative research: directly collect data by questionnaire table that not only selected the variables observing but also determine the value and the truth of models of theory. Based on the result of analyzing statistical data by SPSS software (version 18.0) and MS Excel
Questionnaires are used to gather the samples of population data (Weisberg & Krosnick, 1989). The analysis of description gives the result of respondent characteristic by SPSS. This results also reply on the questions of who, what, where, when, and how, but it can’t analysis the reason of variables relationship together.
The research will be adopted from conceptual framework. The dependent variable in this study is generally student satisfaction, outcome quality and perceived value that are measured by learner who receive from university service. The independent variable in this paper is service quality, teaching quality, environment quality in university that measures student satisfaction and perceived service.
In addition, by reading and researching on some previous papers, materials which relate to this topic and summary all of relative materials. And refer to Professors who have experienced in higher education institution.
3.2 Sampling Size
A number of respondents are determined depending on factor dimensions as the study purpose, population size, the unsuitable items, the error items. The target samples are international and Taiwan students, 18 years old or over living the main campus of oversea students in one university in south Taiwan.
Hair & Black (1998) instructed that the sample size in minimum needed to be at least five multiple the question items. There are 49 questions in this study, thus a minimum of 245 completed surveys are required. The target sample is 250.
3.3 Data Collection
This research, the instrument to collect data is questionnaire. The researcher and some volunteers directly distributed the survey about student opinions of faculty, lectures, academic environment. In order to increase the general is ability of the results, prerequisite or core commerce subjects were selected.
The survey was designed in two part respondent information and single choice question items, part 1 is measurement of service quality, teaching quality, environment quality in University and measurement of students’ satisfaction, outcome quality and perceived value in this University, and part 2 is demographic sector, in this section 8 questions about the gender, age, status, nationality, purpose of studying, enrollment status, education level.
The distributors explained how to fill out the questionnaire in free time and give back the implement survey when they go to school. A total of 250 surveys were distributed.
The appropriate materials was submitted (Student Opinion Survey instrument, procedures used in data collection, and reporting procedures) to the MA and IMBA department seeking approval to conduct the survey before any data is collected. Some steps to collect data includes: (1) receiving MA/IMBA approval; (2) e-mailing the initial survey instrument; (3) collecting and organizing survey responses; and (4) reviewing the survey responses for completeness.
20
3.4 Measures
Regression analysis is used to test the conceptual framework, and factor analysis is the multivariate analysis concerned with the internal relationships of variables (Stewart, 1981), used to:
(1) Minimize the number of variables.
(2) Find out qualitative and quantitative data distinctions when the data is too large. (3) Test hypotheses about the number of factors underlying a set of data.
3.5 Data Analysis
This paper uses the SPSS and Excel software running data and also use reliability test to pick up a robust and valid result.
Frequency analysis finds out sample distribution breakdown, means and standard deviations to indicate convergence levels or dispersion of respondent regarding statements related to the measurement of service quality standards and student satisfaction.
Regression test uses for indicating the relationship between independent variables and dependent variables (Hypotheses).
Reliability analysis uses for ensuring the instrument reliability of Cronbach's alpha coefficient.
Chapter 4 Result and Discussion
The research indicate student satisfaction with university services and environment at one university located in Kaohsiung city, Taiwan, with the purpose of providing popular service quality, positively effecting student satisfaction, and attaining learner loyalty. This chapter consists of data collection, results of data analysis and are showed in sequence.
The data collected from OICA office at the university, over a three-week period from March 01-20, 2017. Of the 250 students selected to complete the survey, there is nearly 4% of incomplete or unsuitable respondents.
4.1 Descriptive Analysis
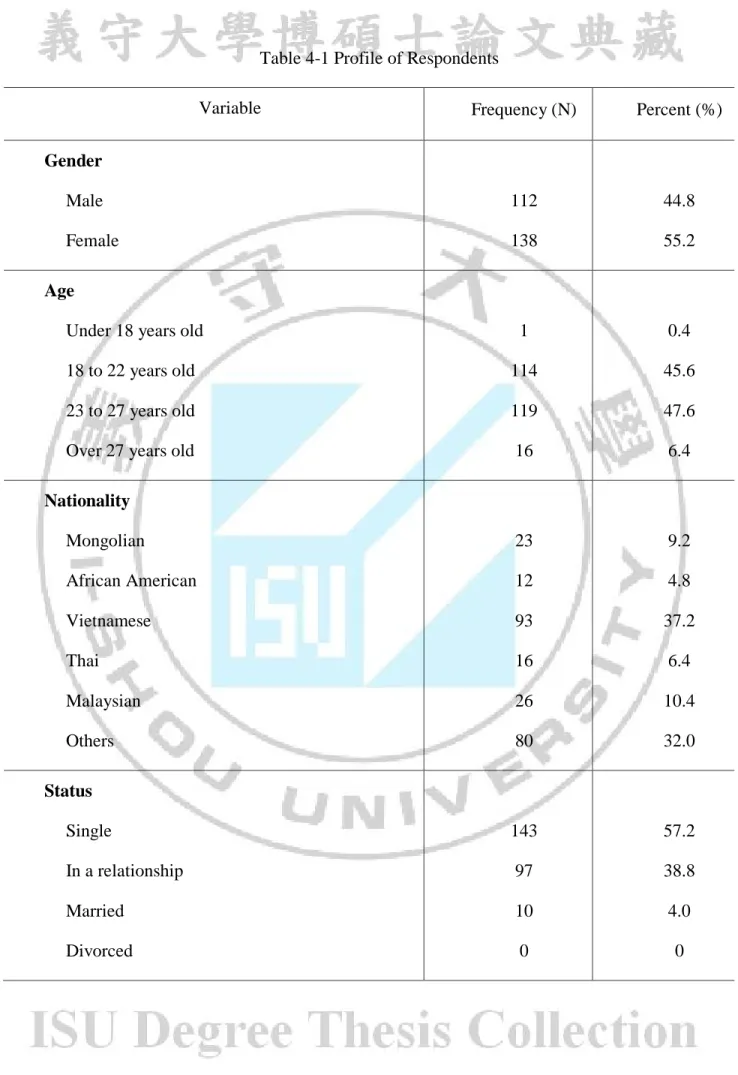
The demographic information contains the following participants’ characteristic: gender, age, nationality, status, purpose of enrolling university, status of enrolment (full-time/part-time), educational level, financial- aid. The demographics information is showed in Table 4-1 based on frequency distributions and percentages. Those 250 respondents in this survey, 112 (44.8%) are male and 138 (55.2%) are females. The calculated mean age of the respondents is 19-27 years old with the majority of the students being 23-27 years old (47.6%). Most of the students are Vietnamese (37.2 %) followed by the others (Taiwanese, Chinese)_(32 %), and the majority purpose for enrolling into university to obtain a professional degree (31.2%) with the full-time courses (83.6%) which was supported financial aid by university (62%).
22
Table 4-1 Profile of Respondents
Variable Frequency (N) Percent (%)
Gender Male Female 112 138 44.8 55.2 Age
Under 18 years old 18 to 22 years old 23 to 27 years old Over 27 years old
1 114 119 16 0.4 45.6 47.6 6.4 Nationality Mongolian African American Vietnamese Thai Malaysian Others 23 12 93 16 26 80 9.2 4.8 37.2 6.4 10.4 32.0 Status Single In a relationship Married Divorced 143 97 10 0 57.2 38.8 4.0 0
Purpose of Enrolling
To take a few job-related courses To obtain associate degree To take a few new courses To obtain a professional degree
To take courses necessary for transferring to another university
To obtain or maintain a certification
To obtain higher degree for self-improvement Others 30 26 41 78 10 19 27 19 12.0 10.4 16.4 31.2 4.0 7.6 10.8 7.6 Enrollment Status Full-time course Part-time course 209 41 83.6 16.4
Educational level obtained before
High school 2 years college 3 years college 4 years university
Graduated or professional college Others 69 27 39 100 11 4 27.6 10.8 15.6 40.0 4.4 1.6 Financial aid Yes No 155 95 62.0 38.0
24
Table 4-2 Descriptive Statistic of Measure: Means and Standard Deviations of Questionnaire Statements
Constructs N Mean SD
Service Quality
1. The curriculum in this university is always up to date. 2. The staffs in this university are friendly and courteous.
3. The attitude of the staffs in this university toward student is good. 4. The staffs in this university are willing to give students individual
attention.
5. The staffs in this university sincere interest in solving student's problems.
6. The staffs in this university have enough knowledge on rules and procedures.
7. The staffs in this university are capable to solve problems when they arise. 250 250 250 250 250 250 250 3.54 4.16 4.13 3.80 3.68 3.61 3.63 0.64 0.725 0.735 0.760 0.712 0.663 0.751 Teaching Quality
8. The lecturers used collaborative groups/teams in their teaching framework.
9. The lecturers in this university are sympathetic and supportive to the needs of students.
10. The lecturers encouraged students to ask questions.
11. The lecturers challenged students to understand ideas and concepts. 12. The lecturers provided assignment that required students to think
creatively and critically.
13. Lecturers are capable to solve problems when they arise. 14. Lecturers treated students fairly in this university.
15. Number of courses offered in this university is suitable for students.
250 250 250 250 250 250 250 250 4.28 4.08 3.98 3.94 3.91 3.88 4.10 3.44 0.725 0.724 0.688 0.706 0.706 0.729 0.759 0.775
Learning Environment Quality
16. Generally, the condition of building and facility in this university is
good.
17. Study areas in this university are well equipped.
18. The library has an extensive collection available (e.g. books, periodicals).
19. This university provides enough dormitory for students to rent.
20. Campus bookstore provides enough book, materials, and lectures to meet the needs of students.
21. Laboratory facilities in this university are well equipped. 22. Classroom facilities in this university are well equipped. 23. Athletic facilities in this university are well equipped. 24. Dormitory facilities in this university are well equipped.
250 250 250 250 250 250 250 250 3.25 3.24 3.62 3.22 3.21 3.06 3.01 2.95 0.674 0.720 0.824 0.740 0.748 0.836 0.905 0.854 Student Satisfaction
25. I am satisfied with my decision to attend this university. 26. I am happy that I enroll in this university.
27. I did the right decision when I decided to enroll in this university. 28. My choice to enroll in this university is a wise one.
29. If I have a choice to do it all over again, I still will enroll in this university. 250 250 250 250 250 3.65 3.64 3.24 3.05 2.87 0.703 0.663 0.758 0.812 0.896 Perceived Value
30. Students possess the knowledge that the course intended to impart. 31. Students possess the skills that the course intended to impart.
32. The course offered in this university challenged students intellectually. 33. The university prepares students to deal with the labor market after
graduation
34. The course offered in this university contains sufficient practical applications.
35. Students have become more professional after studying in this university. 250 250 250 250 250 250 3.62 3.58 3.54 3.40 3.38 3.24 0.612 0.655 0.671 0.712 0.617 0.680 Outcome Quality
26
37. Students have gained knowledge and skills to enter a particular career. 38. Students had an excellent learning experience in this university.
39. Students have gained transfer of knowledge and skills to obtain their first job.
40. Students have achieved the expected grades.
41. Students have become more competent in the field of study selected.
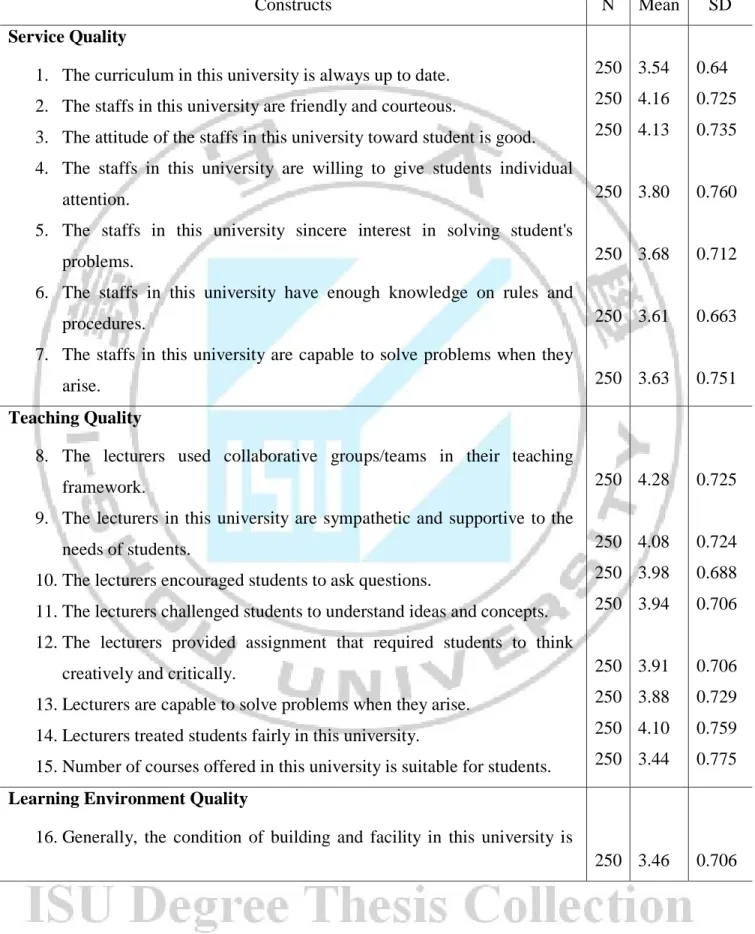
250 250 250 250 250 3.64 4.08 3.60 3.50 3.36 0.607 0.834 0.620 0.623 0.626 The first research question investigated the relationship between the service quality, teaching quality, learning-environment quality and student satisfaction, perceived value and outcome quality which were shown in table 4-2 by result of descriptive analysis.
Based on result from table 4-2 indicating that although heavily utilized, students was not satisfied with the learning environment quality with the lowest mean score was “Dormitory facilities in this university are well equipped” (mean=2.95; sd=0.854), this may be because of perception of students is a lack of furniture or dis-comfortable. However, of the two highest scores for service quality was “the staffs in this university are friendly and courteous” (mean=4.16; sd=0.725), and “The attitude of the staffs in this university toward student is good (mean=4.13; sd=0.735), for the teaching quality was “the lecturers used collaborative groups/teams in their teaching framework” (mean=4.28; sd=0.725), and “The lecturers in this university are sympathetic and supportive to the needs of students” which mean that students satisfied with the staff service provide and teaching methods, experiences, knowledge, skill of lecturers.
For the outcome quality, the item "students have developed the ability to function as a member of a team” score the highest (mean=4.08; sd=0.865).
Thus, the unremitting improvement for many higher educational institutions which always balance the implemental mix of courses offered, departmental service, adequate infrastructure or facilities in order to the learner able to finish studying on schedule time.
That is also the best way to increase student satisfaction, because a few small items can also effect to their feeling that indicated in table 4-2 of the statement “ If I have a choice to do it all over again, I still will enroll in this university” (mean=2.87; sd=0.896) was very low.
4.2 Factor Analysis and Reliability
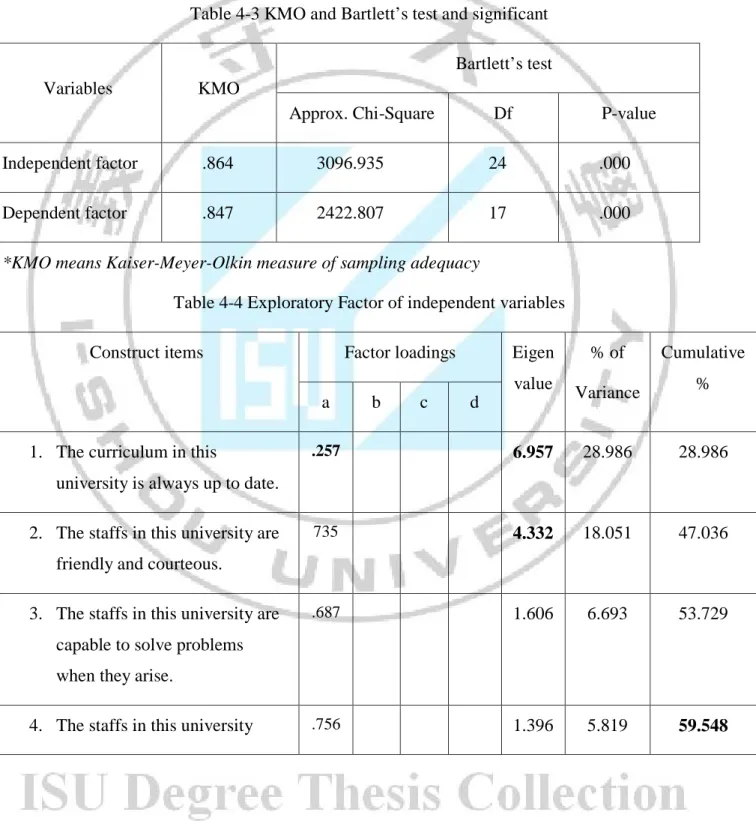
Using the results of KMO coefficient and Bartlet trial to determine the collected data suitability (the independent factors affect to the dependent factors) that shows in table 4-3 below.
The level of measure of sampling adequacy was greater than 0.75 indicating that the collected data situation was good for factorial analysis.
Table 4-3 KMO and Bartlett’s test and significant
Variables KMO
Bartlett’s test
Approx. Chi-Square Df P-value
Independent factor .864 3096.935 24 .000
Dependent factor .847 2422.807 17 .000
*KMO means Kaiser-Meyer-Olkin measure of sampling adequacy
Table 4-4 Exploratory Factor of independent variables
Construct items Factor loadings Eigen value % of Variance Cumulative % a b c d
1. The curriculum in this
university is always up to date.
.257 6.957 28.986 28.986
2. The staffs in this university are friendly and courteous.
735 4.332 18.051 47.036
3. The staffs in this university are capable to solve problems when they arise.
.687 1.606 6.693 53.729
28 sincere interest in solving
student's problems.
5. The staffs in this university are willing to give students
individual attention
.702
6. The staffs in this university have enough knowledge on rules and procedures.
-.034
7. The attitude of the staffs in this university toward student is good.
.681
8. The lecturers used
collaborative groups/teams in their teaching framework.
.829
9. The lecturers in this university are sympathetic and supportive to the needs of students.
.810
10. The lecturers encouraged students to ask questions.
.644
11. The lecturers challenged students to understand ideas and concepts.
.510
12. The lecturers provided assignment that required students to think creatively and
critically.
13. Lecturers are capable to solve problems when they arise.
.649
14. Lecturers treated students fairly in this university.
.612
15. Number of courses offered in this university is suitable for students.
.599
16. Generally, the condition of building and facility in this university is good.
.686
17. Study areas in this university are well equipped.
.767
18. The library has an extensive collection available (e.g. books, periodicals).
.758
19. This university provides enough dormitory for students to rent.
.676
20. Campus bookstore provides enough book, materials, and lectures to meet the needs of students.
.711
21. Laboratory facilities in this university are well equipped.
22. Classroom facilities in this university are well equipped.
.808
23. Athletic facilities in this university are well equipped.
.794
24. Dormitory facilities in this university are well equipped.
.699
Note: (1) Total variance explained = ; (2) KMO = .846; (3) Extraction method: Principal Component Analysis; (4) Rotation Method Varimax with Kaiser Nomalization
a: Service quality; b: teaching quality; c: environment quality; d: another factor
The independent variables included 24 items with the KMO value is .864 and p-value = 000 < 05, by using Principal Component Analysis and Varimax rotation method, the total variance explained was 59.548% > 50% (at component 4 and Cumulative %), this rate passed the percentage of variance allowance (>50%). Based on the study of Factor loading (Hair & Ctg, 1998, Multivariate Data Analysis, Prentice-Hall International) proved that: Factor loading > 0.3 (minimum), Factor loading > 0.4 (important), Factor loading > 0.5 (significant). Moreover, exploratory factor analysis that its Factor loading is greater than 0.5. Thus, from the result in table 4-4 the factor loading of the four items (1), (6), (14), (19) was less than 0.5 or greater than 0.5 but they were not the items in one of the factors of independent variables that mean there were only 20 significant items of independent variables (service quality: 5, teaching quality: 7, environment quality: 8)
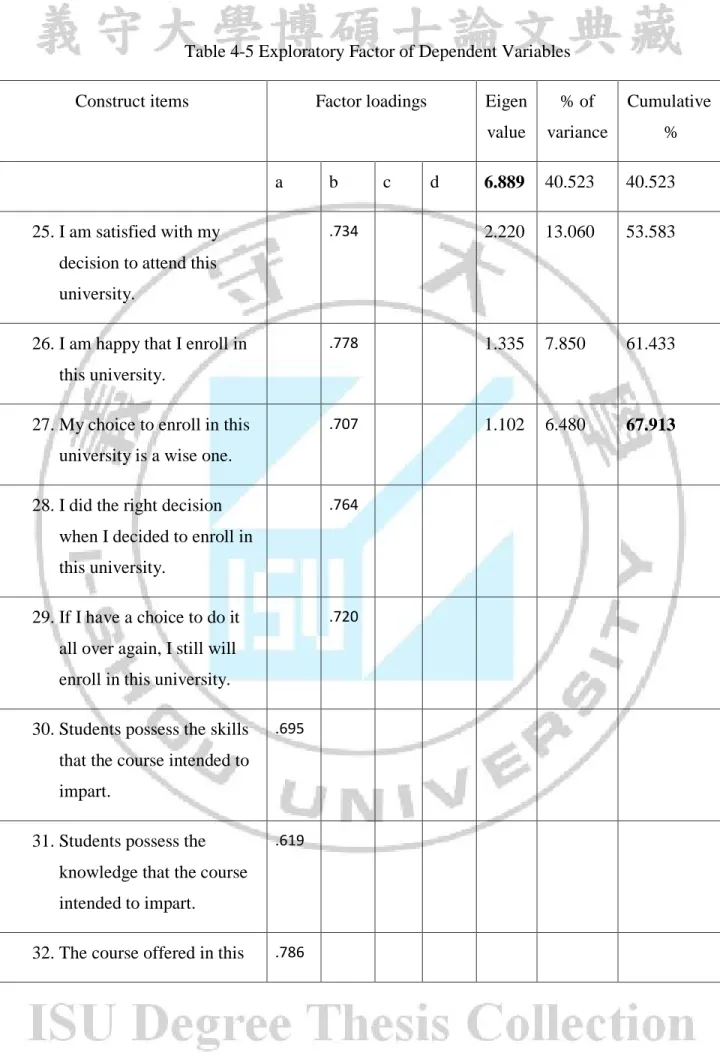
Table 4-5 Exploratory Factor of Dependent Variables
Construct items Factor loadings Eigen value % of variance Cumulative % a b c d 6.889 40.523 40.523 25. I am satisfied with my
decision to attend this university.
.734 2.220 13.060 53.583
26. I am happy that I enroll in this university.
.778 1.335 7.850 61.433
27. My choice to enroll in this university is a wise one.
.707 1.102 6.480 67.913
28. I did the right decision when I decided to enroll in this university.
.764
29. If I have a choice to do it all over again, I still will enroll in this university.
.720
30. Students possess the skills that the course intended to impart.
.695
31. Students possess the knowledge that the course intended to impart.
.619
32 university contains
sufficient practical applications.
33. The university prepares students to deal with the labor market after graduation.
.684
34. Students have become more professional after studying in this university.
.773
35. The course offered in this university challenged students intellectually.
.614
36. Students have gained knowledge and skills to enter a particular career.
.578
37. Students have gained transfer of knowledge and skills to obtain their first job.
.527
38. Students had an excellent learning experience in this university.
.755
39. Students have become more competent in the field of study selected.
40. Students have achieved the expected grades.
.816
41. Students have developed the ability to function as a member of a team.
.640
The dependent variables included 17 items with the value of KMO is .847 and p-value = .000< .05, by using Principal Component Analysis and Varimax rotation method, the total variance explained was 67.913%% > 50% (at component 4 and Cumulative %), this rate passed the allowance of percentage of variance (>50%). From the result in table 4-5 the factor loading of the item (38) was greater than 0.5 but it was not the items in one of the factors of independent variables that mean there were only 16 significant items of independent variables (student satisfaction: 5, perceived value: 6, outcome quality: 5)
4-6 Statistic of Measure
Variable name N No. of item Means SD
Service quality Teaching quality
Learning environment quality
250 250 250 5 7 8 3.87 3.93 3.17 0.57 0.52 0.58 Student satisfaction Perceived value Outcome quality 250 250 250 5 6 5 3.29 3.46 3.64 0.60 0.51 0.51 Total 250 36
34
In the table 4-6, it shows that the means of outcome quality is 3.64 on a 5-point scale, followed by mean of perceived value and student satisfaction was 3.46 and 3.29 on a 5-point scale. For each element of independents, teaching quality and service quality factor scores the highest (3.93 and 3.87 on a 5-point scale), followed by learning environment quality (3.17 on a 5-point scale). The student satisfaction minimum level is 1.00 showing that a few student felt not meet the expectation and the max score is 5.00 indicating some students satisfied what they received better than expected. Further information may see in the table 3.3 that the highest score of service quality and teaching quality which can be perceived by students are actually satisfied with somewhat about the staff service and lecturers’ knowledge, skill, experiences,…
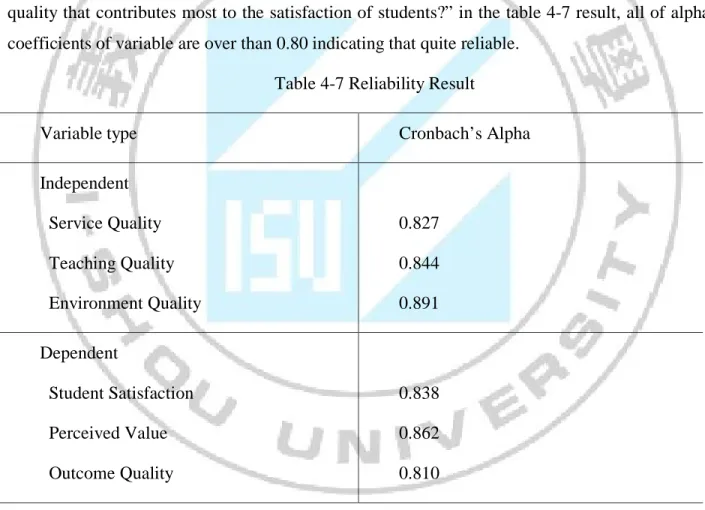
“What are the critical factors of service quality, teaching quality, learning environment quality that contributes most to the satisfaction of students?” in the table 4-7 result, all of alpha coefficients of variable are over than 0.80 indicating that quite reliable.
Table 4-7 Reliability Result
Variable type Cronbach’s Alpha
Independent Service Quality Teaching Quality Environment Quality 0.827 0.844 0.891 Dependent Student Satisfaction Perceived Value Outcome Quality 0.838 0.862 0.810
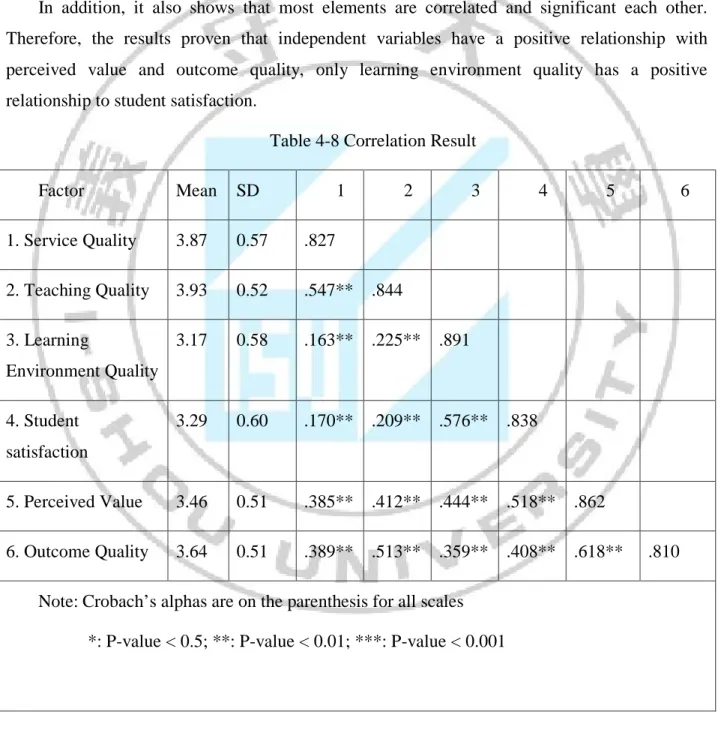
The relationship between these independent variables and dependent variables was showed in the table 4-8 result, it indicated that there are significant
Table 4-8 result prove that the relationship between service quality, teaching quality, learning environment quality to perceived value and outcome quality is positive. From the output, only learning environment quality has the positive relationship with student satisfaction (r=0.576) said that there is a strong relation. The relationship between service quality and student satisfaction is r=0.170 meaning that it has a moderate relationship toward student satisfaction as to teaching quality (r=0.209).
In addition, it also shows that most elements are correlated and significant each other. Therefore, the results proven that independent variables have a positive relationship with perceived value and outcome quality, only learning environment quality has a positive relationship to student satisfaction.
Table 4-8 Correlation Result
Factor Mean SD 1 2 3 4 5 6 1. Service Quality 3.87 0.57 .827 2. Teaching Quality 3.93 0.52 .547** .844 3. Learning Environment Quality 3.17 0.58 .163** .225** .891 4. Student satisfaction 3.29 0.60 .170** .209** .576** .838 5. Perceived Value 3.46 0.51 .385** .412** .444** .518** .862 6. Outcome Quality 3.64 0.51 .389** .513** .359** .408** .618** .810
Note: Crobach’s alphas are on the parenthesis for all scales *: P-value < 0.5; **: P-value < 0.01; ***: P-value < 0.001
36
4.3 Regression Analysis
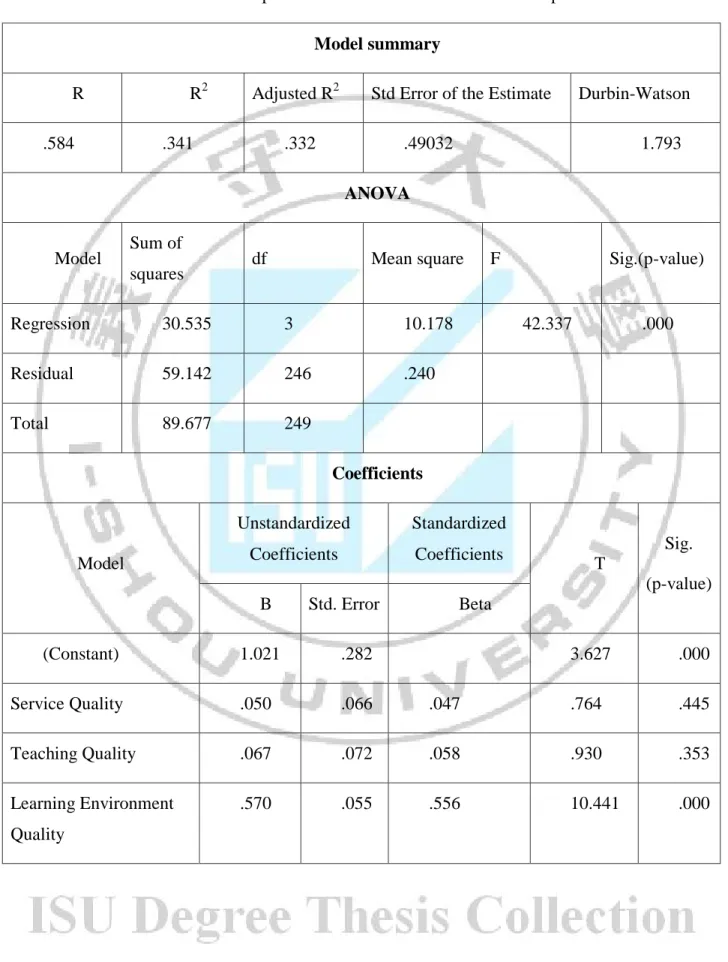
Table 4-9 The Relationship between Student Satisfaction and Independent Variables
Model summary
R R2 Adjusted R2 Std Error of the Estimate Durbin-Watson
.584 .341 .332 .49032 1.793
ANOVA
Model Sum of
squares df Mean square F Sig.(p-value)
Regression 30.535 3 10.178 42.337 .000 Residual 59.142 246 .240 Total 89.677 249 Coefficients Model Unstandardized Coefficients Standardized Coefficients T Sig. (p-value) B Std. Error Beta (Constant) 1.021 .282 3.627 .000 Service Quality .050 .066 .047 .764 .445 Teaching Quality .067 .072 .058 .930 .353 Learning Environment Quality .570 .055 .556 10.441 .000
In the table 4-9, the results show that R2=0.342 (adjusted R2=0.334), said that 34.2% of variance in outcome quality, followed by 34.1% of student satisfaction (R2=0.341; adjusted R2=0.332), 33% of perceived value (R2=0.330; adjusted R2=0.322) are explained by the independent items given in the output.
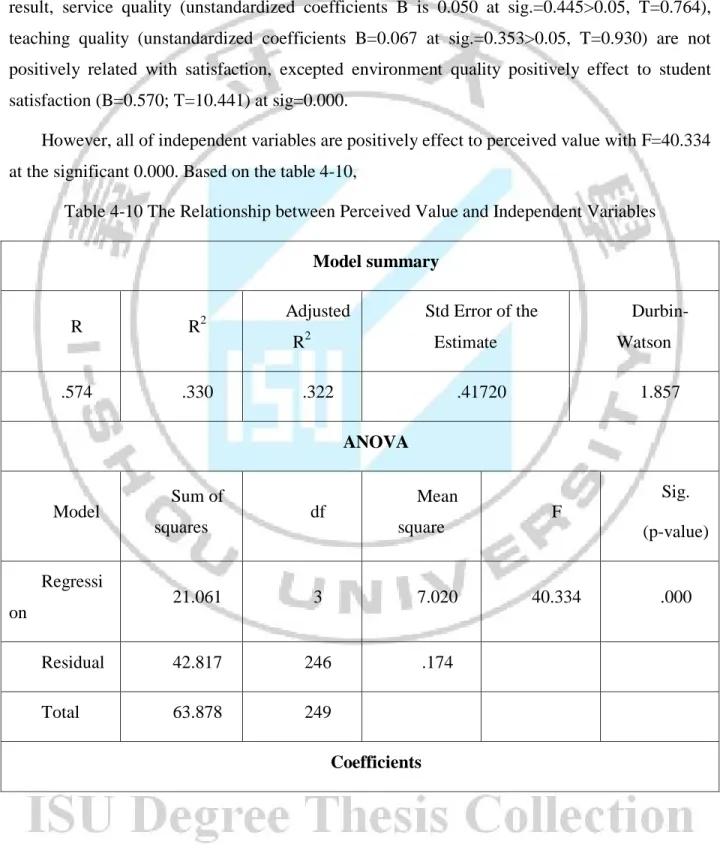
From the result, the F statistics produced (F=42.337) is significant at the 0.000. From this result, service quality (unstandardized coefficients B is 0.050 at sig.=0.445>0.05, T=0.764), teaching quality (unstandardized coefficients B=0.067 at sig.=0.353>0.05, T=0.930) are not positively related with satisfaction, excepted environment quality positively effect to student satisfaction (B=0.570; T=10.441) at sig=0.000.
However, all of independent variables are positively effect to perceived value with F=40.334 at the significant 0.000. Based on the table 4-10,
Table 4-10 The Relationship between Perceived Value and Independent Variables
Model summary R R2 Adjusted R2 Std Error of the Estimate Durbin-Watson .574 .330 .322 .41720 1.857 ANOVA Model Sum of squares df Mean square F Sig. (p-value) Regressi on 21.061 3 7.020 40.334 .000 Residual 42.817 246 .174 Total 63.878 249 Coefficients
38 Model Unstandardized Coefficients Standardized Coefficients T Sig. (p-value) B Std. Error Beta (Constant) .915 .240 3.817 .000 Service Quality .186 .056 .208 3.324 .001 Teaching Quality .212 .062 .218 3.442 .001 Learning Environment Quality .312 .046 .361 6.725 .000
Service quality (B=0.186; T=3.324) at sig=0.001, teaching quality (B=0.212; T=3.442) at sig=0.001, environment quality (B=0.312; T=6.725) at sig=0.000.
Table 4-11 The Relationship between Outcome Quality and Independent Variables
Model summary
R R2 Adjusted R2 Std Error of the
Estimate Durbin-Watson
.585 .342 .334 .41574 1.857
ANOVA
Model Sum of
squares df Mean square F Sig.(p-value)
Regression 22.076 3 7.359 42.575 .000
Residual 42.520 246 .173
Coefficients Model Unstandardized Coefficients Standardized Coefficients t Sig. (p-value) B Std. Error Beta (Constant) .974 .239 4.079 .000 Service Quality .138 .056 .154 2.490 .013 Teaching Quality .365 .061 .372 5.939 .000 Learning Environment Quality .218 .046 .250 4.703 .000
And the table 4-11 result, teaching quality (B= 0.365; T=2.490) at sig=0.000, environment quality (B=0.218; T=4.703) at sig=0.000, service quality (B=0.138; T=4.079) at sig=0.013 are positively related to outcome quality.
From those result, it is apparent that learning environment quality significant and positively effects more than the other dimensions (service quality and teaching quality). It means learning environment quality is the main dimension that supports most to students’ satisfaction. Further, the teaching quality is the factor also positively effects to perceived value and outcome quality.
“How do student vote the implementation of the standard of service quality, teaching quality, learning environment quality among student at the university?”
Overall, table 4-2 shows that student satisfaction with service quality was at medium levels when exploring the relation of service quality criterion and learner satisfaction. But from the teaching quality and learning environment quality provided student also gained high outcome and satisfied with the learning environment. Because both the independent and dependent variables are quantitative, simple linear regression analysis was used.
The regression analysis results demonstrate that the correlation coefficient (R is more than 0.57) indicates there is a positive relation of service quality, teaching quality, learning
40
environment quality and satisfaction, perceived value, outcome quality. Additionally, it shows that (R ² more than 0.325), proving that service quality represented 32.5% of student satisfaction change with a possible error less than 0.05. So, some others factor that influence student satisfaction here. Moreover, the significance of (F) value is less than or equal to 0.05. From those, posited that the service quality influence student satisfaction at medium levels.
These results are consistent with the previous papers that there is an influence of university services on student satisfaction. It also confirmed that the perceived value positively interact to student expectation from the university services.
Based on results of hypotheses test were formulated in the table 4-12 to answer this question. The t-calculated values are greater than the tabulated values, and the hypotheses p-value is less than 0.05 (except H1 and H7). These results lead to the conclusion that the services in university are implementing medium-level quality university services.
Table 4-12 Summary of study Hypotheses’ test Result
No. Hypothesis Result
H1 Service quality positively affects student satisfaction Not Supported
H2 Service quality positively affects student’s perceived value Supported
H3 Service quality positively affects student’s outcome quality Supported
H4 Learning environment quality positively affects student satisfaction Supported
H5 Learning environment quality positively affects student’s perceived value
Supported
H6 Learning environment quality positively affects student outcome quality
Supported
H7 Teaching quality positively affects student satisfaction Not Supported
H8 Teaching quality positively affects student’s perceived value Supported