Using Balanced Scorecard and System Dynamics in Exploring
the Performance of Taiwan’s Pharmaceutical Industry
Ting Lin Lee1, Shu-Juan Yang2
Department of Asia-Pacific Industrial and Business Management, National University of Kaohsiung, Kaohsiung 811, Taiwan
Abstract
“Balanced Scorecard (BSC)” is one of the popular performance measure methods which can translate the strategy into a set of clear performance indicators and manage the status of implementing the strategy. However, BSC is unable to simulate the complicated environment, to be short of the strategy’s simulation, and usually used on business unit level, only few studies have ever tried to use it on other levels.
Therefore, this study tries to combine BSC with SD to explore Taiwan’s pharmaceutical industry that had formulated the relevant strategy of development since 1982 but its contribution is still limited at present. Based on four perspectives of BSC, the related indicators will be conducted. Mainly, the purpose of this study is to investigate and build the complex system of Taiwan’s pharmaceutical industry, and amend the policy direction to enhance its performance.
This paper not only integrates the research tools and gives the suggestions to improve the performance of this industry, but also assists Taiwan in becoming a R&D, manufacturing and operations center in Asia-Pacific region in the future.
Keywords:Balanced Scorecard, System Dynamics, Pharmaceutical Industry
Ⅰ. INTRODUCTION
Although the development of Taiwan’s pharmaceutical industry is later than America and Europe, it's earlier than the emerging countries. On the other hand, because of near to the third-largest market “China”, Taiwan not only owns an important advantage of location in developing pharmaceutical, but also plays an important role between the developed
and developing countries. By the help of the government, the pharmaceutical industry had been developed since 1982, and the civil societies also invest heavily and to promote this industry. However, the contribution of this industry is still limited at present in Taiwan. Thus, over the past few years a considerable number of studies have been made on the performance of the pharmaceutical industry in Taiwan.
According to “2010 White Paper on the biotechnology industry in Taiwan”, among the Asian countries, Singapore, South Korea, China, and India have been most successful in developing biotechnology, and retain double-digit biotech industry sales growth in ever year, yet Taiwan's biotech industry had total sales revenue of NT$210.5 billion in 2009, which represented growth of only 5% compared with 2008. Within the biotech sector as a whole, the pharmaceutical industry grew at a rate of only 1% [1]. This result shows that pharmaceutical industry still needs to reinforce in Taiwan.
Since Robert S. Kaplan and David Norton proposed the concept “Balanced Scorecard” (BSC), it has been one of the most popular performance measure methods and also a strategic management approach. By this method, the organizational strategy can be translated into a set of clear performance indicators, and then to measure and manage the status of implementing the strategy. An organization that has strategies but always lacks the executions needs BSC. Taiwan’s pharmaceutical industry that had formulated the relevant strategy and objective of development since 1982 but still didn’t be developed to the best conditions is occurring the same problem.
In general, BSC is usually used on the business unit level, and only few studies have ever tried to use it to analyze the performance of an industry of national development. Nevertheless, Science &
Technology Policy Research and Information Center (STPI) point out that if use the concept of enterprise to promote to the industry, or the national level tool is applied to the enterprise level, it will help business and government to be more clearly to carry out the strategic planning and policy planning [2]. Thus, the author attempts to use BSC on the industry level.
Furthermore, some literatures showed that the BSC theory and practice had some limitations. The root of limitations is “cause and effect are not closely related in time and space” [3]. Although BSC is static, one-way causality link from bottom to top, unable to simulate the complicated environment and also fail to judge and certify the influence of events’ time-delay, but System Dynamics s can make up its deficiency [3, 4]. As a result, the authors also try to take BSC and SD as the research methods to investigate and model the complex structure, behavior and performance in the pharmaceutical industry in Taiwan.
The purpose of this study is to attempt to combine BSC with SD to explore the complex system and performance about the pharmaceutical industry in Taiwan, and then try to amend the policy direction of this industry to enhance the performance in Taiwan. Our concerns are to report four objectives:
1. Based on four perspectives of BSC, to find the related indicators of the development to build the dynamic
structure in this industry.
2. Mapping the stocks and flows diagram to simulate and analysis the development of this industry in Taiwan, then
3. Finding the key decision points which actually affect the performance of this industry in Taiwan.
4. According to the result of the policy testing to give the suggestions of amending the policy direction of this industry and then to enhance the performance in Taiwan.
Ⅱ. OVERVIEW OF TAIWAN’S
PHARMACEUTICAL INDUSTRY
According to Industrial Development Bureau, Ministry of Economic Affairs in Taiwan, the pharmaceutical industry includes drug substance, western medicine, and Chinese herbal medicine. And the Law of Pharmaceutical Affairs which is the basis for market regulation defines the pharmaceutical industry as: “The pharmaceutical manufacturers in this law are meant the manufacturers who operate the manufacturing and working of drugs, products wholesale and export, and importation of raw materials for own use.” Therefore, the author considers that the pharmaceutical industry includes drug substance, western medicine, Chinese herbal medicine and their related industries and products.
Important Development Projects
Since 1982, Taiwan’s government identifies biotechnology as one of the eight key technologies, Academia Sinica set up the preparation office for the Molecular Biological Research Institute and the Biomedical Research Institute. In 2002, Executive Yuan reviewed and approved the Challenge 2008 six-year (2002-2007) national development plan, and then proposed a project named “Two Trillion Twin Star (2T2S) plan” to promote the pharmaceutical industry. Among these six years, the government had started to promote the more perfect plans of science and technology, enhance the laws and regulations about pharmaceutical industry, and build the related institutions and systems, such as the information network about drug regulations and clinical trial, research centers and experimental centers [5].
On the subjects of growing population, serious aging problem and an unspectacular growth rate in the emerging countries’ drugs market, the government included the biotechnology industry in “Six Key Emerging Industries”, and started a plan, “Diamond Action Plan for Biotech Takeoff” in 2009. The purpose of these plans is let government play an active role to invest and build the based environment, and then guide private investment funds to invest in the most efficient target with the help of venture capital experts.
Domestic Market Summary
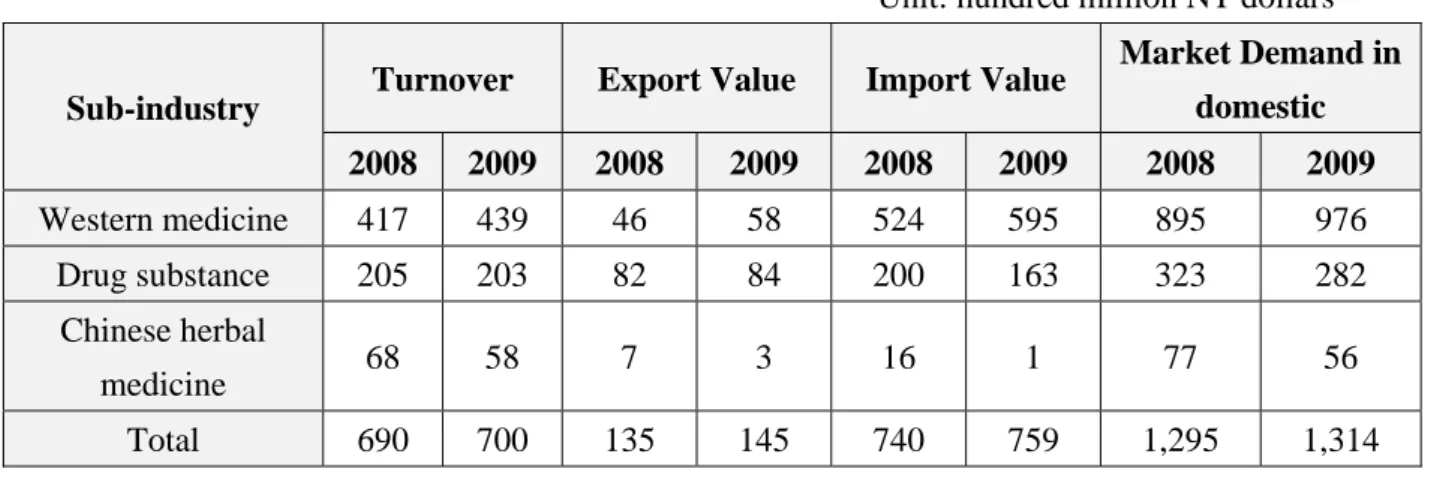
According to the report from Business-Monitor-International in 2010, Taiwan’s US$3.81 bn pharmaceutical market is the sixth largest in Asia Pacific. Annual per-capita spending on medicines is US$165, just above the regional average of US$142 [6]. In Taiwan, the turnover of pharmaceutical industry is up to NT$70 billion in 2009, and the scale of western medicine is the biggest among
this industry (Table 1). However, this table tells us that this industry grew at a rate of only 1% from 2008 to 2009 and export value was much less than import value. This reason is that the pharmaceutical market is dominated by foreign multinational firms selling patented medicines for chronic conditions. Although local drug markets specialize in generic medicines, they are increasingly engaging in original research to move up the value chain [6].
Table 1: Output value of the pharmaceutical industry in 2008 and 2009
Unit: hundred million NT dollars
Sub-industry Turnover Export Value Import Value
Market Demand in domestic 2008 2009 2008 2009 2008 2009 2008 2009 Western medicine 417 439 46 58 524 595 895 976 Drug substance 205 203 82 84 200 163 323 282 Chinese herbal medicine 68 58 7 3 16 1 77 56 Total 690 700 135 145 740 759 1,295 1,314 Source: [1]
The Direction of Development
According to “Diamond Action Plan for Biotech Takeoff”, “National Science and Technology Program for Biotechnology and Pharmaceuticals (NSTPBP)” and “2010 White Paper on the biotechnology industry in Taiwan”, this study integrate the visions, strategies and objects about the development of Taiwan’s pharmaceutical industry:
• Vision:
Establish Taiwan as an important part of
international biotechnology community development and commercialization and assist Taiwan in becoming a R&D, manufacturing and operations center of biotechnology in Asia-Pacific region.
• Strategy:
1. Strengthen the role of R & D in this industry’s value chain; focus on the industrial application development of R & D results, and help the research result smoothly transfer to industry.
2. Continue to promote the output of successful investment cases in
biotechnology industry.
3. Integrate the limited sources and the channel of communication to promote the co-operation among industry, government, academic and the institute, and then form a virtual R & D team of efficiency to contribute to the output of domestic drugs.
4. Shorten the time to market, build a good investment measures and environmental, and establish an alliance about drug export to expand domestic and foreign markets.
• Objective:
1. The turnover of the biotechnology industry average growths 25% per year in the next 5 years and drive 150 billion investments (From 2003 to 2007).
2. Increase R&D contribution in the field of biotechnology to some 3% of GDP by 2014.
3. Increase the annual output value of biotech industry to more than TWD1trn in four years (2010~2014).
Ⅲ. LITERATURE REVIEW
Balanced Scorecard (BSC)
Since Kaplan and Norton published their first article on the balanced scorecard, “The Balanced Scorecard: Measures that Drive Performance” in 1992, this concept has been one of the most important management innovations of the 20th
century. The traditional performance measurement methods are almost focused on the financial perspective, thus most companies place on short-term financial measures leave a gap between the development of a strategy and its implementation [7]. There is a characteristic of time-delay for many strategies to bring the results, take the pharmaceutical industry for example. It is a long-term action to invest in the drug development: 10-15years on average. Because the results brought by the investment project could not show on the financial statements instantly, these investments are always treated as the expense item.
Different from the traditional methods, the balanced scorecard supplemented traditional financial measures with criteria that measured performance from three additional perspectives – those of customers, internal business processes, and learning and growth [7]. According to Kaplan and Norton (1996a), the balanced scorecard is including four perspectives and there are four processes to design and implement the scorecard. The next section, we will introduce these perspectives and the relationship between these perspectives.
Four Perspectives
Because the balanced scorecard is directly linked to mission and strategy, the relevant components and measures will vary across organizations depending on
their specific goals and circumstances [8]. However, no matter at a common or conceptual level, most of people accept the representative balanced scorecard including at least four perspectives proposed by Kaplan and Norton (1992). The four perspectives of the BSC are as followed:
• Learning and Growth:
An organization’s ability to innovation, learning, and improvement implicates directly to the organization’s value [9]. Organizational learning and growth come from three principal sources: people, systems, and organizational procedures [10]. They are the drivers of success for the financial, customer, and internal business process objectives.
In this dimension, the staffs’ competence, technological structure, and culture must be clarified, then the organization will be able to adjust the human resources and information technology to act in concert with the mission and strategy [11].
• Internal Business Processes:
Customers’ concerns tend to fall into four categories: time, quality, performance and service, and cost [9]. This perspective asks what must be done internally to meet and exceed the customers’ need [12]. Thus, the internal measures for the balanced scorecard should stem from the business processes that have greatest impact on customer satisfaction [9].
According to Kaplan and Norton’s report (1996b), the internal business processes include three parts: innovation cycle – the long-wave of value creation, operations cycle – the short-wave of value creation, and post-sale service cycle – the middle-wave of value creation. Therefore, a comprehensive strategy should be pursued at these parts in the overall improvement of internal processes, and then to generate the revenue [11].
• Customer:
The purpose of this perspective is to measure the organization’s ability to achieve overall customer satisfaction. No matter the measures chosen are general, such as those focusing on customer value, and customer retention, or they are specific addressed a dimension of customer value such as product and service quality, response time, flexibility, or cost, they should capture customer opinion [12].
To put the balanced scorecard to work, organizations should articulate goals for what customers’ concerns and then translate these goals into the core outcome measures [9]. Kaplan and Norton (1996b) consider that the core outcome measures include customer satisfaction, customer retention, new customer acquisition, customer profitability, and market and account share in targeted segments.
Based on the above three dimensions, this perspective is focused on the ability to make profit; it includes measures such as operating income, revenue growth, cost reduction, asset utilization and economic value added [13, 14]. On the other hand, it also indicates whether the strategy, implementation, and execution are contributing to bottom-line improvement [9].
At the different stage of the life cycle, an organization should development different financial indicators to link with its different strategical goals. Kaplan and Norton (1996b) take an example to show how the balanced scorecard can be used to make explicit the financial strategy of a business unit, and how to customize financial objectives and measures to business unit strategy.
Cause and Effect Relationships
A strategy is a set of hypotheses about cause and effect [10]. The balanced scorecard links a series of strategies, objectives and measures that are both consistent and mutually reinforcing [10]. Thus, Kaplan and Norton (1996b) assume the balance scorecard is like a flight simulator, it should incorporate the
complex set of cause and effect relationships among the critical variables and feedback loops that describe the trajectory, the plan, and the strategy.
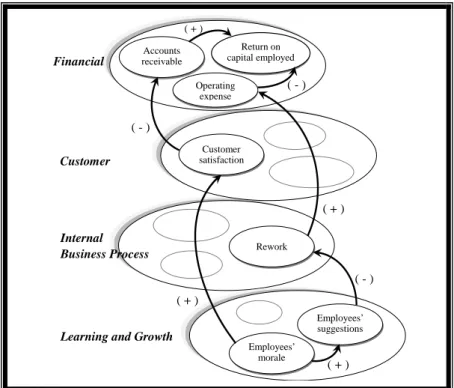
The chain of cause and effect should pervade all four perspectives of a balanced scorecard [10], and the relationship between these perspectives is: measures of
organizational learning and growth → measures of internal business processes → measures of the customer perspective → financial measures [15], see Figure 1.
Therefore, the learning and growth perspective is the root of the scorecard, and the measures of the learning and growth perspective are the drivers of internal business processes. Similarly, the measures of internal business processes are the drivers of customer perspective, and the drivers of financial measures come from the customer perspective [10, 15].
The emphasis on cause and effect in constructing a scorecard introduces dynamic systems thinking. It enables individuals in various parts of an organization to understand how the pieces fit together, how their role influences others and, eventually, the entire organization [16].
Employees’ suggestions Employees’ morale Rework Customer satisfaction Return on capital employed Operating expense Accounts receivable ( - ) ( - ) ( - ) ( + ) ( + ) ( + ) ( + ) Financial Customer Internal Business Process
Learning and Growth
Figure 1: How to linked measures from the four perspectives Source: Kaplan and Norton, 1996a
The Limitations of BSC
Although BSC contains outcome measures and the performance drivers of outcomes, linked together in cause-and-effect relationships, and thus aims to be a feed-forward control system [15]. Nevertheless, a number of inherent weaknesses have also been reported in the BSC literature [17]. These disadvantages are described below.
1. Cause and effect are not closely
related in time and space: BSC measures
cause and effect at the same time without considering any time lag, so it has no time dimension [15]. This limitation which is fail to judge and certify the influence of events’ time-delay causes the user focus on the short-term object and ignore the long-term influence [3].
2. Unidirectional causality too
simplistic: The use of causal-loops alone
is seen as problematic because these loops do not capture the notion of strategic factors accumulating and depleting [17]. Nørreklit (2000) even questions the existence of the one-way causality which only links from bottom to top between the areas of measurement in the BSC. This author believes that the relationship is more one of interdependence, or bi-directional causality [17].
System Dynamics (SD)
The theory of System Dynamics was developed in the late 1950s and early 1960s by Jay W. Forrester of the Massachusetts Institute of Technology (MIT). Forrester explains that SD is an approach which combines theories, methods, and philosophy needed to
analyze the behavior of systems. It can provide a common foundation that can be applied wherever we want to understand and influence how things change through time in not only management, but also in environmental change, politics, economic behavior, medicine, engineering, and other fields [18].
Coyle (1996) defines SD as a method that through qualitative and quantitative models to describe, design, and model robust information feedback structures and control policies through simulation and optimization. Coyle claims that managers can use System Dynamics to deal the time-dependent behavior of managed systems, and understand interrelationships among variables influence the behavior of the system over time [19, 20].
Sterman (2000) considers that learning about complex dynamic systems requires more than technical tools to create mathematical models. In addition to be grounded in the theory of nonlinear dynamics and feedback control developed in mathematics, physics, and engineering, SD also draws on cognitive and social psychology, economic, and other social sciences. Thus, SD is fundamentally interdisciplinary and very suitable to support managers to learn and understand complex systems [21].
Su (1988) describes System Dynamics s as a quantitative method that is based on the theory of feedback control
and takes the computer simulation as a mean to study the complex social and economic systems [22]. Han (2002) also emphasizes that the application of System Dynamics must be based on system thinking to build the system model, and takes the computer simulation as a mean to verify the system behavior. By this application, we can truly grasp the essence of System Dynamics, and then understand the superiority and uniqueness of System Dynamics [23].
According to the above description, we can know that System Dynamics which is based on the theory of nonlinear dynamics, system thinking and feedback control is a method to understand how things change and the influence over time. The framework of SD is focused on systems thinking, but takes the additional steps of constructing and testing a simulation model [20]. By applying computer simulation, SD can show how structure, policies, decisions and time delays within organizations and business systems are interrelated and influence growth and stability [24], and further help us to learn about dynamic complexity and the sources of policy resistance, and provide more effective policy suggestions [21].
. RESEARCH DE
Ⅳ SIGN
Research Framework
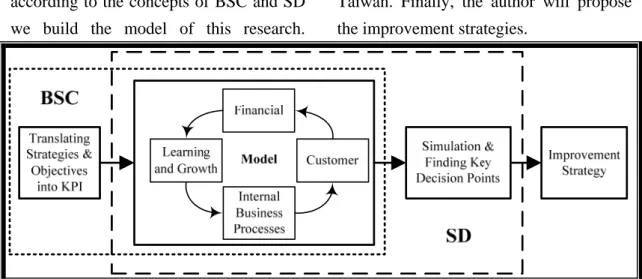
This study is distinguished in to four parts (Figure 2). Based on four
perspectives of BSC, the first section is translating strategies and objectives into KPI which is sorted out from literature review and expert interviews. Second, according to the concepts of BSC and SD we build the model of this research.
Sequentially, the author applies the computer simulation to find the key decision points which actually affect the performance of pharmaceutical industry in Taiwan. Finally, the author will propose the improvement strategies.
Figure 2: The conceptual structure of this research Source: This Study
Methodology - The Process of SD
Since Forrester (1961) proposing SD to now, there have been many kinds of SD modeling processes, but the main steps are almost the same. Here, the author uses the modeling process proposed by Sterman (2000) to provide a whole picture of the implementation of modeling real world problems.
1. Articulating the problem to be
addressed (Boundary Selection): In this
most important step, the modeler needs to select the theme or problem, identify key variables, decide the time horizon, and dynamic problem definition (reference modes);
2. Formulating a dynamic hypothesis
about the causes of the problem: The
modeler needs to generate the initial
hypothesis, explain the endogenous consequences of the feedback structure, and map boundaries, subsystems, causal loops, stock and flow diagrams, etc.;
3. Formulating a simulation model to
test the dynamic hypothesis: After
converting the causal loop diagram into the stock and flow diagram, the modeler should specify how the system description is translated into level, rate and auxiliary equations. The modeler also needs to illustrate the estimation of parameters, behavioral relationships, and initial conditions.
4. Testing the model until satisfied
that it is suitable for the purpose: In this
phase, the modeler should compare with reference modes, and examine the robustness and sensitivity under extreme conditions. Many other tests also must be
thorough and continuous testing to build confidence in the model.
5. Designing and evaluating policies
for improvement: This step is including
about scenario specification, policy design,
the effects of policies, sensitivity analysis, and interactions of policies. Because the real systems are highly non linear, the impact of combination policies is usually not the sum of their impacts alone.
Figure 3: Modeling is embedded in the dynamics of the system Source: [21]
The Variables of Four Dimensions
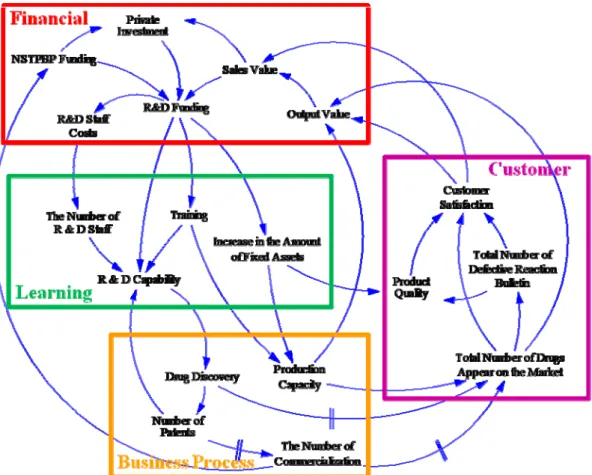
According to the related studies about the performance of the biotech and pharmaceutical industry, the author lists the relevant performance indicators and plots a causal loop diagram (Figure 4). This causal loop diagram is a draft, and the SD model is still being built.
Financial dimension: Select “Output Value”, “Sales Value”, “R&D Funding”, “Private Investment”, “NSTPBP Funding”, and “R&D Staff Costs” as variables.
Learning and growth dimension:
Select “The Number of R & D Staff”, “Training”, “R & D Capability”, and “Increase in the Amount of Fixed Assets” as the variables.
Internal processes dimension: Pick “Drug Discovery”, “Number of Patents”, “The Number of Commercialization”, and “Production Capacity”.
Customer dimension: Choose “Total Number of Drugs Appear on the Market”, “Total Number of Defective Reaction Bulletin”, “Customer Satisfaction”, and “Product Quality” as the variables.
Figure 4: The causal loop diagram of this study Source: This Study
. EXPECTED OUTCOMES
Ⅴ
In this study, we try to understand and find the reason that why the Taiwan’s government inputs time and money to pharmaceutical industry, but still doesn’t have good performance. The study results will reveal the key decision points by
applying System Dynamics. We hope the research results may help Taiwan to improve the performance of developing this industry, and also help Taiwan become the important role of developing this industry among the Asian countries in the future.
Reference
[1] Industrial-Development-Bureau, "2010 White Paper on the
biotechnology industry in Taiwan," M. Industrial Development Bureau, Ed.: Industrial Development Bureau, MOEA, 2010a.
[2] David, "National Innovation System,Intelligence Resources Planning and Balanced
Scorecard," Science &
Technology Policy Research and Information Center, 2008. [3] K. C. Tu, "A Study on Some
Dynamically Aligned Principles of the Balanced Scorecard Strategy in System Dynamics," in Business Management, vol. Ph.D. Kaohsiung: National Sun Yat-sen University, 2004. [4] L. H. Wu, "The research of the
strategy goal and the dynamic decision-making mechanism - W Electronics Corporation for example," in Information
Management, vol. Master.
Kaohsiung: National Sun Yat-sen University, 2005.
[5] Industrial-Development-Bureau, "Taiwan's Biotechnology Policy and Promotion Status." Taiwan: Ministry-of-Economic-Affairs. 2[6]
Business-Monitor-Internationa l, "Taiwan Pharmaceuticals & Healthcare Report - Q4 2010.,"
1748-2232, 2010.
[7] R. S. Kaplan and D. P. Norton,
"Using the balanced scorecard as a strategic management system,"
Harvard business review, vol. 74,
pp. 75- 85, 1996a.
[8] C. W. Chow, D. Ganulin, O.
Teknika, K. Haddad, and J. Williamson, "The balanced scorecard: a potent tool for energizing and focusing healthcare organization management," Journal of
healthcare
management/American College of Healthcare Executives, vol. 43,
pp. 263-280, 1998.
[9] R. S. Kaplan and D. P. Norton,
"The Balanced
Scorecard–Measures That Drive Performance," Harvard Business
Review, vol. 70, pp. 71-79, 1992.
[10] R. S. Kaplan and D. P. Norton, "Linking the balanced scorecard to strategy," California
management review, vol. 39, pp.
53-79, 1996b.
[11] R. S. Kaplan and D. P. Norton, "Having trouble with your strategy? Then map it," Harvard
business review, vol. 78, pp.
167-176, 2000.
[12] P. C. Brewer and T. W. Speh, "Using the balanced scorecard to measure supply chain
performance," Journal of
Business Logistics, vol. 21, pp.
[13] G. Bader, "Developing a measurement system for the pharmaceutical compliance process using the Balanced Scorecard," in Quality Assurance, vol. Master. Dominguez Hills: California State University, 2007.
[14] W. Y. Kuo, "The Evaluation Model for the Efficiency of the Achievement of Organization Objectives- Study on Software Industry.," in Department of
Information Management, vol.
Master of Business
Administration. Taipei: Tatung University, 2004.
[15] H. Nørreklit, "The balance on the balanced scorecard a critical analysis of some of its assumptions," Management
Accounting Research, vol. 11, pp.
65-88, 2000.
[16] R. S. Kaplan and D. P. Norton,
The balanced scorecard: translating strategy into action.
Boston: Harvard Business School Press, 1996c.
[17] H. Akkermans and K. Oorschot,
"Developing a balanced scorecard with system dynamics," Journal of the
Operational Research Society,
2002.
[18] J. W. Forrester, "System
dynamics and the lessons of 35
years," in The systemic basis of
policy making in the 1990s, K. B.
D. Greene, Ed. Boston: MIT, 1991.
[19] R. G. Coyle, System dynamics
modelling: A practical approach.
London: Chapman & Hall, 1996. [20] E. Suryani, "Demand Scenario
Analysis and Planned Capacity Expansion: a System Dynamics Framework," in Industrial
Management, vol. Ph. D. Taipei:
National Taiwan University of Science and Technology, 2010. [21] J. D. Sterman, Business
dynamics: Systems thinking and modeling for a complex world.
Boston: Irwin/McGraw-Hill, 2000.
[22] M. K. Su, The Principle and
Application of System Dynamics.
Shanghai: Shanghai Jiao Tong University, 1988.
[23] Z. Han, System Dynamics - The
Key to Explore the Dynamic Complexity. Taipei: Hwa Tai
Publishing, 2002.
[24] Y. L. Lee, "Dynamic analysis of National Innovation Systems Model - A Case Study of Taiwan's Integrated Circuit Industry," in Faculty of Social
Sciences and Law, vol. Ph. D.
Britain: University of Manchester, 2002.
![Figure 3: Modeling is embedded in the dynamics of the system Source: [21]](https://thumb-ap.123doks.com/thumbv2/9libinfo/7418978.105047/11.892.210.680.259.668/figure-modeling-embedded-dynamics-source.webp)