Kuo, Y. -F., Wu, C. -M. and Deng, W. -J. (2009), The relationships among service quality, perceived value, customer satisfaction, and post-purchased intention in mobile value-added services, Computers in Human Behavior, 25(4), pp.887-896.
The relationships among service quality, perceived value, customer satisfaction, and post-purchase intention in mobile value-added services
Abstract
The purposes of this study are to construct an instrument to evaluate service quality of mobile value-added services and have a further discussion of the relationships among service quality, perceived value, customer satisfaction, and post-purchase intention. Structural equation modeling and multiple regression analysis were used to analyze the data collected from college and graduate students of fifteen major universities in Taiwan. The main findings are as follows: (1) service quality positively influences both perceived value and customer satisfaction; (2) perceived value positively influences on both customer satisfaction and post-purchase intention; (3) customer satisfaction positively influences post-purchase intention; (4) service quality has an indirect positive influence on post-purchase intention through customer satisfaction or perceived value; (5) among the dimensions of service quality, “customer service and system reliability” is most influential on perceived value and customer satisfaction, and the influence of “content quality” ranks second; (6) the proposed model is proven with the effectiveness in explaining the relationships among service quality, perceived value, customer satisfaction, and post-purchase intention in mobile added-value services.
Keywords: Mobile value-added services; Service quality; Perceived value; Customer satisfaction, Post-purchase intention
1. Introduction
Thanks to the fast growth of the mobile communication market, mobile phones that used to be exclusively held by business persons have become personal equipment closely integrated into everyone’s daily life (Olla & Patel, 2002) and relatively more
dissolved the constraints set up by telecom service providers and allowed consumers to have more options. As a result, unable to rely solely on the conventional voice services, telecom service providers have been seeking for other opportunities to increase their business revenue.
Mobile value-added services are digital services added to mobile phone networks other than voice services in which the contents included can be either self-produced by mobile telecom service providers or provided through strategic alliances with content providers. These services include games, icons, ringtones, messages, web browsing, SMS (short message service) coupons, and electronic transaction. They can bring five values to consumers: time-critical needs and arrangement, spontaneous needs and decisions, entertainment needs, efficiency needs and ambitions, and mobility-related needs (Anckar & D’Incau, 2002). Thus, mobile value-added services will become new opportunities for telecom service providers. However, mobile value-added services provided by telecom service providers can be classified into four types, namely information, communication, transaction, and entertainment, and this classification applies to almost all the providers. Although new services are being released at all times, whether they are appealing to consumers and can induce positive post-purchase intention after consumers have used them so as to effectively increase revenue and sustainable development will be an important issue for telecom service providers.
Previous studies of marketing have pointed out that the key of corporate success and competitive advantage is the enhancement of service quality, perceived value, and customer satisfaction (Patterson & Spreng, 1997; Khatibi et al., 2002; Landrum & Prybutok, 2004; Wang et al., 2004; Yang & Peterson, 2004). As the number of studies of mobile telecom service quality is still limited, and a definite set of measurement indices for the service quality of mobile value-added services is not available, this study attempts to design a scale for measuring the service quality of mobile value-added services and further examines the relationships among service quality, perceived value, customer satisfaction, and post-purchase intention to find out which dimensions of service quality are significantly correlated with perceived value and customer satisfaction. The result can provide valuable reference information for mobile value-added service providers to manage their services and enhance their service quality.
2. Literature Review 2.1 Service quality
Parasuraman et al. (1985, 1988) conceived that service quality is the difference between customers’ expectation and their perceived performance of a service. Based
on this concept, Parasuraman et al. (1988) developed the SERVQUAL model (including five dimensions, namely tangible, responsiveness, reliability, assurance, and empathy) to measure service quality. This model has drawn attention from the academic and the practical circles. However, many scholars have questioned about the conceptual framework and measurement method of this model. For instance, Cronin and Taylor (1992) pointed out that using service quality performance (SERVPERF, i.e. the perceived service in SERVUQAL) to measure service quality produces better results of reliability, validity, and predictive power than using SERVQUAL. Some other studies (Boulding et al., 1993; McAlexander et al., 1994; Parasuraman et al., 1994; Zeithaml et al., 1996) also maintained that SERVPERF is more accurate than SERVQUAL in the measurement of service quality, and SERVQUAL can provide better diagnostic information. In the studies of the information industry, similar findings have been proposed (Pitt et al., 1997; Van Dyke et al., 1997; Landrum & Prybutok, 2004), and Zeithaml et al. (2002) proposed that it is not necessary to use customers’ expectation to measure the service quality of a website. Therefore, this study will directly use perceived service quality to measure the service quality of mobile value-added services.
In the research of website service quality, various measurement dimensions have been proposed according to website properties. Kuo (2003) put forth a virtual community service quality scale, using advertising mail management, customer service management, online quality and information safety, webpage design and content, and extra function and service to evaluate the service quality of a website. Yang et al. (2005) used usability, usefulness of content, adequacy of information, accessibility, and interaction to measure user's perceived quality of information presenting web portals. From the perspective of transaction process, Bauer et al. (2006) proposed eTransQual (including five quality aspects, namely functionality/design, enjoyment, process, reliability, and responsiveness) to measure the quality of online shopping services. As to the quality of mobile communication services, Chae et al. (2002) used connection quality, content quality, interaction quality, and contextual quality to measure the information quality of mobile networking services. Kim et al. (2004) examined the service quality of mobile communication services in South Korea by call quality, value-added services, and customer support. Based on the aforementioned studies of website and telecom
2.2 Perceived value
Customer’s perceived value can be defined from the perspectives of money, quality, benefit, and social psychology. The Monetary perspective indicates that value is generated when less is paid (such as by using coupons or promotions) for goods (Bishop, 1984). In other words, it is the concept of consumer surplus in economics; perceived value is the difference between the highest price that consumers are willing to pay for a product or a service and the amount practically paid. According to the quality perspective, value is the difference between the money paid for a certain product and the quality of the product (Bishop, 1984). That is, when less money is paid for a high quality product, positive perceived value will be created. The benefit perspective indicates that perceived value is customers’ overall evaluation of the utility of perceived benefits and perceived sacrifices (Zeithaml, 1988). In other words, consumers may cognitively integrate their perceptions of what they get and what they have to give up in order to obtaining goods. However, the sacrifice means more than the money paid for a certain goods. Non-monetary costs, such as transaction cost, search cost, negotiation cost, and time incurred during the purchase, should also be included (Zeithaml, 1988; Cronin et al., 1997; Keeney, 1999; Cronin et al., 2000). The social psychology perspective points out that the generation of value lies in the meaning of purchasing a certain goods to the buyer’s community (Sheth et al., 1991). That is, goods carrying particular meanings (such as social economic status and social culture) can increase the effect of social self-concept (Sweeney & Soutar, 2001; Wang et al., 2004). In this study, perceived value is the evaluation of the benefits of a product or a service by customers based on their advance sacrifices and ex-post perceived performance when they use mobile value-added services.
In the research of the relationships between service quality and customer’s perceived value in conventional retailing and online shopping, most of the empirical studies have pointed out that service quality will positively influence perceived value (Cronin et al., 1997; Cronin et al., 2000; Brady et al., 2001; Bauer et al., 2006). Among the studies of the telecom industry, Wang et al. (2004) and Turel and Serenko (2006) respectively investigated the mobile services in China and Canada and found out that service quality is positively related to perceived value. Thus, Hypothesis 1 is proposed as follows:
H1: Service quality positively influences perceived value in mobile value-added
services.
2.3 Customer satisfaction
Customer satisfaction can be defined using the transaction-specific perspective or cumulative perspective. The transaction-specific perspective indicates that
customer satisfaction is the evaluation based on the recent purchase experiences (Boulding et al., 1993). Compared with the transaction-specific perspective, the cumulative perspective stresses overall evaluations, indicating that evaluations of customer satisfaction should be based on all the purchase experiences of the customer, disregarding any specific purchase experience (Johnson & Fornell, 1991). Parasuraman et al. (1988) argued that the cumulative perspective is more capable of evaluating the service performance of firms and more effective in predicting consumers’ post-purchase behaviors (Wang et al., 2004). Among the studies of customer satisfaction in the information industry, Lin and Wang (2006) revealed that customer satisfaction of mobile commerce is consumer’s total response to the purchase experiences in a mobile commerce environment. Therefore, in this study, customer satisfaction is defined as the total consumption perception of consumers when using mobile value-added services.
Previous studies of conventional retailing have pointed out that service quality positively influences customer satisfaction (Johnson & Fornell, 1991; Kristensen et al., 1999; Cronin et al., 2000). Similar conclusions have been proposed in the studies of website and online shopping (Kuo, 2003; Lee & Lin, 2005; Collier & Bienstock, 2006; Hsu, 2006; Park & Kim, 2006; Bauer et al., 2006). Among the studies of the telecom industry, Wang et al. (2004) investigated the telecom industry in China, and Kim et al. (2004), Tung (2004), and Turel and Serenko (2006) investigated the mobile services in South Korea, Singapore, and Canada respectively. These studies also supported that service quality positively influences customer satisfaction. Thus, Hypothesis 2 is proposed as follows:
H2: Service quality positively influences customer satisfaction in mobile value-added
services.
In the research of the relationships between perceived value and customer satisfaction, empirical studies of the conventional retailers discovered that perceived value positively influences customer satisfaction in most cases (Cronin et al., 2000; Eggert & Ulaga, 2002). A similar conclusion was also proposed in the studies of online shopping websites and e-commerce (Yang & Peterson, 2004; Hsu, 2006). In the aspect of the telecom industry, Wang et al. (2004) (focusing the telecom industry in China), Tung (2004) (SMS service in Singapore), Lin and Wang (2006) (mobile
2.4 Post-purchase intention
Post-purchase intention is the tendency that consumers will purchase the goods or services at the same shop and deliver their use experiences to friends and relatives (Zeithaml et al., 1996; Cronin et al., 2000; Wang et al., 2004). To evaluate post-purchase intention, Zeithaml et al. (1996) adopted loyalty, switch, pay more, external response, and internal response to assess the evaluation work. Boulding et al. (1993) used repurchase intention and word of mouth (WoM) to evaluate consumer's post-purchase intention. Repurchase intention is the process of an individual purchasing goods or services from the same firm (Hellier et al., 2003), and the reason for repurchase is primarily based on past purchase experiences. Compared with attracting new customers, enterprises can spend less on marketing to retain old customers (Zeithaml et al., 1996). WoM is a process in which consumers who have used a certain product or service pass their experiences through word of mouth to consumers planning to purchase the product or service (Westbrook, 1987). Consumers who have not experienced or fully understood the properties of a certain product or service may usually rely on WoM to acquire information (Bansal & Voyer, 2000). Therefore, compared with external marketing strategies, WoM is more important and influential to customer’s attitude and behavior (Harrison-Walker, 2001).
In previous studies, post-purchase intention has been frequently used to inspect service quality (Cronin & Taylor, 1992; Boulding et al., 1993; Zeithaml et al., 1996; Cronin et al., 1997; Cronin et al., 2000; Alexandris et al., 2002; Wang et al., 2004), which has been considered as significantly and positively influential to post-purchase intention (Boulding et al., 1993; Zeithaml et al., 1996; Cronin et al., 1997; Cronin et al., 2000; Alexandris et al., 2002). In other words, good service quality can induce positive post-purchase intention of consumers. In the research of website and online stores, Kuo (2003) pointed out that the service quality of online community is positively related to continuous use, referral, and loyalty. Lee and Lin (2005) found that the service quality of online shops positively influences post-purchase intention. Thus, Hypothesis 4 is proposed as follows:
H4: Service quality positively influences post-purchase intention in mobile
value-added services.
In recent years, corporate managers and marketing staffs have used long-neglected perceived value to evaluate consumer’s post-purchase intention (Patterson & Spreng, 1997; Eggert & Ulaga, 2002; Petrick, 2002; Wang et al., 2004; Lin et al., 2005). In the discussion of the relationships between perceived value and post-purchase intention, many scholars considered perceived value has direct
effects on repurchase intention and WoM (Eggert & Ulaga, 2002; Petrick, 2002; Wang et al., 2004; Lin et al., 2005). Cronin et al. (2000) discovered in a cross-industrial research that perceived value has positive effects on post-purchase intention. Wang et al. (2004) which focused on the telecom industry in China also supported that perceived value positively influences post-purchase intention. Lin and Wang (2006) also revealed that perceived value positively influences loyalty in the research of mobile commerce in Taiwan. Thus, Hypothesis 5 is proposed as follows:
H5: Perceived value positively influences post-purchase intention in mobile
value-added services.
Many studies of satisfaction have pointed out a positive relationship between customer satisfaction and post-purchase intention (Johnson & Fornell, 1991; Cronin et al., 2000; Brady et al., 2001). Consumers with a higher level of satisfaction tend to have a stronger intention to repurchase and recommend the purchased product (Zeithaml et al., 1996). In other words, when customer satisfaction is enhanced, repurchase can be more frequent. The extant studies of e-retailing and online shopping also provided the similar conclusions (Lee & Lin, 2005; Collier & Bienstock, 2006). Among the studies of the telecom industry, Gerpott et al. (2001) and Tung (2004) respectively examined the telecom industry in Germany and SMS service in Singapore. They also concluded that customer satisfaction is positively related to post-purchase intention. Moreover, other studies of the mobile services in Canada and China also supported this argument (Wang et al., 2004; Turel & Serenko, 2006). Lin and Wang (2006) manifested a positive relationship between customer satisfaction and customer loyalty in the study of mobile commerce in Taiwan. Thus, Hypothesis 6 is proposed as follows:
H6: Customer satisfaction positively influences post-purchase intention in mobile
value-added services.
Fig.1. Research model
3. Research methodology 3.1 Questionnaire design
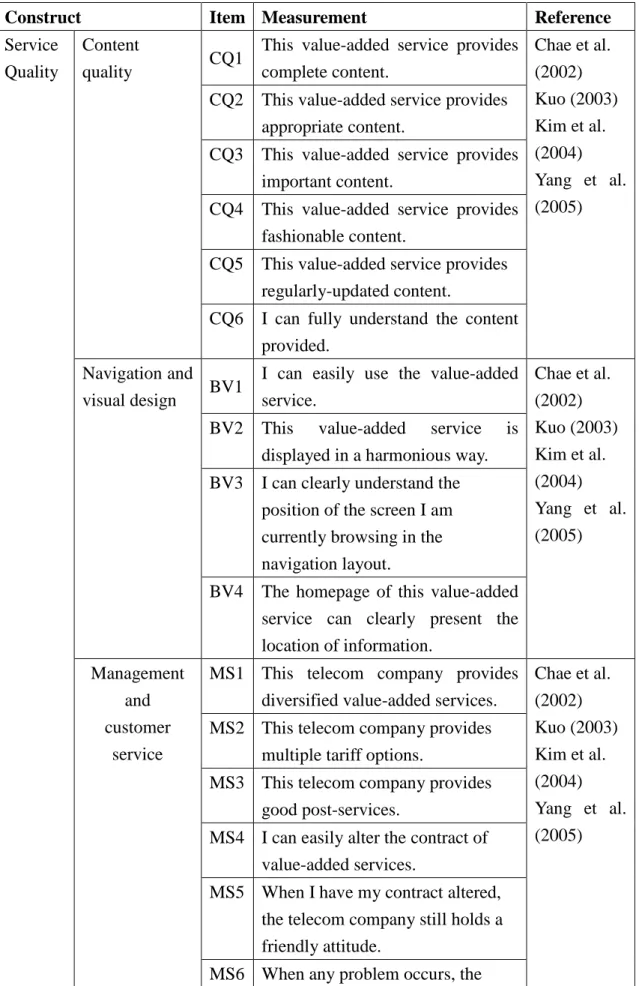
The questionnaire used in this study was designed according to related literatures and users’ and experts’ opinions. After the draft was completed, a pretest was performed on experts and users familiar with mobile value-added services to modify items with ambiguous expressions. Therefore, questionnaire respondents could understand the questions in the formal survey and the content validity of the questionnaire could be ensured. The questionnaire was composed of two sections. The first section was intended to understand each respondent’s basic personal data and usage of mobile phone and value-added services. All the measurement scales adopted were nominal. The second section measured the respondent’s perception of each construct in the research model. All items were assessed using five-point Likert scales from 1= “strongly disagree” to 5= “strongly agree”. Table 1 shows the research constructs and items included in the questionnaire. Operationalizations of the research constructs are as follows.
1. Service quality
Service quality is operationalized using the SERVPERF model due to the superiority of performance-based measures (Cronin & Taylor, 1992; Boulding et al., 1993; McAlexander et al., 1994; Parasuraman et al., 1994; Zeithaml et al., 1996; Pitt et al., 1997; Van Dyke et al., 1997; Zeithaml et al., 2002; Landrum & Prybutok, 2004). That is, perceived service quality will be used to measure the service quality of mobile value-added services. The construct of service quality was initially grounded on the four examining dimensions (content quality, navigation and visual design, management and customer service, and system reliability and connection quality) and was measured by twenty four items adapted from Chae et al. (2002), Kuo (2003),Kim et al. (2004), and Yang et al. (2005), which dealt with the service quality of mobile Internet, Website, mobile telecommunication, and Web portal services. These items
were also modified to fit the mobile value-added services context.
2. Perceived value
Perceived value is trade-off between what customers receive, such as quality, benefits, and utilities, and what they sacrifice, such as price, opportunity cost, time, and efforts (Zeithaml, 1988; Cronin et al., 1997; Keeney, 1999; Cronin et al., 2000). In this study, perceived value is the evaluation of the benefits of a product or a service by customers based on their advance sacrifices and ex-post perceived performance when they use mobile value-added services. Perceived value was measured by three-item measures adapted from Cronin et al. (2000), Tung (2004), and Wang et al. (2004). These items were also modified in wording appropriate for mobile value-added services context.
3. Customer satisfaction
Customer Satisfaction is customers’ cumulative impression of a firm’s service performance (Johnson & Fornell, 1991). In terms of mobile commerce, customer satisfaction is customer’s post-purchase evaluation and affective response or feeling to the overall product or service experience in a mobile commerce environment (Ling & Wang, 2006). In this study, customer satisfaction is defined as the total consumption perception of consumers when using mobile value-added services. The items measuring customer satisfaction were measured by three-item measures taken from previous measures of the overall level of user satisfaction in mobile services (Chae et al., 2002; Lin & Wang, 2006).
4. Post-purchase intention
Post-purchase intention is the tendency that consumers will purchase the goods or services at the same shop and deliver their use experiences to friends and relatives (Zeithaml et al., 1996; Cronin et al., 2000; Wang et al., 2004). Items for the post-purchase intention construct were measured by three-item measures adapted from the previously validated inventory (Zeithaml et al., 1996; Cronin et al., 2000; Wang et al., 2004) and all items were modified to fit the mobile value-added services context.
Table 1 Constructs and items included in the questionnaire
Construct Item Measurement Reference
Service Quality
Content
quality CQ1
This value-added service provides complete content. Chae et al. (2002) Kuo (2003) Kim et al. (2004) Yang et al. (2005) CQ2 This value-added service provides
appropriate content.
CQ3 This value-added service provides important content.
CQ4 This value-added service provides fashionable content.
CQ5 This value-added service provides regularly-updated content.
CQ6 I can fully understand the content provided.
Navigation and
visual design BV1
I can easily use the value-added service. Chae et al. (2002) Kuo (2003) Kim et al. (2004) Yang et al. (2005) BV2 This value-added service is
displayed in a harmonious way. BV3 I can clearly understand the
position of the screen I am currently browsing in the navigation layout.
BV4 The homepage of this value-added service can clearly present the location of information.
Management and customer
service
MS1 This telecom company provides diversified value-added services.
Chae et al. (2002) Kuo (2003) Kim et al. (2004) Yang et al. (2005) MS2 This telecom company provides
multiple tariff options.
MS3 This telecom company provides good post-services.
MS4 I can easily alter the contract of value-added services.
MS5 When I have my contract altered, the telecom company still holds a friendly attitude.
telecom company can instantly cope with it.
MS7 This telecom company provides a FAQ for value-added services. System
reliability and connection quality
SC1 This value-added service system is stable. Chae et al. (2002) Kuo (2003) Kim et al. (2004) Yang et al. (2005) SC2 Error seldom occurs to this
value-added service system. SC3 This value-added service provides
effective links.
SC4 I can easily return to the screen previously browsed.
SC5 It does not take too much time to download the information I need. SC6 It does not take too much time to
load the links I click on.
SC7 This value-added service system can instantly react to the data I input.
Perceived value PV1 I feel I am getting good mobile
value-added services for a reasonable price. Cronin et al. (2000) Tung (2004) Wang et al. (2004) PV2 Using the value-added services
provided by this telecom company is worth for me to sacrifice some time and efforts.
PV3 Compared with other telecom companies, it is wise to choose this telecom company.
Customer Satisfaction CS1 I am satisfied with the value-added services provided by this telecom company.
Chae et al. (2002) Lin & Wang (2006) CS2 I think this telecom company has
value-added services provided by this telecom company again.
al. (1996) Cronin et al. (2000) Wang et al. (2004) PI2 In the future, I will recommend the
value-added services provided by this telecom company to my relatives and friends.
PI3 In the future, I will continue to use the value-added services provided by this telecom company.
3.2 Research subjects and sampling method
This study was conducted in Taiwan because the high penetration rate in mobile phone (110%) technologies and applications (DGT, 2003). According to a 2006 survey released by FIND (Foreseeing Innovative New Digiservices, Taiwan), approximately 57.7% of Taiwanese people have used mobile value-added services recently, and most of them (54.2%) are in the age group of 21-30. Therefore, if this age group was selected for sampling, the result would be representative to a certain degree of the population. The above age group is mainly composed of college students and graduate students, who may come from various regions of Taiwan. Thus, under limited research resources, fifteen universities were selected, and undergraduates and graduate students in these universities were the respondents of this study. In the formal survey, we requested teachers willing to assist our research to let us distribute questionnaires in class and retrieve them after students have collectively completed their answers. Before the formal survey, the purpose of this study and notices were explained. Assistance was further provided to the respondents during the survey to reduce the occurrence of invalid response. A total of 1100 questionnaires were distributed, and the response rate was 100%. Excluding the respondents not in the selected age group (age 21-30) and those who have never used mobile value-added services before, a total of 387 valid questionnaires were obtained.
4. Data analysis, results and discussion 4.1 Sample characteristics
Among the samples collected, female respondents (58.4%) were the majority. In terms of education background, college students accounted for 89.1%. Most of them were the subscribers of Chunghwa Telecom (54.5%). In terms of use time, over 90% (91.5%) of them used value-added services for less than 30 minutes a month, and nearly 60% (58.4%) of them used no more than 10 minutes a month. Most of them (81.4%) spent no more than NT$200 on value-added services a month. In terms of
value-added services used, the top five value-added services were ringtone (48.6%), multimedia message service (MMS) (48.4%), picture download (28.4%), music download (28.2%), and auto answering message (13.2%). Over the past six months, MMS was the most frequently used service (33.3%). Among the reasons why consumers did not use mobile value-added services, need-irrelevant (48.0%) was the main cause, followed by lack of understanding about how to use them (40.7%) and high cost (33.0%). (The above three questions allowed multiple answers.) In order to assess the representativeness of the sample, we collected and compared socio-demographical characteristics and the most popular mobile value-added services of the respondents with those reported in a survey of mobile data services use in Taiwan conducted by FIND (2007), one of the leading organizations for providing abundant and professional information on Internet demographics and trends. Our comparison revealed a close match between both samples.
4.2 Verification of the proposed model and hypotheses
This study employed structural equation modeling (SEM) to verify the proposed model and hypotheses and used LISREL 8.52 as the analysis tool. The dimensions of service quality were analyzed first. Later, the research model was analyzed and verified. For parameter estimation, maximum likelihood method was adopted. In the model fitness test, measurement model test and structural model test were used.
1. Measurement model of service quality
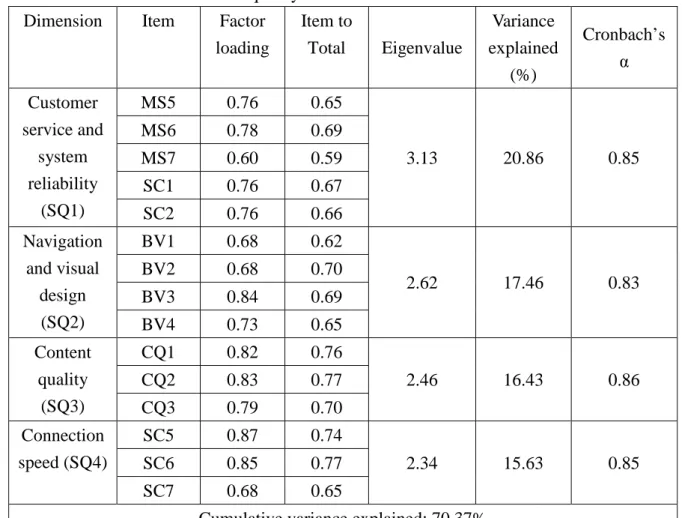
The exploratory factor analysis (EFA) was performed to purify the scale of service quality in the hope of deleting the “garbage items” which do not have the common core. Before EFA, a Bartlett sphericity test was performed to determine whether the data were appropriate for factor analysis. In terms of service quality, a KMO (Kaiser-Meyer-Olkin) value of 0.90 and significance level of 0.00 were obtained using Bartlett’s sphericity test, which suggests that the inter-correlation matrix contains sufficient common variance to make factor analysis worthwhile. For EFA, the Principal Component Analysis, with varimax rotation and eigenvalue greater than 1 and factor loadings greater than 0.4 was used (Kaiser, 1958). For the analysis of items, the corrected item-total correlation coefficient less than 0.40 was used as the criterion to delete items, and whether the removal of the item could significantly
customer service, and SC5-SC7 composed a new dimension. Thus, according to the analysis results, the dimensions were respectively renamed as “customer service and system reliability”, “navigation and visual design”, “content quality”, and “connection speed”. These were consistent with our original dimensions except for the system reliability and connection quality. The Cronbach’s α coefficients ranged from 0.83 to 0.86, and the cumulative variance explained was 70.37%.
To test normality assumptions underlying the maximum likelihood procedure, we used the multivariate normality test to exam whether the data were normal distributed. The result indicated that data were normal (p-value>0.05). In the next step, we performed confirmatory factor analysis (CFA) to test the overall fit of the measurement model. In the beginning, χ2 was used as the criterion to test the overall fit. If χ2 was small and did not reach the level of significance, the overall fit of the model was good. However, χ2 was sensitive to sample size. When sample size was large, χ2 would easily reach the level of significance, making the model ineffective as a result (Bentler & Bonnett, 1980). Thus, many researchers have proposed various fit indices to improve the drawback that χ2 is greatly affected by sample size and suggested that various indices be considered before making the judgment of fit (Hair et al., 1998). Table 3 shows the common fit indices, recommended values and analytical results for measurement model of service quality. According to Table 3, all the model-fit indices exceeded the respective common acceptance levels (Hair et al., 1998), indicating that the measurement model of service quality exhibited a good fit with the data collected.
Table 2 EFA results of service quality Dimension Item Factor
loading Item to Total Eigenvalue Variance explained (%) Cronbach’s α Customer service and system reliability (SQ1) MS5 0.76 0.65 3.13 20.86 0.85 MS6 0.78 0.69 MS7 0.60 0.59 SC1 0.76 0.67 SC2 0.76 0.66 Navigation and visual design (SQ2) BV1 0.68 0.62 2.62 17.46 0.83 BV2 0.68 0.70 BV3 0.84 0.69 BV4 0.73 0.65 Content quality (SQ3) CQ1 0.82 0.76 2.46 16.43 0.86 CQ2 0.83 0.77 CQ3 0.79 0.70 Connection speed (SQ4) SC5 0.87 0.74 2.34 15.63 0.85 SC6 0.85 0.77 SC7 0.68 0.65
Cumulative variance explained: 70.37%
Table 3 The fit indices and analysis results for measurement model of service quality
Fit indices Recommended value Result
χ2/df <3.00 1.58
GFI(goodness of fit index) >0.90 0.96
RMSEA(root mean square error of
approximation) <0.08 0.04
RMR(root mean square residual) <0.08 0.03
NFI(normed fit index) >0.90 0.99
NNFI(non-normed fit index) >0.90 0.99
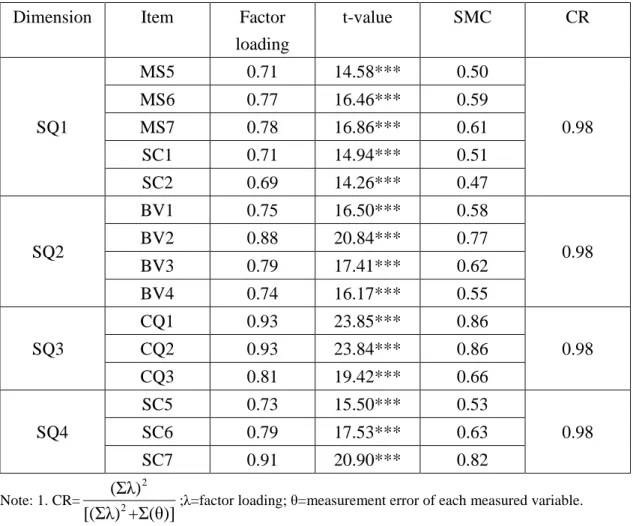
had good reliability (Bagozzi & Yi, 1988; Hair et al., 1998). Moreover, the completely standardized factor loadings all reached the level of significance. All the latent variables had a CR above 0.60 and an average variance extracted (AVE) above 0.50, meaning that a good convergent validity could be obtained (Fornell & Larcker, 1981). Each latent variable’s AVE was larger than the squared correlation between each pair of latent variables. Hence, the discrimination validity was adequate (Fornell & Larcker, 1981).
Table 4 Standardized factor loadings, SMC and CR for measurement model of service quality
Dimension Item Factor
loading t-value SMC CR SQ1 MS5 0.71 14.58*** 0.50 0.98 MS6 0.77 16.46*** 0.59 MS7 0.78 16.86*** 0.61 SC1 0.71 14.94*** 0.51 SC2 0.69 14.26*** 0.47 SQ2 BV1 0.75 16.50*** 0.58 0.98 BV2 0.88 20.84*** 0.77 BV3 0.79 17.41*** 0.62 BV4 0.74 16.17*** 0.55 SQ3 CQ1 0.93 23.85*** 0.86 0.98 CQ2 0.93 23.84*** 0.86 CQ3 0.81 19.42*** 0.66 SQ4 SC5 0.73 15.50*** 0.53 0.98 SC6 0.79 17.53*** 0.63 SC7 0.91 20.90*** 0.82 Note: 1. CR= 2 2 (Σλ)
[(Σλ) +Σ(θ)];λ=factor loading; θ=measurement error of each measured variable.
Table 5 The mean, standard deviation, and inter-variable correlations of service quality Mean S. D. SQ1 SQ2 SQ3 SQ4 SQ1 3.34 0.63 0.92 SQ2 3.26 0.66 0.67 0.93 SQ3 3.37 0.63 0.61 0.67 0.95 SQ4 3.10 0.74 0.65 0.73 0.60 0.94
Note: 1. Diagonal elements show the average variance extracted (AVE). Off-diagonal elements show the shared variance.
2. AVE=
2
2
(Σλ )
[(Σλ )+Σ(θ)]; λ=factor loading; θ=measurement error of each measured variable.
2. Total measurement model
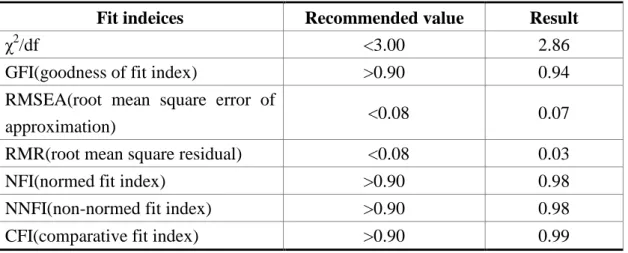
In this section, first we used the multivariate normality test to exam whether the data were normal distributed. The result indicated that data were normal (p-value>0.05), then CFA was employed to test the hypothesized relationships between measured variables and latent variables. Table 6 shows the common fit indices, recommended values and analytical results for total measurement model. According to Table 6, all the model-fit indices were qualified with the recommended values (Hair et al., 1998), indicating that the overall model fit was acceptable.
Table 6 The fit indices and analysis results of the measurement model
Fit indeices Recommended value Result
χ2/df <3.00 2.86
GFI(goodness of fit index) >0.90 0.94
RMSEA(root mean square error of
approximation) <0.08 0.07
RMR(root mean square residual) <0.08 0.03
NFI(normed fit index) >0.90 0.98
NNFI(non-normed fit index) >0.90 0.98
CFI(comparative fit index) >0.90 0.99
As shown in Tables 7 and 8, except for SQ4 with an SMC slightly smaller than the recommended criterion, all the other items had a value above 0.50, and the CR of latent variables was larger than 0.60, indicating that all measures had good reliability
validity was good (Fornell & Larcker, 1981).
Table 7 Standardized factor loadings, SMC and CR of the measurement model
Construct Item Factor
loading t-value SMC CR SQ SQ1 0.79 16.92*** 0.63 0.98 SQ2 0.81 17.37*** 0.66 SQ3 0.73 15.82*** 0.54 SQ4 0.66 13.94*** 0.44 PV PV1 0.75 16.29*** 0.56 0.97 PV2 0.74 16.20*** 0.54 PV3 0.83 18.84*** 0.69 CS CS1 0.77 17.25*** 0.59 0.98 CS2 0.89 21.08*** 0.79 CS3 0.86 20.07*** 0.73 PI PB1 0.90 22.74*** 0.80 0.98 PB2 0.85 20.40*** 0.72 PB3 0.96 25.17*** 0.92 Note: *** p<0.001
Table 8 The mean, standard deviation, and inter-variable correlations
Mean S. D. SQ PV CS PI
SQ 3.27 0.53 0.92
PV 3.03 0.64 0.67 0.95
CS 3.25 0.62 0.72 0.78 0.93
PI 3.26 0.72 0.63 0.80 0.78 0.94
Note: Diagonal elements show the average variance extracted (AVE). Off-diagonal elements show the shared variance.
3. Structural model
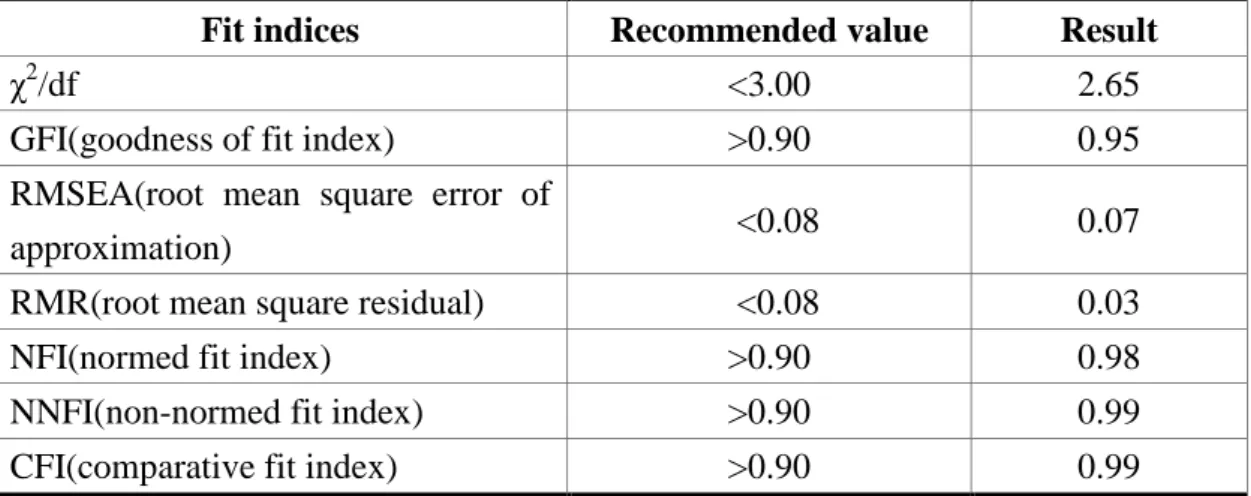
Table 9 shows the common model-fit indices, recommended values and results of the test of structural model fitness. As shown in Table 9, comparison of all fit indices with their corresponding recommended values (Hair et al., 1998), the evidence of a good model fit was revealed.
Table 9 The fit indices and analysis results of the structural model of the overall model
Fit indices Recommended value Result
χ2/df <3.00 2.65
GFI(goodness of fit index) >0.90 0.95
RMSEA(root mean square error of
approximation) <0.08 0.07
RMR(root mean square residual) <0.08 0.03
NFI(normed fit index) >0.90 0.98
NNFI(non-normed fit index) >0.90 0.99
CFI(comparative fit index) >0.90 0.99
Given the satisfactory fit of the model, the estimated path coefficients of the structural model were then examined to evaluate the hypotheses. Figure 2 shows the standardized path coefficients, t -values, and coefficients of determination (R2) of the latent variables. Most of the hypotheses were strongly supported, expect for
hypothesis H4 (γ=0.00; t=0.02). The research results and discussions are shown as follows.
(1) The effect of service quality on perceived value
Service quality had a positive and significant effect on perceived value (γ=0.67; t=11.07). Thus, H1 was supported. This result is consistent with those of previous studies on the telecom industry (Wang et al., 2004; Turel & Serenko, 2006). In other words, when telecom companies provide good service quality in terms of mobile value-added services, perceived value can be enhanced.
(2) The effect of service quality and perceived value on customer satisfaction
As expected, customer satisfaction was significantly directly influenced by both service quality (γ=0.37; t=5.68) and perceived value (β=0.53; t=7.52), so H2 and H3 were supported. These results echo the findings of previous studies on the telecom industry (Wang et al., 2004; Tung, 2004; Turel & Serenko, 2006). Thus, when customers perceive higher service quality and value of mobile value-added services, their satisfaction will be more positive.
(3) The effect of service quality, perceived value, and customer satisfaction on post-purchase intention
Service quality had no significantly positive influence on post-purchase intention (γ=0.00; t=0.02), so H4 was not supported. This means that the effect of service quality on post-purchase intention was insignificant. Service quality has no significant influence on post-purchase intention, probably due to the properties of research samples. The respondents in this study were undergraduates and graduate students. In this era of information and technology, computer and new things would be frequently involved in their life. Therefore, according to their life experiences, they would consider that the service quality of the mobile value-added services should be equipped with these quality attributes, so the service quality of mobile value-added services cannot significantly influence their post-purchase intention. Post-purchase intention was significantly directly influenced by both perceived value (β=0.50; t=6.44) and customer satisfaction (β=0.39; t=4.95), thereby confirming H5 and H6, respectively. These results are consistent with the findings of previous studies on the telecom industry (Wang, 2004; Lin & Wang, 2006). It implies that when customers have high perceptions of value and high levels of satisfaction with the mobile value-added services, they are more likely to use or reuse the services again in the future or to encourage their friends and relatives to do so.
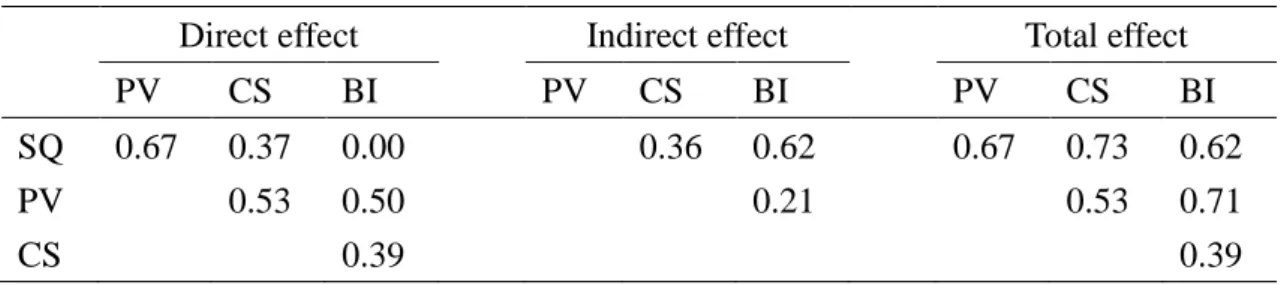
(4) The direct effect, indirect effect, and total effect of each construct on the post-purchase intention
the indirect effect of each construct on the post-purchase intention can be calculated (Table 10). The total effects of the constructs on post-purchase intention (direct effect plus indirect effect) can be ranked as follows: perceived value (0.71), service quality (0.62), and customer satisfaction (0.39). This result is consistent with the argument of previous studies (Keen & Mackintosh, 2001; Ancker & D’Incau, 2002) which the most important focus of mobile commerce in the future is to create customer value. By delivering higher values to customers, customers’ repurchase intention can be increased and their positive words of mouth can be transmitted to others (Eggert & Ulaga, 2002; Petrick, 2002; Lin et al., 2005). Although service quality has no direct and significant effect on post-purchase intention, service quality will indirectly influence post-purchase intention through perceived value and customer satisfaction. Thus, good service quality is still critical to the profit of firms and the maintenance of their competitive advantages and customer satisfaction is influential to long-term relationships between firms and customers.
In addition, according to R2 results, 45.5% variance of perceived value can be explained by service quality; 67.7% variance of customer satisfaction can be jointly explained by service quality and perceived value; 70% variance of post-purchase intention can be jointly explained by service quality, customer satisfaction, and perceived value. According to the above results, we can say the proposed model is effective in explaining the relationships among the service quality, customer satisfaction, perceived value, and post-purchase intention in mobile value-added services.
Table 10 The direct effect, indirect effect, and total effect of each construct
Direct effect Indirect effect Total effect
PV CS BI PV CS BI PV CS BI
SQ 0.67 0.37 0.00 0.36 0.62 0.67 0.73 0.62
PV 0.53 0.50 0.21 0.53 0.71
CS 0.39 0.39
4.3 The multiple regression analysis of the effects of service quality on perceived value and customer satisfaction
1. The multiple regression analysis of the effects of service quality on perceived value According to Table 11, the four dimensions of service quality all had significantly positive effects on perceived value. In other words, customer service and system reliability (SQ1), navigation and visual design (SQ2), content quality (SQ3), and connection speed (SQ4) influenced the perceived value. The effect of “customer service and system reliability” ranked first (0.27), followed by “content quality” (0.15), “navigation and visual design” (0.15), and “connection speed” (0.14).
Table 11 The multiple regression analysis of the effects of service quality on perceived value
Dimension Standardized coefficients t
SQ1 0.27 5.02*** SQ2 0.15 2.52* SQ3 0.15 2.81** SQ4 0.14 2.66** R2=0.32, Adj- R2=0.31, F=44.82*** Note: * p<0.05 ** p<0.01 *** p<0.001
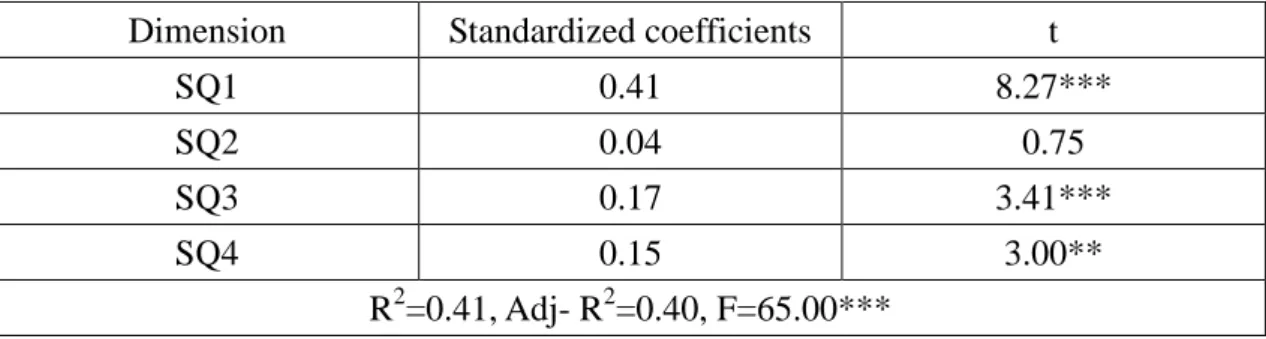
2. The multiple regression analysis of the effects of service quality on customer satisfaction
As shown in Table 12, among the four dimensions of service quality, except navigation and visual design (SQ2) (t=0.75, p>0.05), all the other dimensions had significantly positive effects on customer satisfaction. This means that customer service and system reliability (SQ1), content quality (SQ3), and connection speed (SQ4) will influence customer satisfaction, where “customer service and system reliability” (0.41) ranked first, followed by “content quality” (0.17) and “connection speed” (0.15).
Table 12 The multiple regression analysis of the effects of service quality on customer satisfaction
Dimension Standardized coefficients t
SQ1 0.41 8.27*** SQ2 0.04 0.75 SQ3 0.17 3.41*** SQ4 0.15 3.00** R2=0.41, Adj- R2=0.40, F=65.00*** Note: * p<0.05 ** p<0.01 *** p<0.001 5. Conclusions
In this study, a scale for measuring the service quality of mobile value-added services was proposed first. Through exploratory and confirmatory factor analyses, we identified four dimensions of service quality, including customer service and system reliability, navigation and visual design, content quality, and connection speed. The final instrument showed adequate reliability and validity. Further, we also examined the relationships among service quality, perceived value, customer satisfaction, and post-purchase intention in mobile value-added services. The proposed model was strongly supported by the data collected in Taiwan. Service quality positively influenced perceived value and customer satisfaction, indicating that when telecom companies provide good service quality, perceived value and customer satisfaction can be enhanced. Perceived value positively influenced customer satisfaction. In other words, higher perceived value can lead to higher customer satisfaction. Perceived value and customer satisfaction directly and positively influenced post-purchase intention, where the effect of perceived value was the largest, followed by that of customer satisfaction. Service quality showed no directly positive effect on post-purchase intention. Although service quality has no direct effect on post-purchase intention, service quality could indirectly influence post-purchase intention through perceived value and customer satisfaction.
According to the total effects of each construct on post-purchase intention, the constructs can be ranked as follows: perceived value, service quality, and customer satisfaction. This result implies that if telecom companies attempt to induce positive post-purchase intention from mobile value-added service users, such as the intention to refer or repurchase the service, improvement of perceived value should be prioritized. They can evaluate whether the release of a certain value-added service can make customers feel the service is “more valuable than it costs”, the benefits of the service for consumers, and the reasonableness of its price. Therefore, users not only use a certain service but also feel the value added of the service, which elevates the simple use of service to enjoyment. In this way, the value-added service can create stickiness of users and even become a real competition advantage. Besides, service quality also plays an important role. According to the importance of the four dimensions of service quality, telecom companies can improve the quality of value-added services. Through the results of multiple regression analysis, we found the effects of “customer service and system reliability” on perceived value and
meet the present needs. In terms of the stability of wireless networks, the correctness and the stability of connections should be ensured. “Content quality”, “navigation and visual design”, and “connection speed” ranked second, third, and fourth in terms of their influence on perceived value, respectively. However, navigation and visual design showed no significant impact on customer satisfaction. In the aspect of content quality, telecom companies should reinforce their cooperation with content providers and further evaluate the value and usefulness of the value-added service content and whether they meet the demands of consumers to attract more users. In the aspect of connection speed, various technologies should be integrated and developed, and existing base stations should be upgraded to enhance connection speed. In the aspect of navigation and visual design, the limited display of mobile phones should be considered, so as to provide a comfortable and easy-to-operate user interface. If telecom companies can reinforce their service quality, then perceived value and customer satisfaction can be directly improved, post-purchase intention can be indirectly positively influenced, and business profit and competitiveness will be enhanced.
To address the limitation of our study we point out the following issues. Even though the study succeeds in validating the measurement scale of service quality in mobile value-added services, but the results obtained in the EFA developed to test the measurement model of service quality show off some weaknesses in the elaboration of the measurement scales for content quality, management and customer service, and system reliability and connection quality. Particularly, the need to remove nine items from the scales originally proposed for this constructs may raise doubts about content validity of the scales. This could be due to various reasons. One of the reasons is that the measurement scale of service quality in mobile value-added services is designed according to the related literatures including Internet (such as Web portals and Website) and mobile telecomm service quality, but the attributes of mobile value-added services are still a little different from the above services. This situation indicated that when rashly applying the service quality scale in Internet and Web environment to measure mobile value-added service quality is inappropriate. The validated scale, the fifteen items across four dimensions, in this study can serve a useful instrument to measure the service quality in mobile value-added services. Consequently, we can use a second-order factor model to test the stability of the scale of service quality in mobile value-added services. In addition, other large samples should be gathered to confirm and refine, the factor structure of the service quality scale in mobile value-added services, and to assess its reliability and validity.
For future research, we suggested that variables that affect consumer’s post-purchase intention (such as switch cost) should be discussed to have more
extensive understanding. In addition, some respondents’ characteristics may affect on the results of multiple regressions for example gender, education, and level of value-added services usage. There variables may consider as control variables to modify their effects. In the aspect of sampling respondents, this study selected only the main user group of mobile value-added services (university students and graduate students). Follow-up studies can extend this scope to other consumer groups. Due to the limitation of time, cross-sectional data collection method was adopted. Thus, follow-up studies can collect longitudinal data to re-verify the proposed model or find out whether there is any difference when applied to different consumer groups.
Acknowledgement:
This research is supported by National Science Council (NSC 95-2416-H-390-006), Taiwan.
References
Alexandris, K., Dimitriadis, N., and Markata, D. (2002). Can perceptions of service quality predict behavioral intentions? An exploratory study in the hotel sector in Greece. Managing Service Quality, 12(4), 224-231.
Anckar, B., and D’Incau, D. (2002). Value creation in mobile commerce: Findings from a consumer survey. Journal of Information Technology Theory and Application, 4(1), 43-64.
Bagozzi, R. P., and Yi, Y. (1988). On the evaluation of structural equation models. Journal of the Academy of Marketing Science, 16(1), 74-94.
Bansal, H. S., and Voyer, P. A. (2000). Word-of-mouth processes within a services purchase decision context. Journal of Service Research, 3(2), 166-177.
Bauer, H. H., Falk, T., and Hammerschmidt M. (2006). eTransQual: A transaction process-based approach for capturing service quality in online shopping. Journal of Business Research, 59(7), 866-875.
Bentler, P. M., and Bonntt, D. G. (1980). Significance tests and goodness of fit in the analysis of covariance structures. Psychological Bulletin, 88, 588-606.
Bishop, W. R., Jr. (1984). Competitive intelligence. Progressive Grocer, 63(3), 19-20. Boulding, W., Kalra, A., Richard, S., and Zeithaml, V. A. (1993). A dynamic process
Chae, M., Kim, J., Kim, H., and Ryu, H. (2002). Information quality for mobile internet services: A theoretical model with empirical validation. Electronic Markets, 12(1), 38-46.
Clarke, I. (2001). Emerging value propositions for m-commerce. Journal of Business Strategies, 18(2), 133-148.
Collier, J. E., and Bienstock, C. C. (2006). Measuring service quality in e-retailing. Journal of Service Research, 8(3), 260-275.
Cronin, J. J., Brady, M. K., Brand, R. R., Hightower, R., and Shemwell, D. (1997). A cross-sectional test of the effect and conceptualization of service value. The Journal of Service Marketing, 11(6), 375-391.
Cronin, J. J., Brady, M. K., and Hult, G. T. M. (2000). Assessing the effects of quality, value, and customer satisfaction on consumer behavioral intentions in service environments. Journal of Retailing, 76(2), 193-218.
Cronin, J. J., and Taylor, S. A. (1992). Measuring service quality: A reexamination and extension. Journal of Marketing, 56(3), 55-68.
DGT (Directorate General of Telecommunications, Ministry of Transportation and Communications, Taiwan) (2003). Trend analysis of major telecom services
penetration rate.
http://www.dgt.gov.tw/english/Data-statistics/Major-Statistics/2003/telecom-servi ce.shtml.
Eggert, A., and Ulaga, W. (2002). Customer perceived value: A substitute for satisfaction in business markets. The Journal of Business and Industrial Marketing, 17(2/3), 107-118.
FIND (Forseeing Innovative New Digiservices) (2006). Program for the development and promotion of the broadband and wireless communications industry. http://www.find.org.tw/find/home.aspx?page=many&id=154.
FIND (Forseeing Innovative New Digiservices) (2007). 2006 survey of mobile data services use in Taiwan. http://www.find.org.tw/mit/200706_ss/HotData_01.html. Fornell, C., and Larcker, D. F. (1981). Evaluating structural equation models with
unobservable variables and measurement error. Journal of Marketing Research, 18(1), 39-50.
Gerpott, T. J., Rams, W., and Schindler, A. (2001). Customer retention, loyalty, and satisfaction in the German mobile cellular telecommunications market. Telecommunications Policy, 25(4), 249-269.
Hair, J. F., Anderson, R. E., Tatham, R. L., and Black, W. C. (1998). Multivariate data analysis. Englewood Cliffs: Prentice-Hall.
Harrison-Walker, L. J. (2001). The measurement of word-of-mouth communication and an investigation of service quality and customer commitment as potential
antecedents. Journal of Service Research, 4(1), 60-75.
Hellier, P. K., Geursen, G. M., Carr, R. A., and Rickard, J. A. (2003). Customer repurchase intention: A general structural equation model. European Journal of Marketing, 37(11/12), 1762-1800.
Hsu, H. (2006). An empirical study of web site quality, customer value, and customer satisfaction based on e-shop. The Business Review, 5(1), 190-193.
Johnson, M. D., and Fornell, C. (1991). A framework for comparing customer satisfaction across individuals and product categories. Journal of Economic Psychology, 12(2), 267-286.
Kaiser, H. F. (1958). The varimax criterion for analytic rotation in factor analysis. Psychometrika, 23(2), 187-200.
Keen, P., and Mackintosh, R. (2001). The freedom economy: Gaining the m-commerce edge in the era of the wireless Internet. Berkeley, CA: Osborne/McGraw-Hill Publication.
Keeney, R. L. (1999). The value of internet commerce to the customer. Management Science, 45(4), 533-542.
Khatibi, A. A., Ismail, H., and Thyagarajan, V. (2002). What drives customer loyalty: An analysis from the telecommunications industry. Journal of Targeting, Measurement and Analysis for Marketing, 11(1), 34-44.
Kim, M. K., Park, M. C., and Jeong, D. H. (2004). The effects of customer satisfaction and switching barrier on customer loyalty in Korean mobile telecommunication services. Telecommunications Policy, 28(2), 145-159.
Kristensen, K., Martensen, A., and Gronholdt, L. (1999). Measuring the impact of buying behaviour on customer satisfaction. Total Quality Management, 10(4/5), 602-614.
Kuo, Y. F. (2003). A study on service quality of community websites. Total Quality Management and Business Excellence, 14(4), 461-473.
Landrum, H., and Prybutok, V. R. (2004). A service quality and success model for the information service industry. European Journal of Operational Research, 156(3), 628-642.
Lee, G. G., and Lin, H. F. (2005). Customer perceptions of e-service quality in online shopping. International Journal of Retail and Distribution Management, 33(2/3), 161-176.
271-282.
McAlexander, J. H., Kaldenberg, D. O., and Koenig, H. F. (1994). Service quality measurement: Examination of dental practices sheds more light on the relationships between service quality, satisfaction, and purchase intentions in a health care setting. Journal of Health Care Marketing, 14(1), 34-39.
Olla, P., and Patel, N. V. (2002). A value chain model for mobile data service providers. Telecommunications Policy, 26(9/10), 551-571.
Parasuraman, A., Zeithaml, V. A., and Berry, L. L. (1985). A conceptual model of service quality and its implications for future research. Journal of Marketing, 49(4), 41-50.
Parasuraman, A., Zeithaml, V. A., and Berry, L. L. (1988). SERVQUAL: A multiple-item scale for measuring consumer perceptions of service quality. Journal of Retailing, 64(1), 12-40.
Parasuraman, A., Zeithaml, V. A., and Berry, L. L. (1994). Reassessment of expectations as a comparison in measuring service quality: Implications for further research. Journal of Marketing, 58(1), 111-124.
Park, C. H., and Kim, Y. G. (2006). The effect of information satisfaction and relational benefit of consumers’ online shopping site commitments. Journal of Electronic Commerce in Organizations, 4(1), 70-90.
Patterson, P. G., and Spreng, R. A. (1997). Modeling the relationship between perceived value, satisfaction and repurchase intentions in a business-to-business, services context: An empirical examination. International Journal of Service Industry Management, 8(5), 414-434.
Petrick, J. F. (2002). Development of a multi-dimensional scale for measuring the perceived value of a service. Journal of Leisure Research, 34(2), 119-134.
Pitt, L. F., Watson, R. T., and Kavan, C. B. (1997). Measuring information systems service quality: Concerns for a complete canvas. MIS Quarterly, 21(2), 209-221. Sheth, J. N., Newman, B. I., and Gross, B. L. (1991). Consumption values and market
choice. Ohio: South Western Publishing.
Sweeney, J. C., and Soutar, G. N. (2001). Consumer perceived value: The development of a multiple item scale. Journal of Retailing, 77(2), 203-220.
Tung, L. L. (2004). Service quality and perceived value’s impact on satisfaction, intention and usage of short message service (SMS). Information Systems Frontiers, 6(4), 353-368.
Turel, O., and Serenko, A. (2006). Satisfaction with mobile services in Canada: An empirical investigation. Telecommunications Policy, 30(5/6), 314-331.
Van Dyke, T. P., Kappelman, L. A., and Prybutok, V. R. (1997). Measuring information systems service quality: Concerns on the use of the SERVQUAL
questionnaire. MIS Quarterly, 21(2), 195-208.
Wang, Y., Lo, H. P., and Yang, Y. (2004). An integrated framework for service quality, customer value, satisfaction: Evidence from China's telecommunication industry. Information Systems Frontiers, 6(4), 325-340.
Westbrook, R. A. (1987). Product/consumption-based affective responses and postpurchase processes. Journal of Marketing Research, 24(3), 258-270.
Yang, Z., and Peterson, R. T. (2004). Customer perceived value, satisfaction, and loyalty: The role of switching costs. Psychology and Marketing, 21(10), 799-822. Yang, Z., Cai, S., Zhou, Z., and Zhou, N. (2005). Development and validation of an
instrument to measure user perceived service quality of information presenting Web portals. Information and Management, 42(4), 575-589.
Zeithaml, V. A. (1988). Consumer perceptions of price, quality and value: A means-end model and synthesis of evidence. Journal of Marketing, 52(3), 2-22. Zeithaml, V. A., Berry, L. L., and Parasuraman, A. (1996). The behavioral
consequences of service quality. Journal of Marketing, 60(2), 31-46.
Zeithaml, V. A., Parasuraman, A., and Malhotra, A. (2002). Service quality delivery through web sites: A critical review of extant knowledge. Journal of the Academy of Marketing Science, 30(4), 362-375.