Wu, Y.-L., Tao, Y.-H., and P.-C. Yang, Learning from the past and present: measuring internet banking service quality, Service Industry Journal, Vol. 32, No. 2, 2012
Learning from the Past and Present: Measuring Internet
Banking Service Quality
Abstract
Internet has played a pivotal role in transforming banking services into e-services. While several studies have examined the effective measurement of e-banking service quality, their lack of a holistic view has hindered accumulation of past knowledge. To address this issue, this study first reviews and summarizes the methodology, service quality dimensions, suggestions and limitations of seven e-banking service quality studies conducted in seven countries. An empirical study is then conducted to derive a first robust and comprehensive measure of e-banking service quality in a
Taiwanese context by compensating three shortcomings of a prior Taiwanese study. To improve
understanding of e-banking service quality, a comprehensive scheme is proposed that has managerial implications. The primary contribution of this study is to present a holistic view of e-service quality for e-banking with embedded cultural factor and to provide a rigorous measurement scale development procedure applicable to areas other than e-banking.
Keywords: Internet banking (e-banking), e-Service Quality (e-SQ), scale development, cultural
1. Introduction
Internet technology is widely applied in the service industry, and Internet banking (e-banking) is a prominent example. Theoretically, e-banking involves a customer connecting to bank computer systems via the Internet to access banking services without human contact. In this context, the majority of interactions between the bank and the customer are conducted digitally (Jayawardhena, 2004). Internet technology has evolved considerably over the years, such that numerous new developed e-banking services differ considerably from older systems (Lu, 2005; Khan and Mahapatra, 2009). At least 65% of customers in Taiwan are satisfied with their e-banking services because key issues for users, such as security and privacy, have been addressed and considerably improved (Pollster Online Survey, 2007). This high customer satisfaction contrasts with almost unanimously negative customer satisfaction from surveys conducted a few years ago (104 Survey, 2004; Pollster Online Survey, 2005).
Understanding Internet channel service quality thus is increasingly important (Mols, 2000). Particularly, Taiwan has only 23 million people, but who are served by 37 domestic banks, 30
local branches of foreign banks, 26 credit cooperatives, 276 credit departments of farmer’s associations, 25 credit departments of fisherman’s associations, 10 bills finance companies and 1 postal saving system (http://www.banking.gov.tw/ftp/stat/index/index-1.xls). In the current
competitive market, a good measurement scale that can provide a basis for future refinement and reassessment is crucial for sustainable development of banks.
The banking industry is not only competitive, but also its market is potentially big. As of June 2010, Taiwan’s domestic banks have an average asset of 31 trillion NT$ (Financial Supervisory Commission, 2010a) with a net asset averages 1.96 trillion NT$ (Financial Supervisory Commission, 2010b). At least 53 percent of the total Internet accessing population had used Internet banking in 2007 (104 Sruvey), which is among the 10 million Internet users in Taiwan (44% of the total population) due to the number 4 rank in the world for Taiwan’s high
percentage of fiber optical Internet availability (Find, 2008). Take Taishin bank for example, its e-banking channel has accounted 43% of the 2008 total transaction volume, which is a 140% growth from 2006. After the upgrade of e-banking in February, 2009, the transaction volume has increased 1 million transactions from one year ago, and over 40% of e-banking customers adopted new personalized calendar and customized functions (Taishin Bank, 2009). Furthermore, many simultaneous developments in Taiwan continue stimulating the growth of e-banking business, such as the Web shopping in Taiwan has reached a 300 billion NT$ market in 2009, far beyond the annual sales of 232 billion NT$ generated by the department stores as reported in the statistics published by the Ministry of Economic Affairs (United Daily News, 2010). E-banking trading increases due to customer needs on money transfer, paying fees and taxes, which generates synergistic effect on other e-banking business functions on money deposit, loans, exchange and financial management. (United Daily News, 2010). With a competitive and potentially big e-banking market in Taiwan, a robust and comprehensive e-banking service quality measurement is getting important in research and desirable in practice.
After conducting initial research in 2007, this study reviewed the literature on Internet banking service quality (e-banking SQ) from Germany, Hong Kong, India, Taiwan, Turkey, the United Kingdom and the United States between 2001 and 2010 (Jun and Cai, 2001; Jayawardhena, 2004; Bauer et al., 2005; Siu and Mou, 2005; Khan and Mahapatra, 2009; Akinci et al., 2010; Ho and Lin, 2010). On the one hand, this body of research contains too many versions of e-banking Web site service quality measurement to allow effective learning from the past, instead creating confusion. However, these studies, conducted in seven countries provide an excellent basis for a holistic view of e-banking SQ, and a robust and general e-SQ measurement for practical applications. Consequently, further organization and suggestions regarding these e-banking studies is desirable for researchers and practitioners.
Based on the above analysis, this study thoroughly reviews the above studies to abstract a comprehensive framework of e-banking SQ measurement. While doing this, the first robust and
comprehensive empirical e-banking SQ measurement study is also conducted in Taiwan to
address some of the issues raised in previous studies. This is critical to Taiwan’s e-banking
industry due to the competitive and growing market size. In addition. The similarities and differences of e-banking SQ dimensions across cultural context can be obtained by examining research results conducted in seven countries.. The rest of this paper is organized as follows:
Section 2 presents a literature review, and thus provides some background to the research design in Section 3, and the subsequent data analysis and discussion in Section 4. Conclusions are finally drawn in Section 5, along with a summary of its limitations and implications.
2. Literature Review
2.1Service Quality Model
With regard to customer-based measurements of service quality, a review of the growing body of literature on service quality suggests that two schools of thought dominate extant thinking, namely the Nordic school of thought, based on the two-dimensional model of Grönroos (1984) and the North American school of thought, based on the five-dimensional model of Parasuraman et al. (1985). For example, when developing a scale to measure traditional bank service quality, Bahia and Nantel (2000) and Aldlaigan and Buttle (2002) adopted the two-dimensional model while Karatepe et al. (2005) adopted the five-dimensional model.
Early service quality models from both schools have tended to conceptualize factors related to service quality as components of service quality. The SERVQUAL instrument provides an example, and comprises a 22-item scale for measuring service quality along five dimensions proposed by Parasuraman et al. (1988a,1988b) and later refined by Parasuraman et al. (1991, 1994a and 1994b). However, the SERVQUAL instrument has also generated debate regarding the most appropriate ways to assess SQ (Carman 1990; Cronin and Taylor 1992; Parasuraman et al., 1991, 1994a, 1994b;
Teas 1993). Furthermore, a global measure of web site service quality is likely to suffer the same criticisms surrounding whether the SERVQUAL scale is industry or context dependent (Yang et al., 2005).
Hence, given the phenomenal growth of e-services, a stream of research exists that aims to understand the dimensions of e-SQ and their relationship with overall performance. For example, Loiacono et al. (2000) proposed web quality (WebQual), a scale for rating websites on 12 dimensions. Yoo and Donthu (2001) then immediately adapted WebQual into a four dimensional SITE-QUAL measurement scale. However, Parasuraman et al. (2005) noted that neither WebQual nor SITE-QUAL capture all aspects of the purchasing process, and therefore cannot comprehensively assess site service quality.
In contrast with the general web quality structure of WebQual, Wolfinbarger and Gilly (2002, 2003) proposed .comQ and eTailQ as measures of web retail store quality. Based on the literature, Parasuraman et al. (2005) combined various concepts of online service quality (Loiacono, et al., 2000; Yoo and Donthu, 2001; Wolfinbarger and Gilly, 2002, 2003) in the most comprehensive work on e-SQ to date. Parasuraman et al (2005). used an empirical test and a multiple item scale to assess online shopping provider service quality. The final analytical results included 22 measurement items belonging to the four constructs for core service scale (E-S-QUAL), and 11 items belonging to the three constructs for recovery service scale (E-RecS-QUAL). Parasuraman et al. (2005) applied both E-S-QUAL and E-RecS-QUAL to empirically test two online retailers, Amazon and Walmart.
Previous studies provide important theoretical framework and research instruments. Nevertheless, when considering the natural differences between e-banking and e-retailers, E-S-QUAL and E-RecS-QUAL may be inappropriate for direct application in measuring e-banking SQ. Therefore, careful investigation of e-banking service quality is desirable.
2.2 Internet Banking Service Quality
application in terms of its service categories, satisfaction level, critical features, and service quality dimensions. Rose (2000) assessed the service quality of 23 U.S. Internet banks in terms of seven service categories and found that most exhibited unsatisfactory service quality. To enhance customer satisfaction, Jayawardhena and Foley (2000) suggested that features such as download speed, content, design, interactivity, navigation, and security are critical. Additionally, Jun and Cai (2001) identified six key dimensions strongly impacting customer satisfaction from among the 17 dimensions of Internet banking service qualities belonging to three broader categories via content analysis. A common limitation of the above studies was they did not apply formal procedures, as detailed in Parasuraman et al. (2005), to develop sustainable service quality measurement scales for Internet banks.
Other e-banking studies conducted in different countries adopted formal procedures for empirically validating SQ measurement scales Jayawardhena (2004) developed an instrument that mirrored the work of earlier researchers (Churchill, 1979; Parasuraman et al., 1988a) by sampling 1,000 e-bank users in the UK, and derived a 21-item parsimonious measure spread across five dimensions. Moreover, Bauer et al. (2005) developed another instrument based on SERVPERF (Cronin and Taylor, 1992) by sampling 280 e-bank users in Germany, and identified dimensions that could be reasonably classified into three service categories. Furthermore, Siu and Mou (2005) adapted the dimensions of e-SERVQUAL established by Zeithaml et al. (2000, 2002), applied them to a sample of 195 e-bank users in Hong Kong, and identified four analytical dimensions.
More recently, Khan and Mahapatra (2009) assessed overall service quality using regression analysis, based on a sample of 2,500 e-bank users in India, and identified four dimensions. Akinci et
al. (2010) adopted the E-S-QUAL and E-RecS-QUAL scale developed by Parasuraman et al.
(2005), applied it to a sample of 4,096 e-bank users in Turkey, and refined the E-S-QUAL scale to produce a more stable version for internet banks. Additionally in Taiwan, Ho and Lin (2010) applied factor analysis to a sample of 500 e-bank users and identified five dimensions.
Table 1- Summary of the e-banking SQ literature
Reference/
country Methodology Findings Suggestions Limitations
Jun and Cai (2001) / USA
1. Dimensions identified using critical incident technique . 2. Content analysis.
Seventeen dimensions and 45 items.
1. Collecting data directly from e-banking customers. 2. Using factor analysis. 3. Developing overall e-banking SQ and investigating customer satisfaction. 1. Sampled customer comments from bulletin board system.
2. May miss key dimensions such as customer compliments and complaints. Jayawardhena (2004) / UK
1. Initial items based on Parasuraman et al. (1988a, 1988b) and identified using focus group discussion. 2. Development method based on Parasuraman et al. (1988a, 1988b)
3. EFA, CFA and regression analyses.
Six dimensions and 26 items.
Continuing to use qualitative and quantitative techniques in different contexts.
N/A
Bauer et al. (2005) / Germany
1. Initial items based on Cronin and Taylor (1992) and Huizingh (2002), and identified using focus group discussion.
2. Development method based on Cronin and Taylor (1992) 3. EFA and CFA.
Six dimensions and 61 items.
1. Analyzing whether the identified measurement model can be generalized and applied to other portal types.
2. Investigating the relationship between the extracted quality dimensions and customer satisfaction or loyalty, respectively.
Only sampled from one bank.
Siu and Mou (2005) / Hong Kong
1. Initial items identified via focus group discussion (Internet users only).
2. Development method based on Zeithaml et al. (2000, 2002).
3. t-test, one-way ANOVA and multiple regression analyses.
Four dimensions and 19 items.
1. Using a larger sample. 2. Validating the model and extending the results to other industries and countries.
1. Only tested in Hong Kong. 2. Small respondent sample size (195). Khan and Mahapatra (2009) / India
1. Initial items from focus group discussion (Internet users only).
2. Factor analysis, correlation analysis and regression analysis.
Five dimensions and 26 items.
1. Identifying the relative importance of each dimension.
2. Including the provider (banker) perspective. 1. Small respondent sample size (1,143). 2. Testing in urban India. Akinci et al. (2010) / Turkey
1. Initial items based on Parasuraman et al. (2005) and identified via focus group discussion.
2. Development method based on Parasuraman et al. (2005). 3. CFA.
Seven dimensions and 28items.
Applying the E-S-QUAL and E-RecS-QUAL scales to different industries and culturally different countries.
N/A
Ho and Lin (2010) /Taiwan
1. Initial items based on Cristobal et al. (2007). 2. Development method based on Parasuraman et al. (1988a, 1988b).
3. Factor analysis, principal components analysis.
Five dimensions and 17 items.
Seeking a larger sample size to increase credibility.
1. Only sampled from one bank. 2. Small respondent sample size (135).
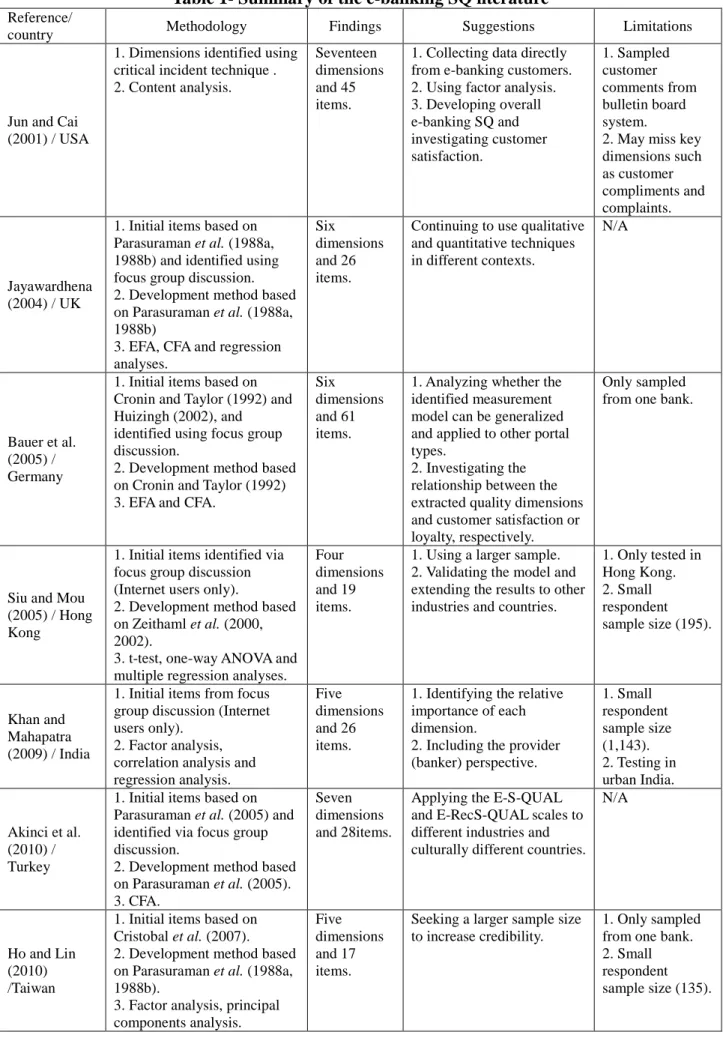
Table 1 summarizes the above seven e-banking SQ studies conducted from 2001 to 2010, and compares their methodologies, findings, suggestions and limitations, and this information is briefly analyzed below.
Regarding methodology, almost all of the studies used a single measurement scale adopted from the literature and then used focus group discussion to generate initial items, such as seen in
the methodology of Parasuraman et al. (2005).. Accordingly, we used the methodology of Parasuraman et al. (2005) as a basis for constructing a robust measurement scale since three prior studies were based on this methodology and the previous works from which it drew (Parasuraman et al., 1988a, 1988b; Zeithaml et al. 2000, 2002). A revised methodology of Parasuraman et al. (2005) is described in the Research Design subsection in Section 3.Regarding the findings, Jun and Cai (2001) used a less rigorous approach, content analysis, to
identify a comprehensive array of 17 dimensions, compared to four to seven dimensions in the other six studies. The differences and similarities among these dimensions are compared with the findings of this study in Section 4.6.
Regarding the suggestions, only one suggestion, raised by Akinci et al. (2010), regarding the application of the E-S-QUAL and E-RecS-QUAL scales to a culturally different country and a different industry has not been addressed. The remainder of the suggestions have been addressed, as follows: Jun and Cai (2001) proposed gathering data directly from e-banking customers, using factor analysis and developing overall e-banking SQ, as addressed in the other six studies. Jun and Cai (2001) and Bauer et al. (2005) also suggested investigating customer satisfaction, as addressed by Chou and You (2005) and Eriksson and Nilsson (2007). Furthermore, Jayawardhena (2004) suggested using both qualitative and quantitative techniques in different contexts. These techniques have been applied to different domains in e-travel (Ho and Lee, 2007), libraries (Hernon and Calvert, 2005) and online shops (Parasuraman et al., 2005), and to different countries, including India (Khan and Mahapatra, 2009), Turkey (Akinci et al., 2010) and Taiwan (Ho and Lin, 2010).
Three studies suggested using a larger sample size for increased credibility, as also seen in the limitation of these studies in Table 1. Nevertheless, a sample size of between 200 and 300 is considered adequate in related studies (Jayawardhena, 2004; Parasuraman et al., 1988a 1988b, 1994b) or is suggested as a rule of thumb for applying confirmatory factor analysis (CFA) by Gefen
et al. (2000), and most of these studies met this criterion. Khan and Mahapatra (2009) suggested
including the banker perspective, which has been addressed in this study and four others, as listed in Table 1 (Akinci et al., 2010; Bauer et al., 2005; Jayawardhena, 2004; Ho and Lin, 2010).
Regarding limitations, one common limitation involves only sampling from one bank (Bauer et
al., 2005; Ho and Lin, 2010), from urban populations (Khan and Mahapatra, 2009), or customer
comments from on online forums (Jun and Cai, 2001). Jayawardhena (2004) addressed this limitation by sampling consumer panel comprising over 10,000 e-bank users. Similarly, Siu and Mou (2005) also noted the study was conducted only in Hong Kong, but this limitation has been addressed by the other six studies conducted in six different countries. Finally, one unaddressed limitation is the possibility of missing key dimensions, since customer compliments and complaints tend to provide information about extremes of satisfaction (Jun and Cai, 2001).
The Taiwanese study conducted by Ho and Lin (2010) suffered two shortcomings as listed in Table 1: inadequate sample size (135) and only sampling users from one bank. Furthermore, a more robust EFA outcome should have been validated using the CFA method, as in Jayawardhena (2004) and Bauer et al. (2005). Thus, this work also conducted a new empirical study in Taiwan following the rigorous methodology summarized in Section 3 to remedy these shortcomings in Ho and Lin (2010) for the comparison task in Section 4.6.
3. Research Design
Based on the methods used in seven e-Banking SQ studies, a comprehensive methodology for developing SQ measurement can be summarized into a six-step process consisting of generating the scale items, refining the scale items, conducting the field test and collecting the data, confirming the
sample representation, performing exploratory factor analysis and the reliability test, and performing confirmatory factor analysis, a process which is also adopted in this study, as follows:
Step 1: Generate the scale items.
A comprehensive initial item set may be based on traditional SQ measurement scale studies such as Jayawardhena (2004) and Bauer et al. (2005), e-SQ measurement scale studies such as Akinci et al. (2010) and Ho and Lin (2010), focus group discussion such as Khan and Mahapatra (2009), or SQ related studies such as Parasuraman et al. (2005). In this study, unlike the investigations listed in Table 1, the scale items for the service content were extracted from the relevant literature on domestic and foreign Internet banks (Bauer et al., 2005; Calisir and Gumussoy, 2008; Chou and You, 2005; Deng et al., 2007; Eriksson and Nilsson, 2007; Jayawardhena and Foley, 2000; Jun and Cai, 2001; Lin et al., 2007; Siu and Mou, 2005; Vatanasombut et al., 2008; Yiu et al., 2007), SQ measurement methods (Carman, 1990; Cronin and Taylor, 1992; Parasuraman et al., 1994a, 1994b), and Web site SQ (Loiacono et al., 2000; Van Riel et al., 2001; Wolfinbarger and Gilly, 2002, 2003; Yang et al., 2005; Yoo and Donthu, 2001; Zeithaml et al., 2000, 2002). These factors provided the basis for designing the appropriate assessment questions.
Step 2: Refine the scale items.
The initial scale items must be refined to better characterize the target domain based on the opinions of the domain experts and users. This study interviewed administrators of Internet banks to clarify their e-service situations and perspectives, as suggested by Jayawardhena (2004), Khan and Mahapatra (2009) and Siu and Mou (2005). These items are then adjusted based on interviewee perceptions of the importance of each SQ attribute of e-banking.
Step 3: Conduct the field test and collect the data.
The composed questionnaire undergoes a field test involving a small sample. Based on the field test feedback, the questions are readjusted to finalize the formal questionnaire. This study randomly distributed the draft questionnaires to financial institutions, and the analyzed data set was
free of invalid questionnaires from respondents with limited or no e-banking experience.
Step 4: Confirm the sample representation.
The sample data used in a survey study must be assessed to determine their representativeness of the population. Accordingly, in the sample profile analysis, our data is also compared to three other larger national samples that were conducted in 2007. One-Way ANOVA analysis is used to examine their significant differences on certain profile items. Step 5: Perform exploratory factor analysis (EFA) and the reliability test.
With a representative sample data set, exploratory factor analysis is performed to identify the dimensions of the scale items, followed by a reliability test of the identified dimensions. This study uses the Principal Component Analysis and Varimax with Kaiser Normalization rotation in SPSS to perform orthogonal rotation. Furthermore, to increase convergent and discriminate validity, the following three criteria are applied in the EFA to obtain the final assessment dimension of the e-banking SQ (Hair et al., 2006):
1. Retaining items with eigenvalues exceeding 1.
2. Deleting items with factor loadings smaller than 0.5 or with large factor loadings on two factors.
3. Excluding factors that contain only one question.
According to Chang (2001), the Cronbach’s α coefficient of each dimension, and each question, should be calculated. The questions with low relevant coefficients are then deleted to increase the relevant coefficient of the dimension.
Step 6: Perform confirmatory factor analysis (CFA).
To validate the factor structure, CFA is performed following the EFA. Most EFA was conducted to assume a certain relationship. For example, the two-level relationship between the SQ dimension and service quality (Jayawardhena, 2004; Bauer et al., 2005; Khan and Mahapatra, 2009; Ho and Lin, 2010) or to simply apply regression analysis instead of CFA
(Jayawardhena, 2004; Siu and Mou, 2005; Khan and Mahapatra, 2009). This study adopted a
more rigorous approach for identifying the parsimonious model among the competing models of the n-factor model, as implemented by Noar (2003). The best-fit parsimonious model is also examined via analyses of reliability, convergent validity, and discriminant validity to assess its legitimacy.
4. Establishment of e-banking SQ Assessment Dimension 4.1. Design of Scale
According to the first three steps in the above procedure, relevant service attributes were first identified using the service items provided by the Internet banks, relevant scales addressed in the literature, and interviews with 23 administrators from 12 Internet banks in Taiwan. These attributes were then used as a basis for creating 76 appropriate survey questions following repeated reorganization and revision. Service quality was measured using the “perceptions-only” approach as adopted in Jayawardhena (2004). The 76 service quality items were transformed into Likert-scales, and the respondents were asked to indicate their perceptions of their Internet bank with regard to each item using a five-point scale ranging from “5 =strongly agree” to “1= strongly disagree.”
After completing the draft questionnaire, a small-sample pretest was conducted on e-banking users who were able to freely express their opinions. A descriptive analysis was conducted to delete unnecessary questions identified by the majority of the respondents, and to revise questions with unclear or inappropriate meanings. Following several modifications, the formal questionnaire was finalized and included 44 questions.
4.2Sample Statistics
The formal questionnaire was randomly distributed in front of the offices of major financial institutions in Taiwan. Since the sample respondents come from different banks, the collected data was rich in content compared with that of Ho and Lin (2010). A total of 432 questionnaires were completed, of which 24 were either incomplete or completed with repetitive or predictable answers, while a further 96 respondents had no e-banking experience. Thus the final samples comprised a
total of 312 (72.22%) valid questionnaires, as summarized in Table 2.
Table 2– Profiles of the respondents
Item Items Frequency (%) Item Items Frequency (%)
Gender
Male 167 (53.53%)
Years of using the Internet bank
Less than one year 89 (28.53%) 1 to 2 years 128 (41.03%)
Female 145 (46.47%) 3 to 4 years 81 (25.96%)
More than 5 years 14 (4.49%)
Age
18 to 25 years old 89 (28.53%)
Residential area
North Taiwan 143 (45.83%) 26 to 35 years old 156 (50.00%) Central Taiwan 45 (14.42%) 36 to 45 years old 48 (15.38%) South Taiwan 121 (38.78%) Over 46 years old 19 (6.09%) East Taiwan 3 (0.96%)
Degree High school 22 (7.05%) Monthly income Under NT$30,000 124 (39.74%) College 154 (49.36%) NT$30,000 to NT$100,000 172 (55.13%) Graduate school or above 136 (43.59%) More than NT$100,000 16 (5.13%)
Most frequently used services Account management 159 (50.96%) Occupation Student 45 (14.42%) Transfer transaction 91 (29.17%) Information industry 67 (21.47%) Financial investment 31 (9.94%) Manufacturing industry 72 (23.08%) Credit card transaction 16 (5.13%) Financial insurance 23 (7.37%)
Others 15 (4.81%) Military, government
employees and teachers 31 (9.94%) Service industry 52 (16.66%) Health industry 22 (7.05%)
According to Step 4 of the scale development process, a One-Way ANOVA was used to determine the differences in gender, age, years of using Internet banking, and occupation between the mean of the present sample and the samples from the Pollster Online Survey (2007, 3,621 usable respondents), the 104 Survey (2007, 3,013 usable respondents), and the InsightXplorer, Ltd. survey (2007, 2,160 usable respondents). The P-values all exceeded 0.05, demonstrating no significant difference between the present sample and the other three large-survey samples. The lack of any significant difference indicates that the collected information has certain reference value.
4.3 Exploratory Factor Analysis
conducting EFA and CRA with over 200 respondents in each case as suggested by Gefen et al. (2000). Therefore, this study used the entire sample for both the EFA and the CFA, an approach deemed acceptable in some of the literature, including Jamal et al. (2006), Başol (2008) and Byrne (2001).
Before implementing the EFA in accordance with Step 5, the values of the Bartlett test of sphericity (9067.077) and the corresponding P-value (0.000) from the sample data were calculated. Since both values reached significance, the data set was suitable for performing EFA. Additionally, the Kaiser-Meyer-Olkin value was calculated as 0.858, very close to 1, indicating that the data sampling was appropriate.
For the EFA, this study deleted question items with factor loadings below 0.5 or that contained multiple factors with high factor loadings (Hair et al., 1998). This study used 44 items to repeatedly perform EFA until all the items met the factor-loading criteria. Following four runs, 21 questions and five factor dimensions were obtained. When the largest common features occurred within the same dimension, these five-factor dimensions were respectively named and defined as follows: efficiency, privacy/security, reliability, responsiveness, contact.
Table 3– Summarized results of the exploratory factor analysis n =312
These five factors explained 49.033% of the variance with a high combined reliability of 0.987. For the individual factor reliability, Cronbach’s α ranged from 0.943 to 0.987 for these five factors, indicating good internal consistency among the items within each dimension. The findings indicated that the functions of a bank web site in relation to the five dimensions are strongly emphasized by customers and regarded as the essence of the supplied services. Table 3 summarizes the quality attributes of each factor. The extremely high value of each factor loading indicates that these five dimensions have good construct validity.
To confirm the consistency of the items within the same factor dimension, the Cronbach’s α values of the 21 items were calculated to assess whether any item might have too low a value causing inconsistency corresponding to its factor dimension. The analytical results showed that the factor dimensions have very high internal consistencies exceeding 0.6. Meanwhile, deleting certain questions could not increase the scale reliability, with total scale reliability exceeding the generally recommended level, 0.7 (Chang, 2001). These results confirmed that the 21 questions and their
Efficiency
EF1. My Internet bank offers abundant financial services information. EF2. Using my Internet bank is not time consuming.
EF3. Completing transactions through my Internet bank is fast and easy. EF4. I can easily find information I need from my Internet bank.
EF5. My Internet bank offers multimedia functions that match provided content. Privacy/security
PS1. Making transactions through my Internet bank is safe.
PS2. My Internet bank protects my privacy and transaction information. PS3. My Internet bank has basic safety protection functions.
PS4. My Internet bank has clear transaction safety policies. Reliability
RE1. Termination during a transaction does not happen in my Internet bank. RE2. The transaction processing system of my Internet bank is error free. RE3. My Internet bank offers 24/7 services.
RE4. My Internet bank performs services truly and reliably, which reassures me. Responsiveness
RS1. The administrator of my Internet bank responds to my needs happily and rapidly. RS2. My Internet bank sincerely solves whatever problems I encounter.
RS3. My Internet bank offers sufficient service resources.
RS4. The professional knowledge of the service representatives at my Internet bank is adequate to solve problems I encounter.
Contact CO1. CO2. CO3. CO4.
My Internet bank offers a customer service email address. My Internet bank offers a telephone service hotline. My Internet bank offers a message board service. Contacting my Internet bank is very easy.
corresponding five dimensions representing the e-banking SQ assessment scale were highly reliable.
4.4 Assumption Test for the Confirmatory Factor Analysis
Before applying the CFA, this study conducted a multivariate normality test on the skewness and kurtosis of each measurement item to confirm the assumed normal distribution of the data for using CFA. Extreme skewness exists if the absolute skewness exceeds 3.0 and is problematic if the absolute value of kurtosis exceeds 10.0 (Kline, 1998). Following the calculation, the skewness fell within the range -2.81 to 0.697 and the kurtosis fell within the range -0.74 to 7.45 in all cases, well within the limits of acceptability. Therefore, the 21 observed variables have near normal distribution, and it is reasonable to apply the maximum likelihood-based SEM method for parameter estimation.
4.5 Confirmatory Factor Analysis
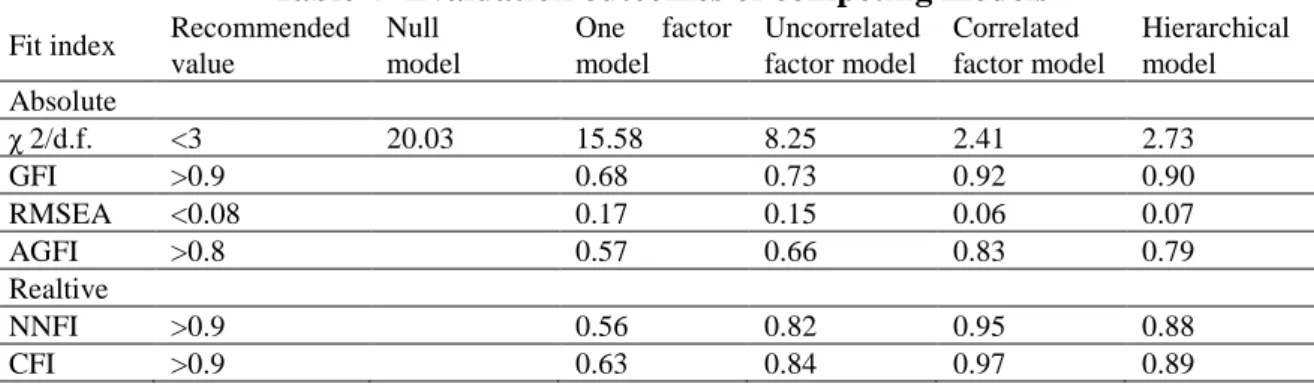
This research adopted five nested models null model suggested by Noar (2003), namely one factor model, uncorrelated factor model, correlated factor model and hierarchical model, and achieved best fit using four absolute indices of chi-square difference (χ2./d.f), goodness of fit index (GFI), adjusted GFI (AGFI), and root mean square error of approximation (RMSEA), and two relative indices of nonnormed fit index (NNFI) and comparative fit index (CFI). The recommended values are χ 2/d.f. less than 3.0 as suggested by Bagozzi and Yi (1988), GIF exceeding 0.9 as suggested by Etezadi-Amolo and Farhoomand (1996), RMSEA less than 0.08 as suggested by Hair et al. (2006), and NFI, NNFI, and CFI all exceeding 0.9 as suggested by Bentler and Bonett (1989), respectively. Table 4 shows that the null model, one-factor model and uncorrelated factor model do not meet the recommended values of all six fit indices. The correlated factor model is the only one satisfying all six recommended fit indices, while the hierarchical model only meets the recommended values of the χ2/.d.f and GFI.
Table 4- Evaluation outcomes of competing models
Fit index Recommended value Null model One factor model Uncorrelated factor model Correlated factor model Hierarchical model Absolute χ 2/d.f. <3 20.03 15.58 8.25 2.41 2.73 GFI >0.9 0.68 0.73 0.92 0.90 RMSEA <0.08 0.17 0.15 0.06 0.07 AGFI >0.8 0.57 0.66 0.83 0.79 Realtive NNFI >0.9 0.56 0.82 0.95 0.88 CFI >0.9 0.63 0.84 0.97 0.89
The correlated model suggests that these five SQ dimensions can be appropriately discriminated from each other while at the same time also interrelated with one another. Meanwhile, a correlated model also suggests the possibility of a higher-order model (Noar, 2003). Even though the preferred hierarchical model failed to meet three fit indices, it is only 0.01 or 0.02 short from meeting the recommended values of AGFI, NFI, and CF as seen in Table 4. In other words, the hierarchical model is still very promising and thus implies a potential second-order factor to account for the relationships among the five SQ dimensions in this study.
With the correlated model as the best fit model, the five SQ dimensions can only be examined individually, which may reflect a mixture of outcomes in e-banking SQ studies. For instance, all five dimensions are significantly related to the overall service quality in the work of Jayawardhena (2004), whereas only three of the four dimensions are in the study of Siu and Mou (2005). The loss from not being able to sum these five SQ dimensions into one scale may constitute further empirical work in developing a shorter version of the scale (such as one item per subscale), which may allow the researchers additional space to assess other important constructs in the survey, as well as reduce the response burden on participation (Noar, 2003). For the objective of this review and comparative study, these benefits of the hierarchical model are not as critical as in a pure scale development study.
As a result, the correlated factor model is identified as the parsimonious model depicted in Figure 1, with the path diagram and standardized parameter estimations.
examined to assess its reliability, convergent validity, and discriminant validity. Regarding the reliability of the correlated-factor model, all the individual item reliabilities fall within the range 0.50 to 0.68, and thus meet the value of greater than 0.5 suggested by Hair et al. (2006) while the composite reliability (Efficiency: 0.89; Privacy/security: 0.82; Reliability: 0.83; Responsiveness: 0.81; Contact: 0.85) all significantly exceed the value of 0.6 suggested by Bagozzi and Yi (1988). That is, the five factors have good reliability.
Regarding the convergent validity, all the standardized parameter values (λ) fall within the range 0.53 to 0.83, higher than the minimum value of 0.45 suggested by Jöreskog and Sörbom (1996). This phenomenon indicates that all the measurement variables adequately reflect the latent variables constructed by this study. Furthermore, the average variance extracted for the five latent variables exceeds the ideal value of 0.5 (Fornell and Larcker, 1981), indicating the contribution of the constructed latent variables exceeds that of the biases].
To further test the discriminant validity of the correlated-factor model, this study adopted a complementary assessment proposed by Anderson & Gerbing (1988) to “determine whether the confidence interval (+two standard errors) around the correlation estimate between the two factors includes 1.0.” The latent variables all exhibit good discriminant validity because the pairwise reliability intervals do not include 1.00.
Internal structural testing shows that all the measurement items have adequate reliability and every factor has good constructive reliability. The convergent validity test and the two discriminant validity tests demonstrate the need for the five factors in this correlated-factor model.
4.6 Categories and Dimensions of e-Banking SQ
With a further robustly derived measure of e-banking SQ in Taiwnese context, along with existing robust measures from other cultural contexts, this section intents to establish the degree to which dimensions of e-banking SQ are consistent across contexts, and the degree to which they differ and how.
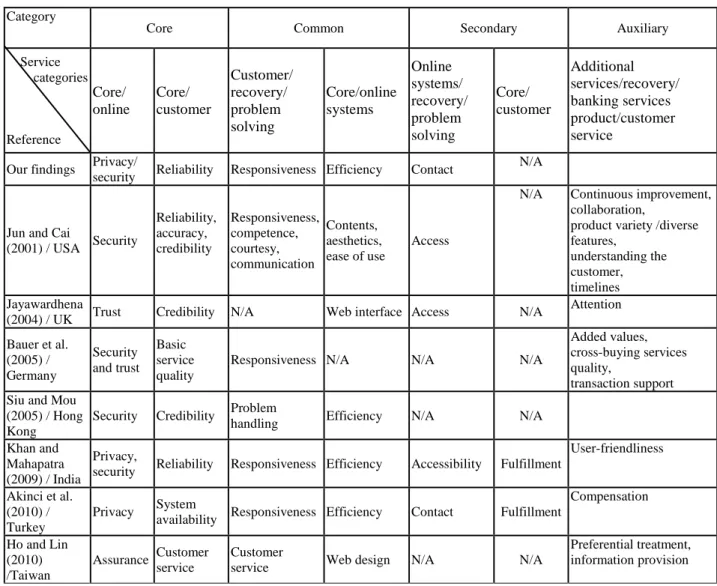
As indicated in the column “Findings” in Table 1, seven different e-Banking studies obtained different numbers of SQ dimensions. Table 5 summarizes the comparison of the dimensions from the past seven e-banking SQ studies and the present study based on their labels and contents under different labeling schemes. Particularly, situations exist where a single dimension is associated with two related concepts such as privacy and security (Bauer et al. , 2005) or one concept across two dimensions such as customer service (Ho and Lin, 2010). On the contrary, situations may exist where a single concept might belong to two dimensions but is classified into a single dimension as a judgment call in this study, such as basic service quality (Bauer et al., 2005).
Furthermore, based on their cohesiveness across eight e-banking studies, four categories of dimensions are formed, including core, common, secondary and auxiliary categories. Specifically, the core category contains dimensions in all eight studies while the common category contains dimensions only in the majority of the eight studies (seven to be exact). Meanwhile the secondary category contains dimensions in only a minority of eight studies (two to four), and the auxiliary category contains unique dimensions each of which occurs in only one study. Rather than classifying SQ dimensions into functional categories, such as the core service and recovery service categories used by Parasuraman et al. (2005), this study aims to provide a categorical guideline for selecting SQ dimensions based on cross-cultural studies on the e-banking industry. Different categories from Jun and Cai (2001), Bauer et al. (2005) and Parasuraman et al. (2005) are also indicated in the second row to facilitate easy mapping with the four categories defined by this study. Supplementary explanations of the dimensions are then given.
Table 5 – Comparison of dimensions among eight e-bank SQ
Category
Core Common Secondary Auxiliary
Service categories Reference Core/ online Core/ customer Customer/ recovery/ problem solving Core/online systems Online systems/ recovery/ problem solving Core/ customer Additional services/recovery/ banking services product/customer service
Our findings Privacy/
security Reliability Responsiveness Efficiency Contact
N/A
Jun and Cai
(2001) / USA Security Reliability, accuracy, credibility Responsiveness, competence, courtesy, communication Contents, aesthetics, ease of use Access
N/A Continuous improvement, collaboration,
product variety /diverse features,
understanding the customer, timelines Jayawardhena
(2004) / UK Trust Credibility N/A Web interface Access N/A
Attention Bauer et al. (2005) / Germany Security and trust Basic service quality
Responsiveness N/A N/A N/A
Added values, cross-buying services quality,
transaction support Siu and Mou
(2005) / Hong Kong
Security Credibility Problem
handling Efficiency N/A N/A
Khan and Mahapatra (2009) / India
Privacy,
security Reliability Responsiveness Efficiency Accessibility Fulfillment
User-friendliness
Akinci et al. (2010) / Turkey
Privacy System
availability Responsiveness Efficiency Contact Fulfillment
Compensation Ho and Lin (2010) /Taiwan Assurance Customer service Customer
service Web design N/A N/A
Preferential treatment, information provision
First, the core category contains two dimensions, privacy/security and reliability. The privacy/security dimension also conveys the concepts of trust and assurance. As noted by Wolfinbarger and Gilly, (2002), security is better defined together with privacy in an online environment. Meanwhile, Tao et al. (2007) concluded that identifying security as a key factor while missing trust and privacy represents a research limitation. Furthermore, while reviewing the concept of assurance, Ho and Lin (2010) stated that “the lack of confidence motivated by the absence of security and privacy in an online environment is one of the main obstacles to e-commerce development.” Therefore, this dimension conveying the group concepts of privacy, security, trust and assurance has long been considered a crucial issue for e-banking users (Siu and Mou, 2005). The reliability dimension is related to accuracy, credibility, basic service quality, system availability
and customer service. Jayawardhena (2004) defined credibility as “delivering the promised service to customers at all times,” which precisely matches reliability as defined by Kettinger and Lee (1994) and closely related to the measurement items of the system availability in Akinci et al. (2010). The accuracy also reflects the reliability dimension defined as “…accuracy of service promises…” in Parasuraman et al. (2005). Ho and Lin (2010) identify service reliability as the primary dimension to which customer services are related. Finally, as noted by Bauer et al. (2005), basic service quality reflects the “reliability of the service provider,” which implies reliability as a critical condition for basic e-banking service demand.
Second, the common category contains two dimensions, responsiveness and efficiency. The responsiveness dimension relates to competence, courtesy, communication, problem handling and customer service. Users encountering problems (Siu and Mou, 2005) treated responsiveness as part of customer service to resolve problems or questions (Ho and Lin, 2010), thus providing a channel of communication for assessing e-banking service courtesy and competence. Although Jayawardhena (2004) included responsiveness in the initial dimensions, the corresponding items were classified into trust and credibility in the secondary factor analysis. The efficiency dimension is related to website design, web interface, aesthetics/contents/ease of use and transaction support. Jayawardhena (2004) indicated that SQ “in e-banking is largely determined by Web elements,” and ease of use and aesthetics can be considered web elements since ease of use and an aesthetically appealing website positively impact attracting the attention of potential users (Jun and Cai, 2001). Moreover, users wish to access a website, search for information and log out with minimal effort (Siu and Mou, 2005), and thus content organization crucially influences efficiency since it influences information searching speed.
Third, the secondary category contains two dimensions, contact and fulfillment. The contact dimension also conveys the concept of access. Jun and Cai (2001) adopted the definition of access used by Zeithaml et al. (1990), namely “approachability and ease of contact of service”, renamed
contact in Parasuraman, et al. (2005) as the SQ evolved into e-SQ. Jayawardhena (2004) defined access as “…service through a number of points of entry…”, which implies access obtains the contact service via various channels. The fulfillment dimension is identified in both Khan and Mahapatra (2009) and Akinci et al. (2010). Particularly, Akinci et al. (2010) indicated that fulfillment covers the behind-the-scenes infrastructure of websites, and helps prioritize firm resources to improve electronic service quality.
Finally, the auxiliary category contains 13 dimensions, each of which are uniquely identified in one study. Despite some cross-cultural commonalities (Espinoza, 1999), the evidence suggests that culture significantly influences the definition of the SQ construct (Kettinger et al., 1995). Since the seven studies reviewed here were conducted in seven different countries, these unique dimensions can be attributed to cultural differences (Malhotra et al., 1994). Taking the user-friendliness dimension (Khan and Mahapatra, 2009) as an example, since e-banking is a new delivery channel for banks in India, most traditional bank customers are now novices and thus desire highly user-friendly features. Another example is the preferential treatment dimension (Ho and Lin, 2010), which are offered as a result of highly competitive e-banking market in Taiwan.
5. Conclusions and Limitations
Through a review of seven e-banking SQ measurement studies conducted in seven countries during the past decade, this investigation holistically reviewed the methodology, suggestions and limitations associated with the development of e-banking SQ measurement. Furthermore,
through an empirical investigation that was robustly and comprehensively conducted in Taiwan to address some shortcomings of a previous study, similarities and differences of e-banking SQ dimensions across cultural context can be obtained. Thus, a holistic view of the dimensions and categories of SQ measurement is also presented in this research. Based on this diverse literature, including diversity in terms of both time and country, two broad conclusions can be obtained as follows:
First, a comprehensive method for developing SQ measurement for e-banking has been consolidated into a six-step process, comprising scale item generation, scale item refinement, field testing and data collection, confirmation of sample representativeness, exploratory factor analysis and reliability testing, and confirmatory factor analysis. Particularly, the combined methods of EFA and CFA and the competing-model approach for the parsimonious model (Noar, 2003) are critical to achieving a robust research outcome. Only three out of seven studies listed in Table 1 applied the combined methods of EFA and CFA, and none used the competing-model approach for the parsimonious model. The managerial implication is that any researcher or practitioner wishing to develop a robust SQ measurement can easily do so by referring to section 3 of this study for a concise description of the necessary methodology and section 4 of this study for a description of its application.
Second, a comprehensive SQ measurement for e-banking is only feasible owing to the work completed in seven different countries in the past literature and this study. The proposed e-banking SQ measurement comprises four categories of dimensions, and is derived differently from past studies. The uniqueness of this comprehensive SQ measurement for e-banking lies in the fact that it automatically encompasses the cultural factors of seven countries, which represents a significant contribution in an empirical study of this kind. Specifically, the core and common categories contain the dimensions, namely privacy/security, responsiveness, efficiency and contact, which are generally applicable to both Asian and Western contexts, while the secondary and auxiliary categories contain the dimensions that may be culturally or regionally different. The managerial implication is that researchers or practitioners can safely adopt the dimensions in the core and common categories, and then can carefully select the dimensions in the secondary and auxiliary categories to meet their objectives and needs. Notably, this dimension selection process can be performed by referring to the other classification schemes in past studies, as listed in Table 5.
scale development. As noted in section 2.2, among the suggestions and limitations proposed by the past seven studies, only one suggestion and one limitation remain unaddressed. The first unaddressed limitation was the inclusion of customer compliments and complaints in the key dimension, which may be related to the satisfactory and dissatisfactory experiences of customers identified by Jun and Cai (2001). Second, the unaddressed suggestion, made by Akinci et al. (2010), was to apply the E-S-QUAL and E-RecS-QUAL scales to a culturally different country and a different industry. Although this study addressed culturally different countries through reviewing the literature comprising studies conducted in seven countries, none of the other six studies has addressed the initial application of E-S-QUAL and E-RecS-UQLA. Finally, all the results were based on data collected from a user population with actual experience of e-banking, creating a potential sample bias through the exclusion of individuals who browsed the site but did not use the e-banking services. Failure to use e-banking services could result from various reasons, ranging from safety concerns to operational failure. A true population of Internet users, including those not currently using e-banking services, is desirable to confirm the generalizability of this study. Although the research on measuring e-banking SQ is extensive, further research addressing these three limitations is highly desirable.
References
104 Survey (2004, 2007). Last accessed from http://www.104survey.com/104Survey/portal/index.jsf. (2007/12/28)
Akinci, S., Atilgan-Inan, E. & Aksoy, S. (2010). Re-assessment of E-S-Qual and E-RecS-Qual in a pure service setting. Journal of Business Research, 63(3), 232-240.
Aldlaigan, A. H., and Buttle, F. A. (2002). SYSTRA-SQ: a new measure of bank service quality.
International Journal of Service Industry Management 13(4), 362-381.
Anderson, J. C., and Gerbing, D. W. (1988). Structural equation modeling in practice: A review and recommended two-step approach. Psychological Bulletin, 103, 411-423.
Bahia, K., and Nantel, J. (2000). A reliable and valid measurement scale for the perceived service quality of banks. International Journal of Bank Marketing 18(2), 84-91.
Bagozzi, R. P., and Yi, Y. (1988). On the evaluation of structural equation mode. Journal of Academy of Marketing Science 16(1), 74-94
Başol, G. (2008). Validity and Reliability of the Multidimensional Scale of Perceived Social Support-Revised, with a Turkish Sample. Social behavior and personality, 36(10), 1303-1314.
Bauer, H. H., Hammerschmidt, M., and Falk, T. (2005). Measuring the quality of e-banking portals. International Journal of Bank Marketing, 23(2), pp. 153-175
Bentler, P. M., and Bonett, D. G. (1989). Significance tests and goodness of fit in the analysis of covariance structures. Psychological Bulletin, 88, 588-606.
Byrne, B. M. (2001). Structural Equation Modelling with Amos: Basic Concepts Applications and
Programming. Lawrence Erlbaum Associates, New Jersey.
Calisir, F., and Gumussoy, C. A. (2008). Internet banking versus other banking channels: Young consumers’ view. International Journal of Information Management, 28, 215- 221.
dimensions. Journal of Retailing, 66(1), 33-55.
Chang, S. X. (2001). Research Method. Taichung, Taiwan,Tsang Hai Book Publishing Co. Chou, W. X., and You, X. Y. (2005). The study about Internet banking service quality, relation
quality, and customer loyalty. Journal of Business Administration, 65, 31-60.
Churchill, G. A. Jr. (1979), A Paradigm for Developing Better Measures of Marketing Constructs, Journal of Marketing Research, Vol.16, February, pp. 64-73.
Cristobal, E., Flavia´n, C. and Guinalı´u, M. (2007), Perceived e-service quality: measurement validity and effects on consumer satisfaction and web site loyalty, Managing Service Quality, 17(3), pp. 317-40.
Cronin, J. J. J., and Taylor, S. A. (1992). Measuring service quality: a reexamination and extension.
Journal of Marketing, 56(3), 55-68.
Deng, W. J., Liao, M. T., and Ma, Y. C. (2007). Confirmation of key service quality attributes of Internet banking - Three factor theory and the application of IPA. Journal of Quality, 14(4), 351-365.
Eriksson, K., and Nilsson, D. (2007). Determinants of the continued use of self-service technology: The case of Internet banking. Technovation, 27, 159-167.
Espinoza, M.M., 1999. Assessing the cross-cultural applicability of a service quality measure: a comparative study between Quebec and Peru. International Journal of Service Industry
Management, 10(5), 449–468.
Etezadi-Amolo, and Farhoomand, A. F. (1996). A structural model of end user computing satisfaction and user performance. Information and Management, 30(2), 65-73.
Financial Supervisory Commission, Executive Yuan, R.O.C. (2010a). Financial statistics index (June 2010) last access on August 22, 2010 from http://www.banking.gov.tw/ftp/stat/index/index-1.xls. Financial Supervisory Commission, Executive Yuan, R.O.C. (2010b). Domestic bank return on asset
http://www.banking.gov.tw/ftp/stat/roa_e.xls.
Find (2008). Last accessed on August 20 fromhttp://www.find.org.tw/find/home.aspx?page=news&id=5411. Fornell, C.R. and Larcker, D.F. (1981). Structural equation models with unobservable variables and
measurement error. Journal of Marking Research, 18, pp. 39-50
Gefen, D., Straub, D.W., and Boudreau , M. (2000). Structural Equation Modeling Techniques and Regression: Guidelines, Communications of AIS, 4, Article 7.
Grönroos, C. (1984). A service quality model and its marketing implications. European Journal of
Marketing, 18(4), 36-44.
Hair, J., Anderson, R., Tatham, R., and Black, W. (1998). Multivariate data analysis. Upper Saddle River.
Hair Jr., J. F., Black, W. C., Babin, B. J., Anderson, R. E., and Tatham, R. L. (2006). Multivariate
Data Analysis 6th. Prentice-Hall.
Hernon, P., and Calvert, P. (2005). E-service quality in libraries: Exploring its features and dimensions. Library and Information Science Research, 27, 377-404.
Ho, C. T. B., and Lin, W. C. (2010) Measuring the service quality of internet banking: scale development and validation. European Business Review, 22(1), pp.5-24.
Ho, C. I., and Lee, Y. L. (2007). The development of an e-travel service quality scale. Tourism
Management, 28, 1434-1449.
Huizingh, E.K.R.E. (2002). The antecedents of web site performance. European Journal of Marketing, 36, pp. 1225-48.
InsightXplorer Ltd. (2007). Last accessed on December 28, 2007 from http://www.insightxplorer.com/index.html.
Jamal, A. Davies, F. Chudry, F., and Mohamed, A. M. (2006). Profiling consumers: A study of Qatari consumers’ shopping motivations. Journal of Retailing and Consumer Services, 13, 67-80.
Jayawardhena, C., and Foley, P. (2000). Changes in the banking sector-the case of Internet banking in the UK. Journal of Internet Research: Networking and Policy, 10(1), 19-30.
Jayawardhena, C., (2004). Measurement of Service Quality in Internet banking: The Development of an Instrument. Journal of Marketing Management, 20, 185-207.
Jun, M., and Cai, S. (2001). The key determinants of Internet banking service quality: A content analysis. International Journal of Bank Marketing, 19(7), 276-291.
Jöreskog, K. G., and Sörbom, D. (1996). LISREL 8: Structural Equation Modeling. Scientific Software International Cop., Chicago.
Karatepe, O. M., Yavas, U., and Babakus, E. (2005). Measuring service quality of banks: Scale development and validation. Journal of Retailing and Consumer Services, 12, 373-383. Kettinger, W. J. and Lee, C. C. (1994). Perceived service quality and user satisfaction with the
information service function, Decision Sciences, 25(5/6), 737-766.
Kettinger, W.J., Lee, C.C., Lee, S., (1995). Global measures of information service quality: a cross-national study. Decision Sciences, 26(5), 569–588.
Khan, M. S., and Mahapatra, S. S. (2009). Service quality evaluation in internet banking: an empirical study in India. Int. J. Indian Culture and Business Management, 2(1), pp.30-46 Kline, R. B. (1998). Principles and Practice of Structural Equation Modeling. New York: The
Guilford Press.
Lin, Y. B., Dong, Y. J., and Li, Y. H. (2007). The application of customer relationship management towards Internet banking services: The influence of website service quality towards
customer loyalty. Chiao Tung Management Review, 27(1), 57-85.
Loiacono, E. T., Watson, R. T. and Goodhue, D. L. (2000). WeBQualTM: A Web site quality instrument, Worcester, Mass: Worcester Polytechnic institute, Working paper.
Lu, J. Z. (2005). The current development situation of Internet banking. Financial and Monetary
Malhotra, N.K., Ulgado, F.M., Agarwal, J., Baalbaki, I.B., 1994.International services marketing: a comparative evaluation of the dimensions of service quality between developed and
developing countries. International Marketing Review, 11 (2), 5–15.
Mols, N. P. (2000). The Internet and banks strategic distribution channel decisions. International
Journal of Bank Marketing, 17(6), 295-300.
Noar, S. M. (2003). The role of structural equation modeling in scale development. Structural
Equation Modeling, 10(4), 622-647.
Parasuraman, A., Zeithaml, V. A., and Berry, L. L. (1985). A Conceptual Model of Service Quality and Its Implications for Future Research. Journal of Marketing, 49(4), 41-50.
Parasuraman, A., Zeithaml, V. A., and Berry, L. L. (1988a). SERVQUAL a multiple-item scale for measuring consumer perceptions of service quality. Journal of Retailing, 64(1), 35-48. Parasuraman, A., Zeithaml, V. A., and Berry, L. L. (1988b). Communication and control processes
in the delivery of service quality. Journal of Marketing, 52(2), 35-48.
Parasuraman, A., Zeithaml, V. A., and Berry, L. L. (1991). Refinement and reassessment of the SERVQUAL scale. Journal of Retailing, 67(4), 420-450.
Parasuraman, A., Zeithaml, V. A., and Berry, L. L. (1994a). Reassessment of expectations as a comparison standard in measuring service quality: implications for further research. Journal
of Marketing, 58(January), 111-124.
Parasuraman, A., Zeithaml, V. A., and Berry, L. L. (1994b). Alternative scales for measuring service quality: A comparative assessment based on psychometric and diagnostic criteria. Journal of
Retailing, 70(3), 201-230.
Parasuraman, A., Zeithaml, V. A., and Malhotra, A. (2005). E-S-QUAL: a multiple-item scale for assessing electronic service quality. Journal of Service Research, 7(3), 213-233.
Pollster Online Survey (2005, 2007). Last accessed on December 28, 2007 from http://www.pollster.com.tw/. Rose, S., (2000). The truth about online banking, Money, 29(4), 114-122.
Siu, N. Y. M., and Mou, J. C. W. (2005). Measuring service quality in internet banking: The case of Hong Kong. Journal of International Consumer Marketing, 17(4), pp.99-116.
Tao, Y.-H., Chang, C.R. and Chen, C, P., (2007) Unmet adoption expectation as the key to
e-marketplace failure: A case of Taiwan’s steel industry, Industrial Marketing Management, 36, , 1057-1067.
Taishin Bank (2009). Last access on September 11, 2009 from
http://www.taishinbank.com.tw/main/news.jsp?rowId=12288.
Teas, R. K., (1993). Expectations, performance evaluation, and consumers' perceptions of quality.
Journal of Marketing. 57, 18-34
United Daily News (2010). Last access on June 16, 2010 from http://money.udn.com/wealth/storypage.jsp?f_MAIN_ID=327&f_SUB_ID=3008&f_ART_ID= 212891.
Van Riel, ACR, Liljander V, Jurriens P. (2001). Exploring consumer evaluations of e-services: a portal site. International Journal of Service Industry Management. 12(4), 359–77. Vatanasombut, B., Igbaria, M., Stylianou, A. C., and Rodgers, W. (2008). Information systems
continuance intention of web-based applications customers: The case of online banking.
Information and Management, 45, 419-428.
Wolfinbarger, M. and Gilly, M. C. (2002). comQ: Dimensionalizing, Measuring and Predicting
Quality of the E-tail Experience. Measuring and Predicting Quality of the E-tail Experience,
Marketing Science Institute, Cambridge, MA., No. 02-100.
Wolfinbarger, M., and Gilly, M. C. (2003). eTailQ: Dimensionalizing, Measuring and Predicting Etail Quality. Journal of Retailing, 79(3), 183-198.
Yang, Z., Caib, S., Zhouc, Z., Zhou, N. (2005). Development and validation of an instrument to measure user perceived service quality of information presenting Web portals. Information
Yiu, C. S., Grant, K., and Edgar, D. (2007). Factors affecting the adoption of Internet Banking in Hong Kong-implications for the banking sector. International Journal of Information
Management, 27, 336-351.
Yoo, B., and Donthu, N. (2001). Developing a scale to measure the perceived quality of an Internet shopping site (SITEQUAL). Quarterly Journal of Electronic Commerce, 2(1), 31-46. Zeithml, V A., Parasuraman, A. and Berry, L.L. 1990. Delivering quality service: balancing
customer perceptions and expectations. New York: The Free Press.
Zeithaml, V. A., Parasuraman, A., & Malhotra, A. (2000). E-Service Quality: Definition, Dimensions and Conceptual Model. Cambridge, MA. Marketing Science Institute
Zeithaml, V. A., Parasuraman, A., and Malhotra, A. (2002). Service quality delivery through Web sites: A critical review of extant knowledge. Journal of the Academy of Marketing Science, 30(4), 362-375.