College of Management
I-Shou University
MASTER THESIS
Analysis the Relationship among Service Quality,
Customer Satisfaction, and Customer Loyalty with
Hotel Industry in Hanoi Vietnam
Advisor: Jesse Yu-Chen Lan
Co-advisor: Nguyen Quang Vinh
Graduate Student: Ha Thi Ngan
Abstract
The purpose of this study is to analysis the relationship among service quality, tourist satisfaction and customer loyalty with hotel industry in Hanoi. Total 300 questionnaires were sent to visitors, there are 255 feedback questionnaires. After removed the invalid question, the remaining 210 questions were analysis, the response rate is 85% and 82.3 % of valid rate, from the regression equation of standardized model. This study shows that all factor of SERVQUAL model have positive relationship on the customer satisfaction with hotel industry in Hanoi. Also this study confirms the positive relationship of satisfaction of tourists and loyalty to the hotel. From the analysis of t- test and ANOVA, the result shows that there is only the gender of customer has different level of loyalty with Hanoi hotel service. Remaining of other demographic characteristic of customer do not have the different level of satisfaction among customer demographic (age, job, purpose, nation and frequency).
TABLE OF CONTENTS
Chapter I Introduction ... 1
1.1.Background ... 1
1.2. Objectives of the study ... 1
1. 3. Research questions ... 2
1.4. Contributions of thesis ... 2
1. 5. Scope study... 2
Chapter II: Literature review ... 3
2.1. Overview of hotel business in Vietnam ... 3
2.2 Overview of Hanoi tourism and hotels industry ... 3
2.3 Tourist satisfaction with hotel service ... 3
2.4 Service quality model ... 4
2.5. The satisfaction of tourists and hotel loyalty ... 5
2.6 The theory of model research... 6
2.7 Research model and hypothesis ... 6
Chapter III. Method of study ... 8
3.1. Introduction ... 8
3.2 Population ... 8
3.3 Sample size ... 8
3.4 Structure variables ... 8
3.5 Data analysis ... 8
3.5.1. Reliability analysis ... 8
3.5.2Exploratory factor analysis ... 8
3.5.3Linear regression ... 9
3.5.4 ANOVA and T-test ... 9
Chapter IV Data Analysis ... 10
4.1 Tourist demographic ... 10
4.2. Reliability ... 12
4.3 Factor analysis ... 13
4.3.1 Factor analysis of independent factors ... 13
4.3.2 Factor analysis for the dependent variable ... 14
4.4 Testing the research model ... 15
4.4.1 Pearson correlation coefficient ... 15
4.5 t-test and ANOVA ... 19
4.5.1 The different level of loyalty between genders of customer ... 19
4.5.2 The differnent of customer loyalty among age group ... 20
4.5.3 The differnent of customer loyalty among job group ... 20
4.5.4 The different level of loyalty between nations of customer ... 21
4.5.5 The differnent of customer loyalty among purpose of tourist ... 21
4.5.6 The different level of loyalty between frequencies of customer... 22
Chapter V Conclusion and recommendation ... 24
5.1 Conclusion ... 24
5.2 Recommendation ... 25
5.3.1 Academic contribution ... 25
5.3.2 Applications in Management ... 26
5.4. Limitations of the study ... 26
Reference:... 27
Appendix ... 30
TABLE OF TABLES
Table 4.1 Profile of tourist ... 10
Table 4.2 Reliability analysis ... 12
Table 4.3 Factor analysis of independent factors ... 13
Table 4.4 Factor analysis for the dependent variable... 15
Table 4.5 Pearson correlation analysis ... 15
Table 4.6. Results of regression analysis of five factors of SERVQUAL and
customer satisfaction ... 16
Table 4.7 Results of regression analysis of SERVQUAL and customer
satisfaction ... 17
Table 4.8 Results of regression analysis of customer satisfaction and loyalty ... 19
Table 4.9 The different level of loyalty between sex of customer... 20
Table 4.10 The different of customer loyalty among age group ... 20
Table 4.11 The different of customer loyalty among job group ... 21
Table 4.14 The different level of loyalty between Nation of customer ... 21
Table 4.13 The differnent of customer loyalty among purpose of tourist ... 22
TABLE OF FIGURES
Figure 2.2 shows the research model ... 5
Figure 2.1. The Model 5 gap in service quality ... 7
Chapter I Introduction 1.1 Background
According to the Business Insider, in 2014 Vietnam was ranked 6th out of 10 safety tourist destinations in the world to go. In which, Vietnam was ranked second globally in happiness levels and 45th on the level of safety. Vietnam's advantages include political stability, there is no threat from terrorism and religious conflicts and ethnic groups, and the image of Vietnam is seen as a new destination in the world. However, the tourism industry and the entertainment have been considered as the untapped potential of Vietnam and the inherent lack of sustainability.
In the study of the world related to the satisfaction and loyalty of tourists to the hotel, scholars have used many different models: A Parasuraman, Zeithaml and Berry (1990); Munusamy and Mun Chiellah (2010). According to Suman and Garg, (2012), quality of service has greatly affected the level of customer satisfaction, When tourists perceived the quality of services through a comparison of previous experiences, the cost of money and the quality of service they received customer will lead to satisfaction and loyalty with destination, the Truong and King (2009) suggested that the tourists feel satisfied with customer service of Hotels, they will introduce (Word of Mouth) to friends and their relatives. This study uses a model of previous studies to test the reality of the level of satisfaction and customer loyalty for hotels in Hanoi Poor service quality is one of the causes of return rate to Vietnam's tourism industry in general and the hotel industry in particular (in Vietnam is 15%, while Thailand is 50%, Malaysia 30% (Saigon Business, 2014). Some research on Vietnam's tourism has conducted a survey on the quality of hotel service in Vietnam (Bui, 2011, Lai and Vinh 2013). However, these studies often consider hotels as an element of the tourism industry that has not had the hotel observational studies as a separate industry.
1. 2. Objectives of the study
From the above analysis, the purpose of this study was to:
- Analysis the factors affecting satisfaction and customer loyalty in the process of using the service at the hotel in Hanoi
- Introduce a model study on satisfaction and customer loyalty for hotel industries - Provide marketing policies consistent with the market segments for hotels, and propose solutions to meet customer satisfaction.
1. 3. Research questions
To reach the objectives of study there are some research question raised:
- Are there any relationship among service quality and customer satisfaction with hotel in Hanoi?
- Service quality and customer satisfaction with hotel in Hanoi?
- Is there any relationship between customer satisfaction and loyalty with hotel in Hanoi?
- Are there any differences among tourist demographic with the level loyalty with hotel in Hanoi?
1. 4. Contributions of thesis
Through this study the authors will conduct the empirical research to contribute the empirical evident to service quality theory as well as the tourism industry theory. The study will help the hotel manager have a better overview of the factors affecting satisfaction and customer loyalty. Recommendations and solutions are discussed to enhance the quality of services and branding of the hotel.
1. 5. Scope study
The study will examine the entire theory of satisfaction and loyalty and real quality of hotel services in Hanoi. Research will be conducted modeling the factors affecting satisfaction and loyalty.
Chapter II: Literature review 2. 1. Overview of hotel business in Vietnam
From the survey of hotels business documents, author was noticed that hotels in Vietnam are on the rise, accounting for an important position in the economy. According to statistics from the General Department of Tourism, in 2015, “Vietnam's tourism continues having a very high growth rate with 7.9 million international tourists, and domestic tourists reached 26. 4 million, revenue from tourists reached 130 trillion, up. Expected in 2020, Vietnam will welcome 10 - 10.5 million international tourist and 47- 48 million domestic tourists and created 3,000,000 jobs”.
2.2 Overview of Hanoi tourism and hotels industry
According to the survey of CBRE Vietnam - property market research in Hanoi showed that, by the end 2012, Hanoi hotel industry have total 8,200 rooms, up 7.7% compared to 2011 also this research show that “there are more than a half of hotel supplier concentrated in two districts: Hoan Kiem and Ba Dinh (11 hotels 4-5 stars and 25 3-star hotel)”. With the orientation to become a tourist center of the country, Hanoi is focusing on the tourism market. Along with the strong investment in infrastructure for tourism, the number of hotels is increasing year by year. However, through literature survey, author found that the quality of hotels service in Hanoi still considered a weak point of the Hanoi tourism sector (Vneconomy.vn).
2.3 Tourist satisfaction with hotel service
The term of “tourist’s satisfaction” derived from the term of “customer satisfaction "in the field of Marketing. According to Ha (2011), customer satisfaction depends on the feeling about product compares with expectations of customers. If satisfaction is lower than expectation, the buyer is not satisfied; if expectation is appropriate, customer will be satisfaction. To measure customer satisfaction with the product/service, it is based on a comparison between the products/services feeling and service expectations.
Satisfaction survey is “one of the most essential tools that used to collect information related to the opinions of tourists on hotels” as showed by Barsky & Labagh (1992)”. The researchers used the model of “expectations met ", this model weighs the importance of specific properties, and concluded that the positive relationship satisfaction ready to go back to the hotels and tourist attractions. The direct impact of the model based on satisfaction related to the response of consumers to improve
product quality. Chen & Tsai (2007) has conducted research on the choice of destination and hotel, showed that satisfaction is an extension of the general joy or satisfaction of tourist and satisfaction is often the result of the trip experience and expectations. For further testing, Chi & Qu (2008) with a similar conclusion: “satisfaction with attributes (operating in the same manner as the perceived quality) is a prerequisite for overall satisfaction, satisfaction with individual attributes and overall satisfaction are two determinants of loyalty”. Awareness the importance of satisfaction in tourism development, the study applies the theoretical of SERQUAL model (Service Quality) of Parasuraman et al (1988) to assess the level of tourist satisfaction; analysis of factors affecting satisfaction and proposes solutions to improve the tourist satisfaction with hotel services in Hanoi.
SERVQUAL (Parasuraman et al, 1988) has been considered as the best measurement of the service quality. Nearly two decades later, many researchers have focused efforts to prove the effectiveness of the SERVQUAL. Parasuraman et al, (1994) continuous testing and review different theories, and said that the scale SERVQUAL achieve reliability and value. SERVQUAL measuring service quality based on the perception of the customers using the service.
2.4 Service quality model
SERVQUAL is including two sections of scales with 22 statements. The first section in order to determine the customer's expectations for this type of business services in general. The second part is to identify the customer's perception of the services performance. This is based on specific services businesses surveyed to assess. Results of research in order to realize the gap between customers perceived quality of services performed by the enterprise and customers' expectations for service quality. SERVQUAL model-specific, quality of service is defined as follows:
Quality of service = the level perceived - Expected value
While the using of model quality and distance as a basis for evaluating the quality of service is also much debated. Cronin & Taylor (1992) with research on SERVPERE model show that “the level of customer base on the implementation of the business services reflects the quality of service. According to the model SERVPERE: Quality of Service = Level feel”.
results show that components of the quality of service are not the same in each industry and each service different markets.
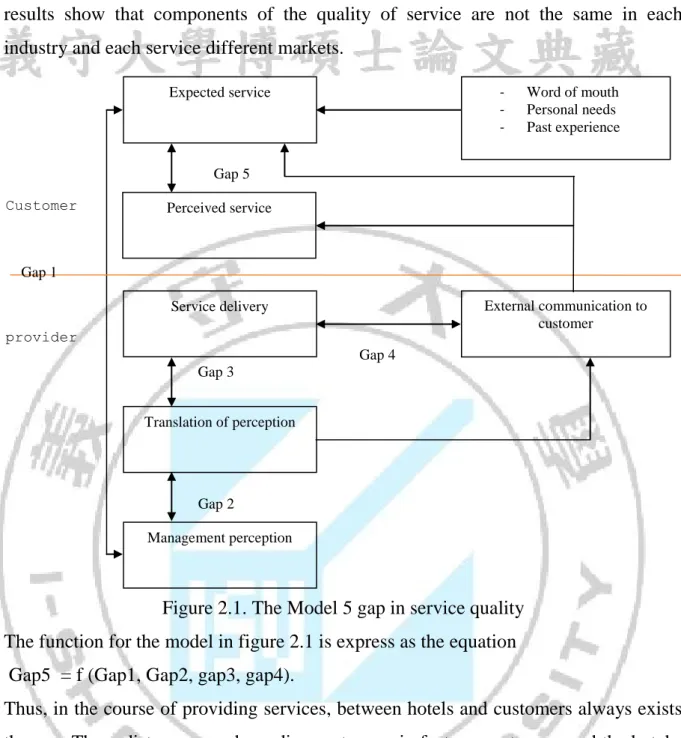
Figure 2.1. The Model 5 gap in service quality The function for the model in figure 2.1 is express as the equation Gap5 = f (Gap1, Gap2, gap3, gap4).
Thus, in the course of providing services, between hotels and customers always exists the gap. These distances are depending on two main factors: customers and the hotels. The larger distance showed the ability of hotels with meeting the needs of customers as low. Therefore, service quality management administrator is essentially "the service quality gap". Hotels want to meet the expectations and requirements of customers, or to improve, maintain the quality of service provision should apply synchronization solutions for governance, narrowing the gap associated with the process service provider.
2.5. The satisfaction of tourists and hotel loyalty
To determine the level of customer satisfaction with a particular property, the previous studies have used different tools to create distance score based on the difference between expectations and perceptions with the provision of specific services related to
External communication to customer Expected service Translation of perception Management perception Perceived service Service delivery - Word of mouth - Personal needs - Past experience Customer provider Gap 1 Gap 4 Gap 5 Gap 3 Gap 2
hotels (Parasuraman et al, 1990). This method is not comprehensive because it only takes into account the expected elements of products and services offered. In marketing, “due to the influence by the choice of tourist hotels to consumption of goods and services and intend to return (loyalty)” as mentioned by Korzay & Alvarez, (2005). Barsky & Labagh (1992) introduced disconfirmation model to measure by nine items "about expectations" balancing factor attributes - special importance. This model was tested with data collected from 100 subjects through random selection of customers. As a result, customer satisfaction has correlated with a willingness to return. The satisfaction of tourists is very important in tourism marketing and determining factor of success because it affects a large selection of hotels, consumer products and services, and decided to return.
Kuusik et al (2011) noted that the loyalty of tourists is seen as intention to return and recommend the destination to others. Similarly, Kuenzel & Katsaris (2009) described the behavior after the visit as intended to return (intention to buy / loyalty) and introduced through word of mouth (WOM). Moreover, Kuenzel & Katsaris (2009) explained that “the relative importance of each attribute overall impression should be investigated because of dissatisfaction may occur micro assessing economic differences use test products and services”. Chi & Qu (2008) concluded that “attribute satisfaction is a prerequisite for overall satisfaction, and attributes of satisfaction and overall satisfaction were two decisive factors to loyalty”.
2.6 The theory of model research
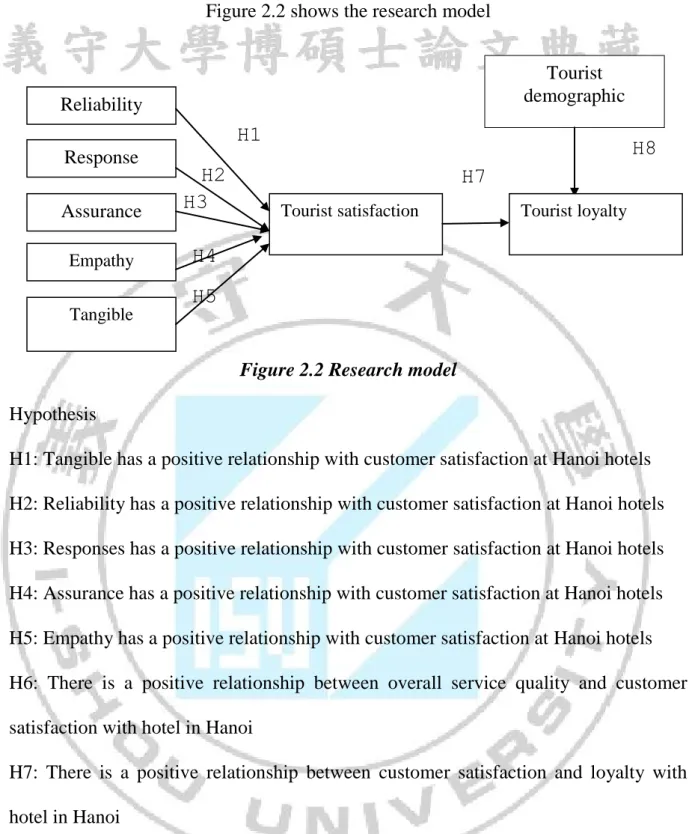
The study used the theoretical framework of Parasuraman (1988), SERVQUAL consider two main aspects of the quality of service as a result service providers and research services through five criterial: reliability, response, assurance, empathy and tangible.
Figure 2.2 shows the research model
Figure 2.2 Research model
Hypothesis
H1: Tangible has a positive relationship with customer satisfaction at Hanoi hotels H2: Reliability has a positive relationship with customer satisfaction at Hanoi hotels H3: Responses has a positive relationship with customer satisfaction at Hanoi hotels H4: Assurance has a positive relationship with customer satisfaction at Hanoi hotels H5: Empathy has a positive relationship with customer satisfaction at Hanoi hotels H6: There is a positive relationship between overall service quality and customer satisfaction with hotel in Hanoi
H7: There is a positive relationship between customer satisfaction and loyalty with hotel in Hanoi
H8: There are differences among tourist demographic with the level loyalty with hotel in Hanoi? Tourist demographic Tourist satisfaction Reliability Response Assurance Empathy Tangible Tourist loyalty
H1
H2
H3
H4
H5
H7
H8
Chapter III. Method of study 3. 1. Introduction
In this study, the questionnaire is designed as Likert from 1- strongly disagree and 5- strongly agree to conduct the survey.
3.2 Population
Sampling is considered favorable and reasonable because the answer would be easy to receive and answer the questions that do not take much time and cost. Questions will be distributed to 10 hotels in Hanoi; the goal is to collect 300 samples of the survey questions different units. Subjects of the population are domestic tourists and international have stayed at the hotel in Hanoi in May 6-7 2015
3.3 Sample size
MacCallum and his colleagues (1999) cited studies Gorsuch, he suggested that “the sample size should be five times the number of questions. This study has a total of 23 questions in the questionnaire”. Therefore, minimum standards for the sample size of this study is 29 x 5 = 115.
3.4 Structure variables
Research using SERVQUAL model of Parasuraman (1988) for 5 attributes of quality of service, in addition to price development and demographic variables were considered for testing in this study. Besides variables of satisfaction and loyalty of the tourists this study will be based on the model of Chen & Tsai (2007).
3.5 Data analysis
3.5.1. Reliability analysis
The meaning of the evaluation Cronbach’s alpha scale considers it a red flag or not the same concept. In other words, in an index scale has demonstrated high Cronbach alpha of the respondents were asked to understand the same concept. And the answer homogenous - similar - each observed variable of scale. As recommended the Cronbach’s alpha should be greater than .7 for variable consistence index.
3.5.2 Exploratory factor analysis
When exploring factor analysis EFA (Exploratory Factor Analysis) in addition to ensuring "value convergence" (convergence of the items on the first factor), they must ensure "value distinction" (belonging to and factors must be distinguished from other factors).
As an illustration, when one load items at the same time to 2 or more factors, to ensure "value distinction" is the same load factor of 1 items such as load factors up to a difference of 0.3 the last time that you retain this item and it will belong to that load factors are highest (of course, to the terms and conditions load factor> 0.5). Otherwise, you consider this type of item because it did not meet the guarantee "distinct value".
3.5.3 Linear regression
In the semi-experimental study (quasi-experiment), k hip researchers may be able to change (manipulate) the independent variable, so there is often noise variables appear. We tried to remedy this situation with specific statistical methods that use multiple regression. In multivariate regression relationship of the dependent variable (outcome) and independent variables (effects) are evaluated in the control variables other noise. The purpose of regression: 1) forecast (prediction): learn / discover the factors that could predict a phenomenon (outcome variable); 2) explain (explanation): learn / detection systems / processes or causes a phenomenon.
3.5.4 ANOVA and T-test
For the test of the difference between the overall research expertise this study use t- test and analysis of variance (ANOVA) with p value to find the difference in demographic of tourist with satisfaction and loyalty.
Chapter IV Data Analysis 4.1 Tourist demographic
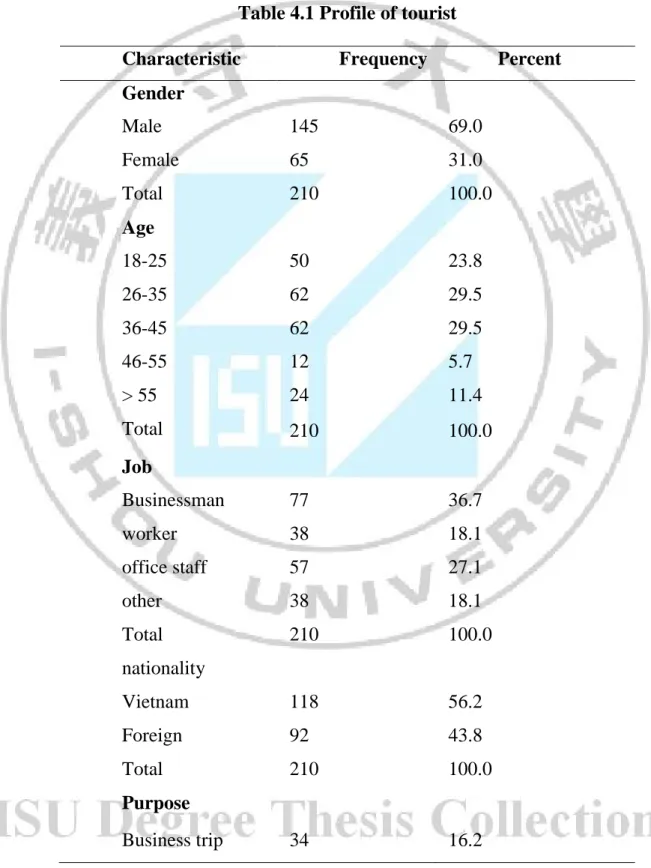
Total 300 questionnaires were sent to visitors, there are 255 feedback questionnaires. After removed the invalid question, the remaining 210 questions were analysis, the response rate is 85% and 82,3 % of valid rate, Table 4.1 show the profile of tourist.
Table 4.1 Profile of tourist
Characteristic Frequency Percent
Gender Male 145 69.0 Female 65 31.0 Total 210 100.0 Age 18-25 50 23.8 26-35 62 29.5 36-45 62 29.5 46-55 12 5.7 > 55 24 11.4 Total 210 100.0 Job Businessman 77 36.7 worker 38 18.1 office staff 57 27.1 other 38 18.1 Total 210 100.0 nationality Vietnam 118 56.2 Foreign 92 43.8 Total 210 100.0 Purpose Business trip 34 16.2
Tourism 142 67.6 Visit relative 34 16.2 Total 210 100.0 Frequency second time 59 28.1 first time 151 71.9 Total 210 100.0
According to Table 4.1, Total 210 tourists have been investigated in which male tourists accounted for 69. % and female tourists accounted for 31%. This shows that almost customers in this study is men.
Results showed that tourist who is from 18-25-year-old count for 23%. Meanwhile age group of 26-35 and from 36-55 were 29.5% occupied. Tourists from ages of 46-55 and over 55, respectively 5.7% and 11.4%. This shows that tourists to Hanoi is located mainly between the ages of 26-46.
Concerning occupational travelers, results indicate that there are 77 people who are businessmen accounted for 36.7% while the workers have accounted for 18.1% and 27.1% are office staff and others job counted for 18.1%. Hanoi is the center of cultural - Economic - political of the national, so it attracted many businessmen travelers. Besides visiting for entertainment they also have the goal of finding business opportunities in Hanoi. It is reasonable for explanation of why businessmen travelers to Hanoi is majority in this study.
On the nationality of travelers, in this survey the authors divided in to two type of nationality of which domestic tourists (nationality of Vietnam) accounted for 56.2% and international tourists accounted for a proportion is 43.8%.
Related to purpose of visitor to Hanoi, there are 16.2% is for business trip, the people who went to Hanoi for tourism purpose is 67.6% count for majority while people who visit Hanoi for seeing relatives is 16.2%.
Total 210 tourists are asked in this study for frequency of visit to Hanoi, there are 28.1% of tourist who is stay in this hotel for the second time and first time of stay in the Hanoi hotel is 71.9.
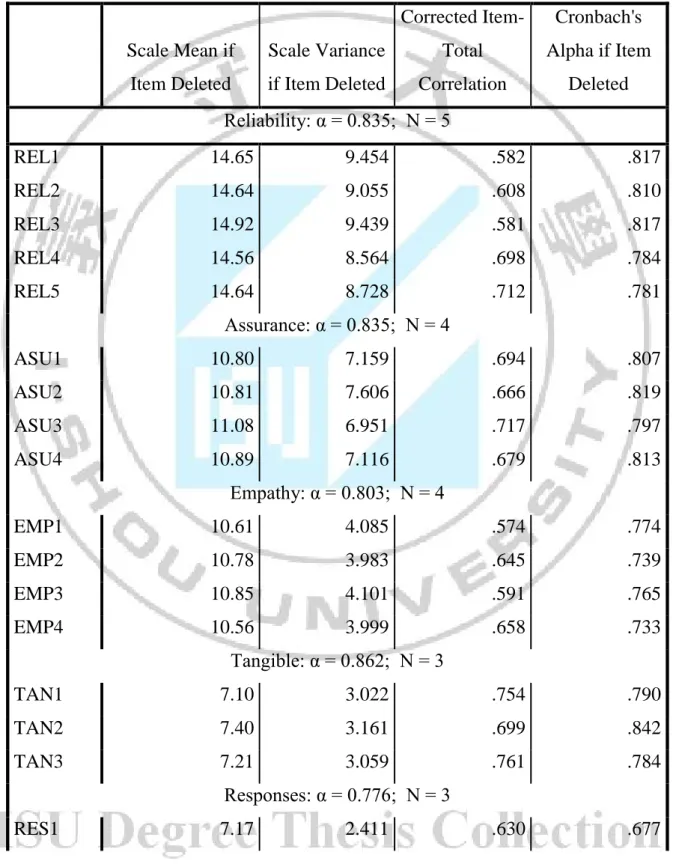
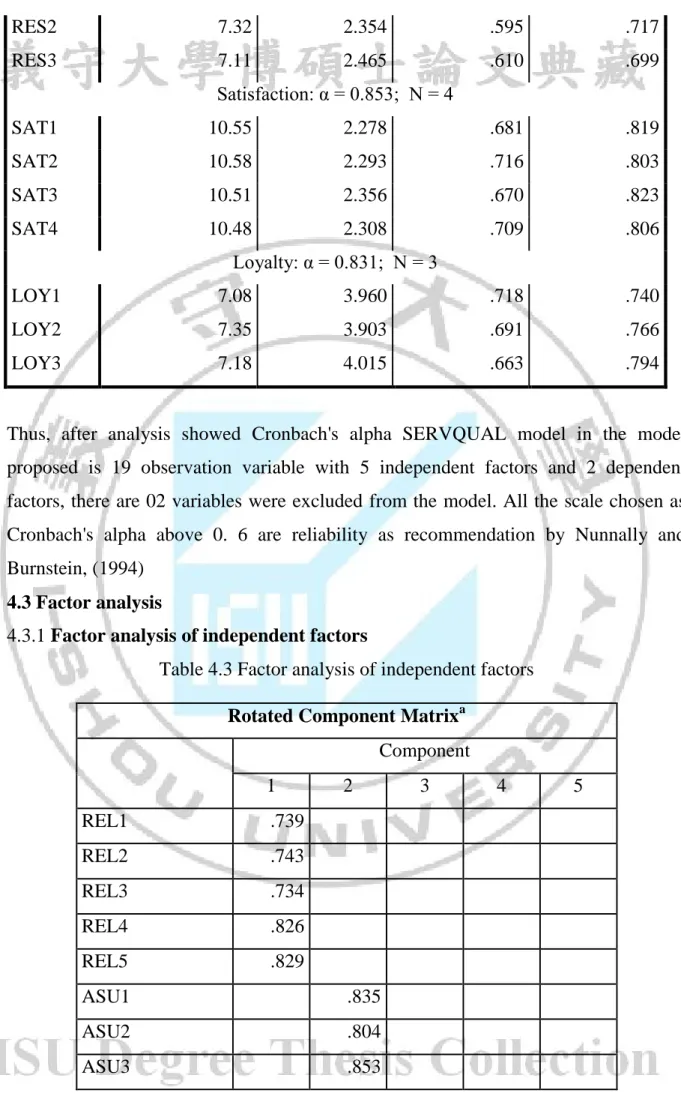
4.2. Reliability
Table 4.2 is shown the Reliability analysis after removed 2 observation have a corrected item - total correlation is less than 0.3 include: The physical medium in active service at the hotel very attractive and the hotel has convenient trading hours (tangible factor)
Table 4.2 Reliability analysis
Scale Mean if Item Deleted Scale Variance if Item Deleted Corrected Item-Total Correlation Cronbach's Alpha if Item Deleted Reliability: α = 0.835; N = 5 REL1 14.65 9.454 .582 .817 REL2 14.64 9.055 .608 .810 REL3 14.92 9.439 .581 .817 REL4 14.56 8.564 .698 .784 REL5 14.64 8.728 .712 .781 Assurance: α = 0.835; N = 4 ASU1 10.80 7.159 .694 .807 ASU2 10.81 7.606 .666 .819 ASU3 11.08 6.951 .717 .797 ASU4 10.89 7.116 .679 .813 Empathy: α = 0.803; N = 4 EMP1 10.61 4.085 .574 .774 EMP2 10.78 3.983 .645 .739 EMP3 10.85 4.101 .591 .765 EMP4 10.56 3.999 .658 .733 Tangible: α = 0.862; N = 3 TAN1 7.10 3.022 .754 .790 TAN2 7.40 3.161 .699 .842 TAN3 7.21 3.059 .761 .784 Responses: α = 0.776; N = 3 RES1 7.17 2.411 .630 .677
RES2 7.32 2.354 .595 .717 RES3 7.11 2.465 .610 .699 Satisfaction: α = 0.853; N = 4 SAT1 10.55 2.278 .681 .819 SAT2 10.58 2.293 .716 .803 SAT3 10.51 2.356 .670 .823 SAT4 10.48 2.308 .709 .806 Loyalty: α = 0.831; N = 3 LOY1 7.08 3.960 .718 .740 LOY2 7.35 3.903 .691 .766 LOY3 7.18 4.015 .663 .794
Thus, after analysis showed Cronbach's alpha SERVQUAL model in the model proposed is 19 observation variable with 5 independent factors and 2 dependent factors, there are 02 variables were excluded from the model. All the scale chosen as Cronbach's alpha above 0. 6 are reliability as recommendation by Nunnally and Burnstein, (1994)
4.3 Factor analysis
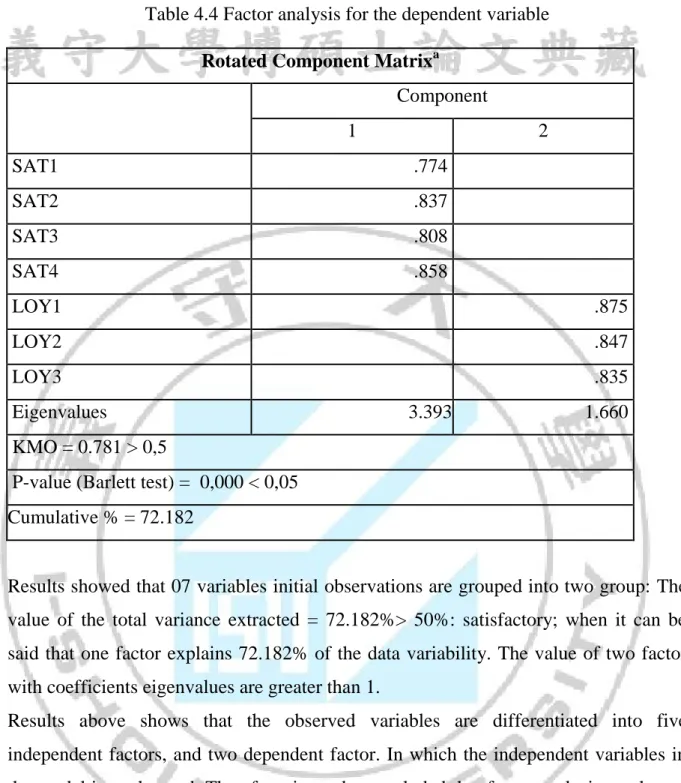
4.3.1 Factor analysis of independent factors
Table 4.3 Factor analysis of independent factors
Rotated Component Matrixa
Component 1 2 3 4 5 REL1 .739 REL2 .743 REL3 .734 REL4 .826 REL5 .829 ASU1 .835 ASU2 .804 ASU3 .853
ASU4 .821 EMP1 .771 EMP2 .804 EMP3 .747 EMP4 .820 TAN1 .875 TAN2 .856 TAN3 .867 RES1 .794 RES2 .815 RES3 .809 Eigenvalues 3.398 3.097 2.846 2.227 1.393 KMO = 0.725 > 0,5
P-value (Barlett test) = 0,000 < 0,05 Cumulative % = 68.218
Analysis results showed that 19 variables initial observations are grouped into 05 groups: The value of the total variance extracted = 68.218%> 50%: satisfactory; when it can be said that 07 factors explained 68.218% of the data variability. The value of the multiplier factor eigenvaluesare high (> 1), 5th factors with eigenvalues (lowest) = 1.393> 1.
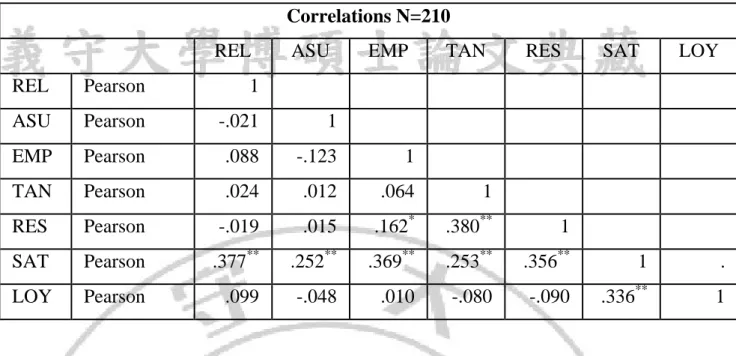
4.3.2 Factor analysis for the dependent variable
The observed variations of customer satisfaction and loyalty were analyzed by the method of Principal components with Variamax rotations. The variable with loading factor <0.5 not ensure convergence with the rest of the scale variables are discarded. KMO = 0.781 > 0.5: factor analysis of data relevant to the study. Barlett’s test with sig = 0.000 <0.05, indicating that the data usable to analyze the factors that is entirely appropriate.
Table 4.4 Factor analysis for the dependent variable
Rotated Component Matrixa
Component 1 2 SAT1 .774 SAT2 .837 SAT3 .808 SAT4 .858 LOY1 .875 LOY2 .847 LOY3 .835 Eigenvalues 3.393 1.660 KMO = 0.781 > 0,5
P-value (Barlett test) = 0,000 < 0,05 Cumulative % = 72.182
Results showed that 07 variables initial observations are grouped into two group: The value of the total variance extracted = 72.182%> 50%: satisfactory; when it can be said that one factor explains 72.182% of the data variability. The value of two factor with coefficients eigenvalues are greater than 1.
Results above shows that the observed variables are differentiated into five independent factors, and two dependent factor. In which the independent variables in the model is unchanged. Therefore, it can be concluded that factor analysis results are consistent with research model originally proposed.
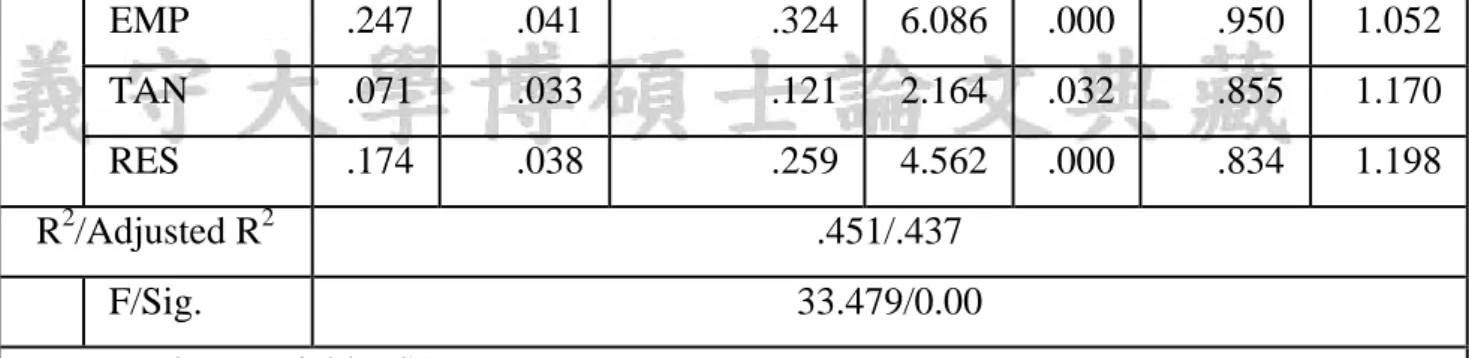
4.4 Testing the research model 4.4.1 Pearson correlation coefficient
Inspection of the Pearson correlation coefficient used to test a linear relationship between the independent variables and the dependent variable. If the variables are correlated, they must pay attention to the problem multicollinearity when regression analysis (hypothesis H0: correlation coefficient equal to 0).
Correlations N=210
REL ASU EMP TAN RES SAT LOY
REL Pearson 1 ASU Pearson -.021 1 EMP Pearson .088 -.123 1 TAN Pearson .024 .012 .064 1 RES Pearson -.019 .015 .162* .380** 1 SAT Pearson .377** .252** .369** .253** .356** 1 . LOY Pearson .099 -.048 .010 -.080 -.090 .336** 1
Correlation analysis results showed that the correlation coefficient between the independent and dependent variables are significant (sig <0.05), so the independent variables included in the regression analysis is appropriate. In addition, the results showed a number of independent variables are correlated with each other. Therefore, when regression analysis should pay attention to multicollinearity problems.
4.4.2 Hypothesis Testing
- H1: There is relationship between overall service quality and customer satisfaction with hotel in Hanoi.
To test the relationship among five factors of SERVQUAL and customer satisfaction with hotel in Hanoi. This study use multiple regression analysis, The regression results obtained are as follows:
Table 4.6. Results of regression analysis of five factors of SERVQUAL and customer satisfaction Coefficientsa Model Unstandardized Coefficients Standardized Coefficients t Sig. Collinearity Statistics B Std. Error Beta Tolera nce VIF 1 (Constant) .264 .254 1.040 .300 REL .239 .035 .357 6.836 .000 .990 1.010 ASU .166 .030 .294 5.615 .000 .983 1.017
EMP .247 .041 .324 6.086 .000 .950 1.052
TAN .071 .033 .121 2.164 .032 .855 1.170
RES .174 .038 .259 4.562 .000 .834 1.198
R2/Adjusted R2 .451/.437
F/Sig. 33.479/0.00
a. Dependent Variable: SAT
ANOVA analysis showed that F = 33.479 with sig = 0.000, thus the independent variables in the model have a relationship with the dependent variable (customer satisfaction).
Measurement multicollinearity: magnification factor VIF variance of variables is less than 2. Thus, the phenomenon of multicollinearity between the independent variables in this model is small, no significant effect on results Regression.
From the regression results we see, Adjusted R2 = 0.437 it means that the independent variables explain 43.7% variance of the dependent variable.
The regression equation of standardized model:
SATI = .357REL+.294 ASU +.324EMP+.121TAN+259RES
From the regression equation of standardized model, this study can be concluded that all factor of SERVQUAL Model has positive effect on the customer satisfaction with hotel industry in Hanoi. So hypothesis H1, H2, H3, H4, H5 are supported by the model. For the detail of each factor effecting, the result shows that the reliability factor has the biggest impact on customer satisfaction (beta = .357), the second is empathy factor (beta = .324), the third is assurance factor (beta=.294), the forth is product response factor (beta=.259) and the last is tangible (beta = .121).
To find the relationship between overall service quality and customer satisfaction, the single regression is taken, Summary of regression coefficients:
Table 4.7 Results of regression analysis of SERVQUAL and customer satisfaction
Model Unstandardized Coefficients Standardized Coefficients t Sig. Collinearity Statistics B Std. Error Beta Toleran ce VIF 1 (Constant) .539 .252 2.137 .034 SERVQUAL .821 .069 .635 11.84 9 .000 1.000 1.000 R2/Adjusted R2 .403/.400 F/Sig. 140.391/000
a. Dependent Variable: SAT
ANOVA analysis showed that F = 140.391with sig = 0.000, thus the independent variables in the model have a relationship with the dependent variable (customer satisfaction).
Measurement multicollinearity: magnification factor VIF variance of variables is less than 2. Thus, the phenomenon of multicollinearity between the independent variables in this model is small, no significant effect on results Regression.
From the regression results we see, Adjusted R2 = 0.400 it means that the independent variables explain 40% variance of the dependent variable.
From the regression model, this study can be concluded that SERVQUAL Model has positive effect on the customer satisfaction with hotel industry in Hanoi (beta= .635, P<0.05) So hypothesis H1 is supported by the mode.
- H2: There is relationship between customer satisfaction and loyalty with hotel
in Hanoi
To find the relationship between overall service quality and customer satisfaction, the single regression is taken, Summary of regression coefficients:
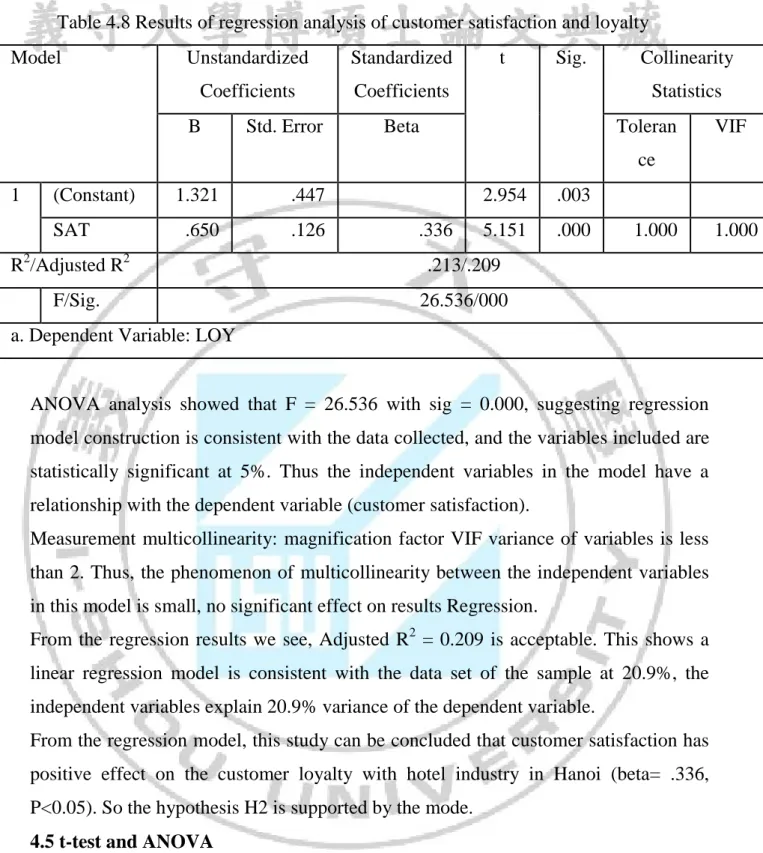
Table 4.8 Results of regression analysis of customer satisfaction and loyalty Model Unstandardized Coefficients Standardized Coefficients t Sig. Collinearity Statistics
B Std. Error Beta Toleran
ce VIF 1 (Constant) 1.321 .447 2.954 .003 SAT .650 .126 .336 5.151 .000 1.000 1.000 R2/Adjusted R2 .213/.209 F/Sig. 26.536/000
a. Dependent Variable: LOY
ANOVA analysis showed that F = 26.536 with sig = 0.000, suggesting regression model construction is consistent with the data collected, and the variables included are statistically significant at 5%. Thus the independent variables in the model have a relationship with the dependent variable (customer satisfaction).
Measurement multicollinearity: magnification factor VIF variance of variables is less than 2. Thus, the phenomenon of multicollinearity between the independent variables in this model is small, no significant effect on results Regression.
From the regression results we see, Adjusted R2 = 0.209 is acceptable. This shows a linear regression model is consistent with the data set of the sample at 20.9%, the independent variables explain 20.9% variance of the dependent variable.
From the regression model, this study can be concluded that customer satisfaction has positive effect on the customer loyalty with hotel industry in Hanoi (beta= .336, P<0.05). So the hypothesis H2 is supported by the mode.
4.5 t-test and ANOVA
For further testing the hypothesis H3: There are differences among tourist demographic with the level loyalty with hotel in Hanoi (Gender, age, Job, nationality Purpose and Frequency). This study uses the t-test and ANOVA.
4.5.1 The different level of loyalty between genders of customer
T-test is applied to test the different level of loyalty between genders of customer (male and female). Table 4.9 shows the result of t-test of different level loyalty
between genders of customer.
The result analysis show that with the alpha of 0.05, the independent t-test indicates that the average level of satisfaction of male (M= 3.5379, SD=.97593) is difference from female (M= 3.7436, SD=.89901), t (1) = -1.446, P<0.05 (table 4.9). It can be concluded that there is significant difference between male and female in customer loyalty with Hanoi hotel industry service. In this result shows that female have more loyalty and tendency to re-visit to Hanoi in term of Hanoi hotel service than male.
Table 4.9 The different level of loyalty between sex of customer
Group Statistics sex N Mean Std. Deviation Std. Error Mean t Sig. (2-tailed) LOY Male 145 3.5379 .97593 .08105 -1.446 .050 .038 Female 65 3.7436 .89901 .11151 -1.492
4.5.2 The differnent of customer loyalty among age group
To test the different of customer loyalty among age group, the ANOVA with 0.05 sig. is taken ( table 4.10) age group include: 18-25 , 26-35, 36-45, 46-55 and > 55 year old. The result indicates that customer in different age group do not have different level of loyaty (F= .147; P>0.05).
Table 4.10 The different of customer loyalty among age group
ANOVA LOY Sum of Squares df Mean Square F Sig. Between Groups .547 4 .137 .147 .964 Within Groups 190.230 205 .928 Total 190.777 209
4.5.3 The differnent of customer loyalty among job group
The result indicates that customer in different job group do not have different level of loyaty (F= 1.140; P>0.05).
Table 4.11 The different of customer loyalty among job group
ANOVA LOY Sum of Squares df Mean Square F Sig. Between Groups 3.116 3 1.039 1.140 .334 Within Groups 187.662 206 .911 Total 190.777 209
4.5.4 The different level of loyalty between nations of customer
T-test is applied to test the different level of loyalty between nations of customer (Vietnam and foreign). Table 4.11 shows the result of t-test of different level loyalty between nations of customer.
The result analysis show that with the alpha of 0.05, the independent t-test indicates that the average level of loyalty of Vietnamese (M=3.5593, SD=.97593) is not difference from Foreigner (M= 3.6558, SD=.93820), t (1) = -.725, P>0.05 (table 4.9). It can be concluded that there is not significant difference between Vietnam and foreign in customer loyalty with Hanoi hotel industry service. Even through in this result shows that Foreigner have more loyalty and tendency to re-visit to Hanoi in term of Hanoi hotel service than domestic customer.
Table 4.12 The different level of loyalty between Nation of customer
Group Statistics Nation N Mean Std. Deviation Std. Error Mean t Sig. (2-tailed) LOY Vietnam 118 3.5593 .97049 .08934 -.725 .469 Foreign 92 3.6558 .93820 .09781 -.728 .467
To test the different of customer loyalty among purpose of tourist, the ANOVA with 0.05 sig. is taken ( table 4.12) purpose of tourist include: Business trip, Tourism and Visit relative. The result indicates that customer in different purpose of tourist do not have different level of loyaty (F= .645; P>0.05).
Table 4.13 The differnent of customer loyalty among purpose of tourist
ANOVA LOY Sum of Squares df Mean Square F Sig. Between Groups 1.181 2 .591 .645 .526 Within Groups 189.596 207 .916 Total 190.777 209
4.5.6 The different level of loyalty between frequencies of customer
T-test is applied to test the different level of loyalty between frequency of customer (second time and first time). Table 4.13 shows the result of t-test of different level loyalty between frequencies of customer.
The result analysis show that with the alpha of 0.05, the independent t-test indicates that the average level of loyalty of second time (M=3.7119, SD=.95383) is not difference from first time (M= 3.5585, SD=.95572), t (1) = 1.046, P>0.05 (table 4.9). It can be concluded that there is not significant difference between second time and first time in customer loyalty with Hanoi hotel industry service. Even through in this result shows that second time have more loyalty and tendency to re-visit to Hanoi in term of Hanoi hotel service than domestic customer.
Table 4.14 The different level of loyalty between frequency of customer
Group Statistics frequency N Mean Std. Deviation Std. Error Mean t Sig. (2-tailed)
LOY second time 59 3.7119 .95383 .12418 1.046 .297
From the analysis of t- test and ANOVA, it can be concluded that only the gender of customer has different level of loyalty with Hanoi hotel service. Remaining of other demographic characteristic of customer do not have the different level of satisfaction among customer demographic (age, job, purpose, nation and frequency). So the hypothesis H3 is not supported by the study.
Chapter V Conclusion and recommendation 5.1 Conclusion
This study provides a theoretical framework helps to understand the relationship between the elements of the model SERQUAL, from the regression equation of standardized model, this study can be concluded that all factor of SERVQUAL Model has positive effect on the customer satisfaction with hotel industry in Hanoi. So hypothesis H1, H2, H3, H4, and H5 are supported by the model. For the detail of each factor effecting, the result shows that the reliability factor has the biggest impact on customer satisfaction (beta = .357), the second is empathy factor (beta = .324), the third is assurance factor (beta=.294), the forth is product response factor (beta=.259) and the last is tangible (beta = .121). Also this study confirm the relationship of satisfaction of tourists and loyalty to the hotel. Of Chen and Tsai (2007) in which provide empirical evidence confirms a positive relationship and significant between satisfaction tourists and loyalty to the hotel. However, in their study, perceived quality is considered to be intermediate to the satisfaction of tourists and loyalty. In the study by Chen and Tsai, image quality hotel and trips through the same variable (linear coefficient between the image and the quality of the trip is 0.91) shows the similarity of the two structures affect anticipated results. Chen and Tsai (2007) point out that the perceived quality of the service as a structure does not allow formation generalized indicators relevant across different locations. From the analysis of t- test and ANOVA, it can be concluded that only the gender of customer has different level of loyalty with Hanoi hotel service. Remaining of other demographic characteristic of customer do not have the different level of satisfaction among customer demographic (age, job, purpose, nation and frequency). So the hypothesis H8 is not supported by the study. This result is similar to Lai and Vinh (2012) suggests that improving the relationship between the properties of the hotel and the promotional activities meet visitors and to improve the image of the hotel. In addition, the image of a hotel could significantly impact loyalty of tourists. If visitors are enjoying better service than expected ability to go back in the future will be higher. This is very important for managers and tourism marketing planning in creating a competitive advantage over competitors in the region and internationally by improving the impression of customers to develop a picture hotel brand.
5.2 Recommendation
Pleasing guests must always be placed on the minds of every employee when starting work. In this study, Reliability factor has the biggest impact on customer satisfaction (beta = .357), in any business activities does the prestige are valued. Confidence in the quality of service we are always willing customer’s top concern when selecting products and services. For this study support the hypothesis could assert that the hotels in Hanoi are increasingly taking the confidence of visitors about the products and their services.
The second is empathy factor (beta = .324). This proves the fact that the hotel in Hanoi is not really interested in the training of staff in service at the hotel. The results lead to dissatisfaction for meeting the requirements of the guests and shared with guests while staying at the hotel. In the third stage of the serving of the hotel services, the processes of care and attention to their needs is most important.
The third is assurance factor (beta=.294) One of the concerns of tourists in the trip that is the safety and security of these criteria has always been the researchers considered factors push for tourism activities in general and hotels in particular (Kuusik et al, 2011, Kuenzel & Katsaris, 2009)
The forth is product response factor (beta=.259). Hotel management and staff to meet and settle the requirements quickly, helps hotels get positive reviews from guests. For example, when customers requested the replacement of blankets or remote control battery has run out, the long handle to the simple request to make the customers feel uncomfortable and can make comments, bad price on hotels.
The last is tangible (beta = .121), facilities and equipment and have a strong influence on customer satisfaction for staying. Services are inherently invisible characteristic, however for the hotel business, equipment plays an important role in attracting visitors and creating a relaxation in the guest rate. These results also prove that the property in Hanoi has made great efforts in mobilizing and modernizing the facilities of the hotel.
5.3 Contribution of research
5.3.1 Academic contribution
The study of hotels as part of the tourism industry but not many studies hotels, as an independent industry. This study contributes to academic knowledge by checking the hotel theory in the context of Hanoi. The model also improves previous studies in
tourism and hotel marketing (Chen and Tsai, 2007, and Mohamad et al., 2011) by testing of the model factors SERQUAL.
5.3.2 Applications in Management
The findings of this study can help the tourism marketing efforts combined with the hotel marketing and promotion activities and destination management organizations succeed. Our discovery could help Hotel marketers better understand the structure of the destination image and determine the core attributes of the property concerned. This study recommends that the service quality should be improved, including the needs and empathy shared with the guest service staff, to achieve an overall level of satisfaction is higher and improved images friendly hotels as well as loyalty to the tourist hotels. This study shows that customer experience is affected by supply and demand. Demand side is formed by the response of the hotel, so the hotel's activities need to be improved and more professional in the process of communication services. Besides other factors, such as the products visualized services, ensuring safety and security for travelers, tourists create confidence should be promoted further and create a strong promotional activities hotel marketing to target customers.
5. 4. Limitations of the study
Although this study contributes to additional theoretical and practical management model used in this study should be developed further à cognitive variables and values. Besides, this study cannot independently verified with international tourists. Future studies should emphasize this factor to develop the model. Factors related to the specific characteristics of the hotels in Hanoi have not been considered so some variables such as price and cuisine should be included in the next study.
Reference:
Ahmad Puad, M.S., Seyed Fatemeh, M.S., Azizan, M. and Jamil, J. (2011), A critical analysis of tourist satisfaction and destination loyalty, Journal of Global
Management,2(1), 178- 183.
Barsky & Labagh (1992), A Strategy for Custmer Satisfaction, Cornell Hotel
and Restaurant, Administration Quarterly, 32-40.
Bui, H., (2011), Congruency between the projected and perceived tourism destination image of Vietnam, Journal of International Business Research, 10(2), 1-13.
Chen, C.F. & Tsai, D., (2007), How destination image and evaluative factors affect behavioral intentions? Tourism Management, 28, 1115–1122.
Cooper, D. R., & Schindler, P. S. (2011). Business Research Methods (11th ed.). New York: McGraw-Hill/Irwin
Cronin, J. J. & Taylor, S. A. 1992, Measuring service quality: A reexamination and extension, Journal of Marketing, vol. 56, no. 3, pp. 55-68.Kuusik, A., Tiru, M., Ahas, R. & Varblane, U., (2011), Innovation in destination marketing: The use of passive mobile positioning for the segmentation of repeat visitors in Estonia, Baltic
Journal of Management, 6(3), 378-399.
David Gwynn Morgan; (2008) Three Unjustly Uncelebrated Local-government Cases' In: D. Keogh (eds). Gerald Goldberg: A Tribute.
Hà Nam Khánh Giao (2011), Giáo trình marketing du lịch, Nxb Tổng hợp Thành
phố Hồ Chí Minh.
Hair, J.F., Black, W.C., Babin, B.J., Anderson, R.E. and Tatham, R.L.(2006),
Multivariate data analysis (6th ed.), Pearson Prentice Hall, Uppersaddle River.
Korzay, M., Alvarez, M. D. (2005). Satisfaction and Dissatisfaction of Japanese Tourists in Turkey, Anatolia, An International Journal of Tourism and
Hospitality Research 16(2), 176-193.
Kuenzel, S. & Katsaris, N., A., (2009), Critical analysis of service recovery processes in the hotel industry, TMC Academic Journal, 4(1), 14-24.
Lai W.H, and Vinh, N.Q., (2012), A Study of Analyzing the Selection of Promotion Activities and Destination Attributes in Tourism Industry in Vietnam - From the Perspective of Tourism Industrial Service Network (TISN), International
Lai, W. H., & Vinh, N. Q., (2013), How Promotional Activities and Evaluative Factors Affect Destination Loyalty: Evidence from International Tourists of Vietnam, International Journal of Marketing Studies, 5(1), 70-85.
MacCallum, Widaman, Zhang và Hong (1999), Sample Size in Factor Analysis: The Role of Model Error, Multivariate Behavioral Research, 36 (4), 611-637
Mohamad, M., Abdullah, A.R. and Mokhlis, S, (2011), Examining the Influence of Service Recovery Satisfaction on Destination Loyalty: A Structural Equation Modeling, Journal of Sustainable Development, 4(6), 3-11.
Munusamy, J., Chelliah, S., & Mun, H. W. (2010). Service quality delivery and its impact on customer satisfaction in the banking sector in Malaysia. International
Journal of Innovation, Management and Technology, 1(4), 398.
Nguyễn Thị Cẩm Thúy (2012), Phát triển thị trường du lịch tại Hà Nội, Luận văn thạc sĩ, trung tâm đào tạo giáo viên lý luận chính trị, Hà Nội, Việt Nam
Nunnally, J. C., & Bernstein, I. H. (1994). The theory of measurement error.
Psychometric theory, 209-247.
Nunnally, J.C. (1978), Psychometric theory, McGraw-Hill, New York
Parasuraman A, Berry L L and Zeithaml V A (1990), Delivering quality service:
balancing customer perceptions and expectations. London: Collier Macmillan, 1990,
226 p. ISBN 0-02-935701-2
Parasuraman, A., Zeithaml, V.A. and Berry, L.L. (1988), SERVQUAL: a multi-item scale for measuring consumer perceptions of the service quality, Journal of Retailing, Vol. 64, No. 1, pp. 12
Parasuraman, A., Zeithaml, V.A. and Berry, L.L. (1994), Reassessment of expectations as a comparison standard in measuring service quality: implications for future research, Journal of Marketing, Vol. 58, pp. 111-124.
Schumacker, R.E. and Lomax, R.G. (2004), A beginner’s guide to structural equation
model (2nd ed.), Lawrence Erlbaum Associates, Mahwah.
Suman, M., & Garg, R. (2012). Consumer Perception Towards Quality of Financial Services. Urban vs. Rural Perspective.
Tabachnick, B.G. and Fidell, L.S. (2007), Using multivariate statistics (5thed.), Pearson Education, Boston.
tourists in Vietnam, International Journal of Tourism Research, 11(6), 521-535. Žabka, V., Brencˇicˇ, M.M. and Dmitrovic´, T., (2010), Modeling perceived quality, visitor satisfaction and behavioral intentions at the destination level, Tourism
Management, 31 (4) 537-546.
Zeithaml, V. A., Bitner, M. J. & Gremler, D. D., (2009). Services marketing:
Appendix
The survey on the level of customer satisfaction with hotel service
Your age?
Gender - Gender (1: Female, 2 Male)
Occupation (1: Businessmen, 2: the official 3: Workers ....) You are Vietnamese or foreigner? (1: Vietnamese, 2: Foreigner) This is the first time you stay at the hotel?
1: Yes - Yes 2: No - No
1. When the hotel has agreed to do something about the time specified, then the hotel will do.
2. When you are having problems, property expressed sincere interest in solving the problem ...
3. Hotel service performed right the first time. 4. The hotel staff to serve you quickly and timely. 5. The hotel staff is always ready to help you.
6. Hotel staff never too busy to show not meet your requirements. 7. The behavior of the staff in the hotel ever give confidence to you. 8. Do you feel safe when making deals with hotels
9. The hotel staff are always polite, courteous with you.
10. The staff in the hotel enough knowledge to answer your questions 11 Hotels express personal interest in you.
12. Hotels show special attention to your best interest. Dear Sir or Madam
This survey aimed to find out the key factors affecting tourists' satisfaction with hotel service. It is an important part to of research entitled “Factors affecting satisfaction and customer loyalty for hotels". Please answer these questions based on your opinions (rated from 1- strongly disagree to 5- totally agree). Sincerely thank for cooperation and valuable time you've spent to complete this survey!
Sincerely, 2 1 1 2 3 1 2 1 2 5 4 3 2 1 5 4 3 2 1 5 4 3 2 1 5 4 3 2 1 5 4 3 2 1 5 4 3 2 1 5 4 3 2 1 5 4 3 2 1 5 4 3 2 1 5 4 3 2 1 5 4 3 2 1 5 4 3 2 1
13. The staff in the hotel understands your special needs
14. Hotel employees who express an interest in you personally. 15. The hotel has modern equipment.
16. The facilities of the hotel looks very attractive. 17. Employees of the hotel neat attire, courtesy
18. This hotel offers more benefits than costs me money 19. This hotel is the best among competing hotels
20. This hotel is much better than what I expected
21. I feel very satisfied with the traditional food of Vietnam 22. I would choose this hotel again for future visits to my 23. I will recommend the hotel to friends and family
Thank for your cooperation!
5 4 3 2 1 5 4 3 2 1 5 4 3 2 1 5 4 3 2 1 5 4 3 2 1 5 4 3 2 1 5 4 3 2 1 5 4 3 2 1 5 4 3 2 1 5 4 3 2 1