採用線上教學/學習系統之決定因素 - 越南胡志明市大學教師與學生之比較分析
70
0
0
全文
(2)
(3) Determinants of E-Teaching/Learning System Adoption in Universities of Ho Chi Minh City, Vietnam: Lecturers Vs. Learners Advisor: Prof. ChieHsing Wu Department of Information Management National University of Kaohsiung Student: Pham Ngoc Que Tram International Master of Business Administration National University of Kaohsiung. ABSTRACT The benefits of E-Teaching/Learning System (ET/LS) will not be maximized unless users accept to use the system. This study is one of the few attempts to investigate determinants of ET/LS adoption in universities of Ho Chi Minh City, Vietnam. The models integrated determinants from the well-established technology acceptance model as well as technological and psychological facet cited in the research literature. Use propensity was also examined as a moderating role in order to deepen the understanding of ET/LS adoption intention. Data were collected from lecturers and students in ten universities of Ho Chi Minh City, Vietnam to conduct both hypothesis test and moderation test. Based on data analysis from questionnaire of 299 subjects, research findings are obtained showing that (1) adoption intention is determined by adoption attitude and both technological and psychological are strongly associated with the users’ attitude and intention of using ET/LS, (2) not all single factor in two facets have significant influence on adoption attitude, and (3) user type significantly moderates the effect of each factor of ET/LS on adoption attitude. Implications for theory building, practical management and future research are also discussed. Keywords: ET/LS adoption, adoption intention, adoption attitude, technological facet, psychological facet, use propensity, user type.
(4) ACKNOWLEDGEMENT I would like to express a deep sense of gratitude to my advisor, Prof. ChieHsing Wu, for his invaluable guidance and support. His research skill and professionalism have greatly inspired me and gave me the precious knowledge for my career. This study would not have been possible without my advisor’s expertise and dedication. I gratefully acknowledge the Ministry of Education of Taiwan for awarding me the MOE Taiwan Scholarship for two years. Thanks to all the professors and academic staff at the College of Management, International Master of Business Administration Department, Office of International Affairs for their great assistance and kindness. Thanks to all my colleagues in Ho Chi Minh City University of Education who have tolerated my absence and taken up heavier responsibilities whilst I was on study leave. Also, I would like to send a thankful appreciation to all the lecturers and students for their interest and participation in the surveys. Finally, my special thanks go to my dearest family and my best friends for their continuing wholehearted support and encouragement, for their love and contribution. This study could not have happened without the mental and physical support of these family members and friends. In this journey, I has been influenced and supported by organizations and beloved people to whom I am deeply indebted. This thesis is dedicated to them..
(5) TABLE OF CONTENTS Chapter 1 : Introduction ....................................................................................................................... 1 1.1 Research Background ..................................................................................................................... 1 1.2 Motivation and Objective ............................................................................................................... 5 1.3 Research Procedure ........................................................................................................................ 5 1.4 Thesis Overview ............................................................................................................................ 7 Chapter 2 : Literature Review and Hypothesis Development .............................................................. 8 2.1 ET/LS in Education ........................................................................................................................ 8 2.2 ET/LS used in Universities ........................................................................................................... 10 2.3 Technology Acceptance Model ..................................................................................................... 13 2.3.1 Technological facet ................................................................................................................ 15 2.3.2 Psychological facet ................................................................................................................ 16 2.3.3 Use Propensity ....................................................................................................................... 17 Chapter 3 : Research Method ............................................................................................................. 19 3.1 Research Model ........................................................................................................................... 19 3.2 Sample ......................................................................................................................................... 22 3.3 Measure ....................................................................................................................................... 24 3.4 Data Analysis and Techniques ...................................................................................................... 27 Chapter 4 : Results and Discussion ..................................................................................................... 28 4.1 Descriptive Statistics .................................................................................................................... 28 4.2 Reliability, Factor Analysis and Validity ....................................................................................... 29 4.3 Analysis Results ........................................................................................................................... 33 4.4 Discussion and Implications ......................................................................................................... 37 4.4.1 Discussions ............................................................................................................................ 37 4.5.2 Implications ........................................................................................................................... 39 Chapter 5 : Conclusion ........................................................................................................................ 41 5.1 Research Findings ........................................................................................................................ 41 5.2 Research Suggestions ................................................................................................................... 42 5.3 Limitations and Future Studies ..................................................................................................... 43 References ............................................................................................................................................ 45 Appendix.............................................................................................................................................. 51 Appendix A: Formal Research Questionnaire for Lecturers ................................................................ 51 Appendix B: Formal Research Questionnaire for Students .................................................................. 57. I.
(6) LIST OF TABLES Table 3-1: Operational definition ............................................................................................... 21 Table 3-2: Surveyed schools and departments............................................................................ 22 Table 3-3: The designed questionnaire for variables (for lecturer) .............................................. 24 Table 3-4: The designed questionnaire for variables (for student) .............................................. 26 Table 4-1: Demographic information of respondents ................................................................. 29 Table 4-2: Results of Reliability Tests ....................................................................................... 30 Table 4-3: Results of Factor Analysis test .................................................................................. 31 Table 4-4: Discriminant Validity and Correlation Matrix ........................................................... 32 Table 4-5: Results of Hypothesis test of Total ............................................................................ 34 Table 4-6: Results of Moderation test (level 1) .......................................................................... 35 Table 4-7: Results of Moderation test (level 2) .......................................................................... 36 Table 4-8: A Summary of Hypothesis Test ................................................................................. 39. II.
(7) LIST OF FIGURES Figure 1-1: 2013-2018 Top Ten Worldwide Self-paced eLearning Fiveyear Growth Rates by Country (Source: Ambient Insight 2014)...................................................3 Figure 1-2: Research Procedure...................................................................................................6 Figure 2-1: E-Learning Industry (Source: docebo.com) ............................................................. 10 Figure 2-2: Technology Acceptance Model................................................................................ 14 Figure 3-1: Research Model ...................................................................................................... 20 Figure 4-1: Evidence of p-value in Hypothesis test of Total (level 1) ......................................... 38 Figure 4-2: Evidence of p-value in Hypothesis test of Total (level 2) ......................................... 38. III.
(8) CHAPTER 1 : INTRODUCTION 1.1 Research Background Nowadays, people are familiar with the internet in general and E-Teaching/Learning System (ET/LS) in particular. The Internet is one the most useful technologies which affect and facilitate nearly every aspect of modern life, especially in education. The internet has had an enormous impact on education since it provides both lecturers and students access to information and communication far easier (Hartshorne and Ajjan 2009). ET/LS is a method of learning communicating through the internet in the way that computer-based training incorporates technologies to support students to interact with learning contents designed on the basis of teaching methods and managed by electronic systems. According to Cyber Universities, nearly 90% of universities in Singapore use ET/LS as part of their training and in the US this figure is over 80%. ET/LS has been proved to meet the demands of the learners, as well as completely transformed the way in which learning is imparted to students in universities. ET/LS accommodates students’ needs by providing them relevant, mobile, self-paced, and personalized content, while they can learn at their own comfort and requirement. ET/LS has not only improved higher education pedagogical approach and has resulted in numerous new innovations in learning concepts (Sun, Tsai et al. 2008, Wang and Wang 2009). Many academic organizations adopt ET/LS because it facilitates training, enhances time and cost savings such as travelling, printed materials, and laboratory costs (Welsh, Wanberg et al. 2003, Zhang and Nunamaker 2003, Ruiz, Mintzer et al. 2006) The "miraculous" development of ET/LS is rooted from firstly the fact that Vietnamese in general are very interested in education and training. According to the annual report, the level of government spending for this sector is equivalent to 20% of the total budget expenditure. 47% of Vietnamese people’s expenditure is on education (according to Taylor Nelson market research). Secondly, according to the report of Vietnam E-Commerce Department, the number of Internet users in the country currently ranges from 37-40 million; on average each person spends about 2 hours per day to access the Internet (accounting for 31.5 % of the total time of using the media, this rate is increasing especially in young people). As Vietnamese people are increasingly using the Internet, there are greater opportunities for various types of ET/LS platforms. Thirdly, Vietnam 1.
(9) is in the golden population period with 50% of the total population being in the age group of 1564. Young people with progressive thoughts are willing to adopt new learning methods to replace the traditional way of learning. In addition, many university students find their learning experience too rigorous and inflexible. Too many lectures, impractical and theoretic learning materials are what they often mention as disadvantages of conventional schooling. ET/LS offers many practical benefits as learners can chose to study anywhere, anytime provided that Internet connection is available. Studying right from home will save much time and effort and allow students plenty of time to participate in practical activities related to their chosen fields apart from their coursework. Moreover, online education can help students connect with qualified teachers everywhere without the huge conflicts in schedule that otherwise would greatly hinder in the traditional classroom. However, EL/TS in Vietnam is quite a long story. Before 2000, ET/LS was not focused and there were few researches and study related to this field. In 2000, to efficiently exchange and integrate with the global and regional education system, the Ministry of Education and Training (MOET) first announced its Master Plan for ICT in education for the period 2001-2005. Then, ET/LS began its early stage of adoption process in Vietnamese education institutions. As the government put the top priority is the infrastructure development and IT training, since 2007, especially during the school year 2008-2009, Vietnam has invested heavily in ET/LS, with an approximately amount of 50 million US dollars. IT has been decreed to be a priority in education reform in the national agenda through the Vietnamese government resolution 49/CP and the recent Directive No. 9772/BGDĐT-CNTT (Dang and Robertson 2010). There have been many projects trying to implement ET/LS in order to foster educational innovations. Statistics collected in March 2014 showed that ET/LS market in Vietnam had an incredibly growth rate (46%), even higher than China, Thailand and Malaysia. In addition, Vietnam has been a member of in Asia E-Learning Network (AEN) with the participation of Ministry of Education and Training, Ministry of Science and Technology, Ministry of Posts and Telecommunications and University of Technology. It points out that Vietnamese government put emphasis on ET/LS investment, although Vietnam is still in the early stage of the adoption process when compared with other countries in the same region. With the joining of Vietnam into WTO and the more profound integration into the global economy, Vietnam's education is facing challenges to equip future citizens with comprehensive 2.
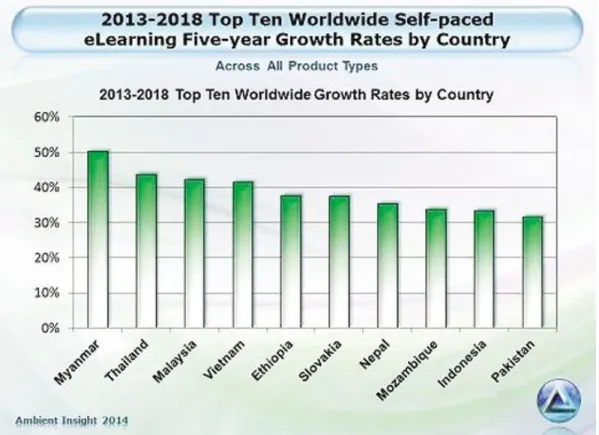
(10) capacity, intellect and self-learning skills to upgrade themselves in increasingly fierce competition environment. In Vietnam, it is now possible to find ET/LS programs across three main channels: those created by schools in the national education system, those introduced into Vietnam from foreign sources and those designed to cater the demand of a certain company or organization. With the explosion of technology, students in universities need to learn many new science subjects, with a huge amount of information. How students get access to materials, consume, discuss and share those contents is remarkably changed thanks to this digital revolution. Therefore, teaching method and learning environment also need to be adjusted. Lecturers now play a role as an instructor who guides, while the learners need to be more active to acquire knowledge themselves. It has been shown that Vietnamese families spend 47% of their budget on education. Furthermore, about 50 million Vietnamese students use Internet, which accounts for 53% of the population. In this context, using ET/LS not only helps teachers effectively deliver all the contents, easily manage their teaching process, will help teachers improve their ability to use new methods, but also encourage students to actively explore new things and promote initiatives. Vietnam was ranked number 5 in 2013-2018 Top Ten Worldwide Self-paced eLearning Five-year Growth Rates by Country.. Figure 1-1: 2013-2018 Top Ten Worldwide Self-paced eLearning Five-year Growth Rates by Country (Source: Ambient Insight 2014) 3.
(11) There are now two kinds of implementing ET/LS in universities in Vietnam: online learning and blended learning. Online learning is a form of learning that is carried out entirely on the electronic educational network with the management systems. On the other hand, blended learning is the combination of online learning and tradition classroom. This means beside face-to-face learning method, online learning is used as an effective tool to support teaching and learning process. The advantage is with an online system of clearly designed, oriented lectures, students can easily identify contents to study at their convenience, simultaneously ensure the interaction between teachers and students, and between students themselves. That is one of the reasons why blended learning is immensely popular in Vietnamese universities, even in many countries with first-class education. In this research, my scope will include both kinds of ET/LS. How Vietnamese universities have implemented ET/LS within their academic and institutional environment is still a controversial issue. Although the importance of ET/LS implementation in universities has been nationally recognized, and ET/LS has been widely adopted for several years, there is lack of success. It keeps resulting in failure when universities try to integrate ET/LS into their university systems. The question why many ET/LS projects have not gained the expected results needs to be addressed. Vietnamese scholars have explained that projects failed due to various reasons other than technical factors. In the learners’ perspective, ET/LS requires them selfstudy, motivation to self-practice, and teamwork. Due to the conventional passive learning style and the overloaded schoolwork, most students do not find it particularly compelling to switch to ET/LS. On the other hands, even some eager learners who live in remote areas still do not have Internet access to join in such courses. Regarding the construction of learning resources: Designing well-qualified ET/ LS courses is a demanding task to the currently overworked lecturers. Teacher factors far outweighed the school factors when it comes to failure of some experimental ET/LS programs. There are many difficulties teachers have to face that could affect their reception of ET/LS. Given the added responsibilities and little to no incentives, the teachers are reluctant to devote their effort to another full-time task. In addition, despite excellent professional skills and expertise, operating new tools such as video capturing, recording or designing software is new to most teachers. Therefore, it takes a considerable amount of time to familiarize themselves to the tools not to mention to utilize the functions to optimize the ET/LS content. Determining factors that influence lecturers’ adoption in universities in Ho Chi Minh City is crucial before any decision to invest heavily in a wide range of ET/LS initiatives is made. 4.
(12) 1.2 Motivation and Objective Knowledge, high quality education and training become much easier to get access thanks to the booming of IT, the internet, especially EL/TS. These technological developments have opened the door for lecturers and students in colleges to changes in different scales in terms of teaching and learning. In Vietnam, education has been one of the sectors which are heavily invested. With this orientation focused, Vietnam has decided to put IT, especially ET/LS into all levels of education to innovate teaching methods, improve the quality of learning in all subjects to equip young people enough tools and skills for the information era. Ho Chi Minh City is not only the largest city, but also the business and financial hub of Vietnam. Thus, the implementation of ET/LS has prospered, partly due to the attention of the government, partly as an effort of IT enterprises to research and apply ET/LS. Although the use of ET/LS to teach and learn is inevitable for both lecturers and students, the context of deploying ET/LS in colleges Ho Chi Minh City is complicated and not always successful. Determining factors that influence the adoption willingness of lecturers and students in colleges in Ho Chi Minh city is still under examination. Therefore, to deepen the insights, the research thesis proposes and empirically examines a research model to describe the adoption intention of ET/LS by considering such facets of technological and psychological. The research thesis is conducted to reach two objectives as follows.. (1) To propose a research model to describe the adoption intention of ET/LS for college teachers and students in Ho Chi Minh City, Vietnam.. (2) To empirically examine the research model and provide research findings, implications, and suggestions for ET/LS providers and college administrators.. 1.3 Research Procedure The purpose of this study is to delve into the acceptance of both lecturers and students to adopt E-Teaching/Learning system. In addition, the comparison the differences in those two types of. 5.
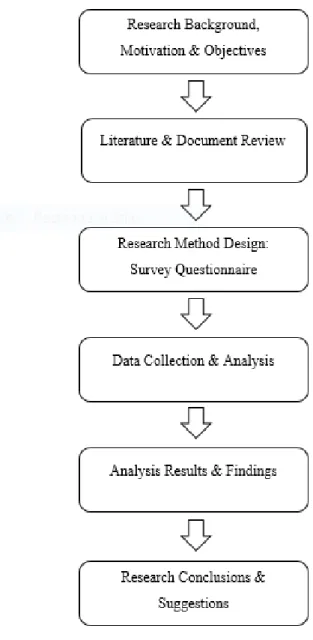
(13) users as moderating role is examined. After determining research topic and objectives, literature review is investigated in order to provide understanding of ET/LS in education in general and universities in particular, which helps confirm the scope of the study, as well as define the problems. Research method is a quantitative approach which uses survey questionnaire for data collection. Then, data analysis is conducted to give conclusions and suggestions based on the results. The research procedure is shown in Figure 1-2.. Figure 1-2: Research Procedure. 6.
(14) 1.4 Thesis Overview This research includes five main chapters, which is structured in the following way: Chapter 1: Introduction - This chapter includes general background about the research and then explains research motivation and objectives, with overview of research procedure and structure of this study. Chapter 2: Literature Review and Hypothesis Development - First part of this chapter features EL/TS in Education. Second part explores how ET/LS is used in colleges. Lastly, Technology Acceptance Model is discussed with two main facets and the exploration of the moderation effect of user types on the model. Adjustments and modifications are carried out to propose research hypothesis and to deepen the understanding of ET/LS adoption. Chapter 3: Research Method - This chapter explains research methodology conducted in this study, which includes samples, questionnaire measuring concept, data analysis, with the philosophical assumptions underlying this research and empirical techniques applied. Chapter 4: Results and Discussion – Quantitative analysis is conducted to analyze collected data. Chapter 5: Conclusion – This chapter represents a short summary of this study and illustrates research findings and suggestions for universities in Ho Chi Minh City, and then proposes some directions for future studies.. 7.
(15) CHAPTER 2 : LITERATURE REVIEW AND HYPOTHESIS DEVELOPMENT 2.1 ET/LS in Education The term “E-Learning” is widely used in most of cases. However, in this research, since both lecturers and students are the main targets of users, “E-Learning” is changed into ETeaching/Learning System (ET/LS), although there are no differences between the two terms. In addition, there has not been a universally accepted definition of ET/LS. ET/LS involves a diversity of concepts, methods and applications which have continuously changed over time. According to Higher Education Funding Council for England, ET/LS is the use of information and communications technology (ICT) as a communications and information delivery tool between individuals and groups, to support students and improve the management of learning (HEFCE 2005). Commenting on ET/LS definition, Organization for Economic Co-Operation and Development stated: “E-Learning refers to the use of ICT to enhance and/or support learning in tertiary education.” (OECD 2005). This covers several types, such as Web-supplemented, Webdependent and Mix mode courses. A significant number of researches have been conducted on ET/LS and how to widely apply ET/LS. Adoption and use of ET/LS have been one of the most researched topics in the prior literature (Islam 2011, ŠUmak, HeričKo et al. 2011). Nowadays, ET/LS has become almost indispensable tools in education (Álvarez, Martín et al. 2013). In comparison to the conventional method of teaching and learning in the past in which teachers played the dominant role and students were so passive, ET/LS have altered radically the concept since students now need to take greater responsibility for their own learning. Many other vital factors such as the abundance of ET/LS technologies, cost reduction, time management, convenience and flexibility also help trigger the deployment of ET/LS in academic program. As a result, in order to provide innovative methods of delivering education to students, ET/LS is mostly used by all levels of educational organizations. The size of ET/LS market is expected to grow multi-fold in comparison to the traditional classroom. As there is an exponential increase in investment in ET/LS, it shows that the importance of ET/LS has been universally recognized. One of the most substantial gains when implementing ET/LS is that it offers many benefits 8.
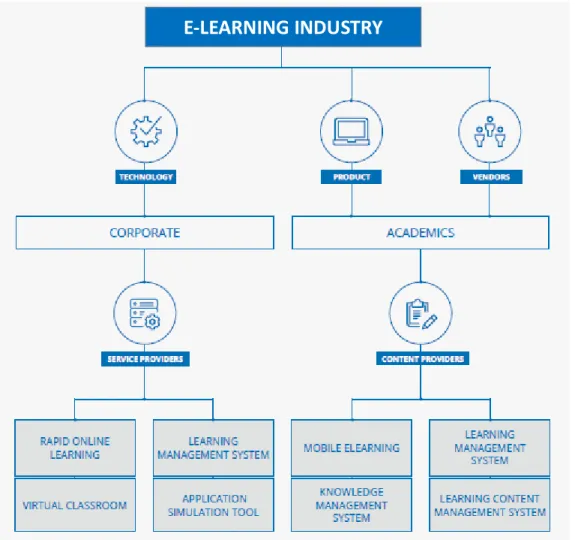
(16) thanks to helping instructors and participants gain the necessary skills for work and social life in the 21st century (Vilaseca and Castillo 2008, Minedu 2009). The benefits can be categorized into 4 different kinds of impact on the experience of learning: cultural, intellectual, social and practical (Laurillard 2005). In cultural aspect, users do not have difficulty in using ET/LS since they are familiar with information search and communication methods in daily lives; while in intellectual aspect, through material and social interactivity online, users are offered a new mode of engagement with ideas in interactive technology. For social part, the ways users acquire knowledge and master their skill become more active, while in practical, there is greater flexibility in terms of time and place as well as the ability to manage quality and share resources across network. In other words, ET/LS can support the suitability and effectiveness of education by enabling the system to be more flexible in the ways in which learning appears (Le, Tran et al. 2013). 87% of millennials keep using smart devices 24/7. Therefore, students can learn and tutor not only at their own pace, but also with comfort at their own home. Approximately 40%-60% less time takes to complete virtual training than classroom training. In addition, as 73% adults consider themselves lifelong learners, they consider ET/LS a very effective tool as it is open for all age group. Overall, users have developed an appreciation for the ease of access and improved effectiveness new animated, engaging, interactive learning tools provide. As a top learning and development priority, ET/LS worldwide market have not stop growing and evolving. Moreover, there is a growing prevalence of ET/LS in various geographic markets around the world as a new trend of tools. From research market, Forbes website estimates that global ET/LS market to will reach $325 billion by 2025 from $107 billion in 2015, which illustrates an increasing budget allocations for ET/LS. Next page is the chart of ET/LS industry, or ELearning industry.. 9.
(17) E-LEARNING INDUSTRY. Figure 2-1: E-Learning Industry (Source: docebo.com). 2.2 ET/LS used in Universities In the literature, there are a vast number of studies on limitations in teaching and learning in Vietnamese universities which results in a lack of necessary skills that students need to develop for their study and future career. In the cutting edge paper of 2003, Mo conducted a survey among 234 employers and 3,364 graduate students in Ho Chi Minh City University of Pedagogy (Mo 2003). The investigation was about tertiary education quality. The results indicated that 50% of graduates could not meet the requirements of recruiters and had to be retrained. Another research of Le, Tran and Hunger (2013), they still confirmed that the situation has not been improved and raise an alarm of worrying statistics:. 10.
(18) ✓ More than 50% of students are not really confident in their learning capability. ✓ Over 40% of students say that they are incapable of self‐study. ✓ Nearly 70% of students claim that they are incapable of teaching themselves. ✓ Nearly 55% of students said that they are not really involved in learning. (Le, Tran et al. 2013, p. 242) These studies suggested that there is an urge for universities in Vietnam to look for a comprehensive transformation of teaching and learning method. To deal with the ongoing issues in education reform, Vietnamese government approved policies which solve the weaknesses and limitations of Vietnamese education system. The renewal of teaching and learning method and the integration of ET/LS into teaching and learning process is offered as the choice for the development of active learning. Since then, many ET/LS projects have also been built up and employed in Vietnam universities, especially in major cities such as Ho Chi Minh City or Ha Noi. Nowadays, in universities of Ho Chi Minh City, trends that ET/LS is used is divided into two main kinds: online learning (virtual classroom courses) and blended learning. The term web-based virtual learning environment was defined as "computer-based environments that are relatively open systems, allowing interactions and encounters with other participants and providing access to a wide range of resources” (Piccoli, Ahmad et al. 2001). On the other hand, the term blended learning, which emphasizes the central role of computer-based technologies, was defined as “the combination of instruction from two historically separate models of teaching and learning: traditional face-to-face learning systems and distributed learning systems” (Bonk and Graham 2012). The two kinds of ET/LS both have similarities. Basically, a web-based course system is launched and become open access for students. Courses delivered on academic programs are published on the system for students to download. When the fact that ET/LS becomes more popular, the number of students who are interested in participating in such courses keeps increasing. This leads to some technical issues related the system’s connections, bandwidth and performance. Students will use ID and email provided by their schools to sign in in order to prevent outsiders from accessing the system. Due to new academic requirement regulations, students’ final result is based on at least three aggregated parts such as checking attendance, midterm and final exam. Follow this rule, lecturers utilize ET/LS as a useful function to save time by using quiz tool 11.
(19) to conduct midterm. Students will follow a fixed schedule and access the ET/LS to do the quiz. Right after they finish their quiz, the system will automatically mark the scores and inform students their grades immediately. For the differences, in virtual classroom courses, authors or lecturers will only have online interaction with students and update the content of materials. On the other hand, in blended learning, schools use ET/LS to support lecturers and students in teaching and learning, not to totally replace the face-to-face method. In other words, this means the implementation of ET/LS combined with face-to-face and web-based learning. While virtual classroom gives users convenience and flexibility, blended learning not only breaks down the traditional wall of learning, but also maintain real interaction between lecturers and students. This is the reason why many universities in Ho Chi Minh City now apply blended learning in their curriculum. Most educational institutions around the world have heavily invested in building an ET/LS for their courses in academic degree programs (Islam 2012, Deng and Tavares 2013). The implementation of ET/LS by educational institutions has promised better quality and learnercentered education (Islam 2012). It is obviously the sign that technological advancements are greatly influencing the education sector (Le, Tran et al. 2013). Surveys covering a sample of 990 educational institutions that conducted by Radović-Marković have showed that students at more than 90% of virtual faculties are satisfied with this kind of education and knowledge acquisition (Radović-Marković 2010). It has been a remarkable success ET/LS achieves as a result of the attained benefits for both lecturers and students in universities. The first obvious advantage is that ET/LS creates new environment in which students can have a flexible and separate schedule which is more suitable for them and generates more choices; as well as they can receive individualized support (Tao, Rosa Yeh et al. 2006). This means ET/LS focuses on the needs of individual learners as an important factor during the learning process. In addition, with the use of multimedia construct, the learning procedure becomes more interesting, enjoyable and effective (Liaw, Huang et al. 2007). Students are allowed to watch activities conducted in classrooms as many time as they need (Zhang, Zhou et al. 2006). As ET/LS reduces travelling cost for both lecturers and students, the number of classroom for universities, it is more cost-effective and profitable (Holmes and Gardner 2006). For lecturers, ET/LS works as a useful tool to help them save time and effort since there is less manual work. 12.
(20) Secondly, to be well-prepared for future careers, or even for scholastic and professional performance, critical thinking is a key skill that individuals need in order to succeed (Johnson, Dweck et al. 2010). Many researchers have proved in their studies that using ET/LS as an approach can help to develop students’ critical thinking skill, which requires students to think of ways to take the concepts learned and apply them to practical application (Lunney, Frederickson et al. 2008, Saadé, Morin et al. 2012, Gharib, Zolfaghari et al. 2016). Since critical thinking skill is one the most crucial soft skills as well as knowledge skills asked for by academia and companies in the future, it is also considered an enormous benefit that ET/LS can offer. Lastly, in blended learning, ET/LS efficiently maintains and facilitates a high level of interaction and collaboration between lecturers and students. On the other hand, in virtual classroom, ET/LS eliminates barriers and eases communication between students who have shy, reserved characteristics and lecturers/classmates. These students find themselves difficult talking directly in public and feel more comfortable to express their points of views online (Wagner, Hassanein et al. 2008). Furthermore, ET/LS also promotes students’ autonomy towards their own learning since lecturers now are not their only source. In this way, students are more dependent and active, which is better for them at their workplace in the future (Alsalem 2004). With those great advantages and its empowerment that ET/LS brings to users, it is apparent that ET/LS can become a dominant education form around the world. It is service, quality and speed that is the main construct making ET/LS promising (Liaw, Huang et al. 2007). Another meaningful topic which has been discussed many times in literature is Technology Acceptance Model (TAM) (Davis 1989). To describe why technology such as ET/LS is used, TAM introduced by Davis (1989) has been widely employed to explore the determining factors that are associated with the use intention (Fathema, Shannon et al. 2015). The next part provides more details of this theory.. 2.3 Technology Acceptance Model Technology Acceptance Model (TAM) is one of the most widely used groups of extensive, strong theoretical and empirical support in the literature and have been extensively cited more than 700 times (Davis 2007). TAM was initially developed by Davis (1989), based on the theoretical 13.
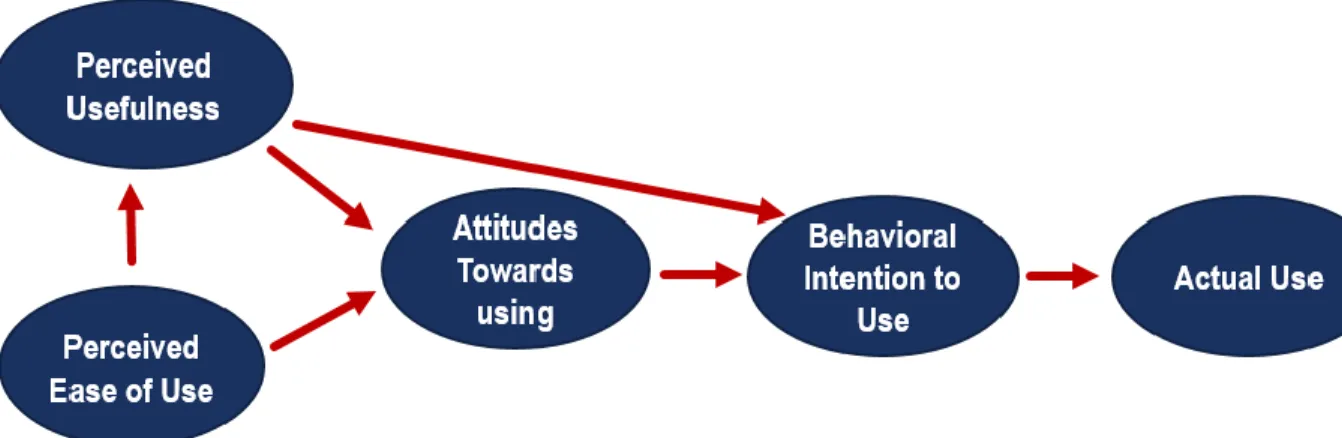
(21) grounding of Theory of Reasoned Action (Fishbein and Ajzen 1977). The goal of TAM is “to provide an explanation of the determinants of computer acceptance that is general, capable of explaining user behavior across a broad range of end-user computing technologies and user populations, while at the same time being both parsimonious and theoretically justified” (David 1989, p. 985). From a technology acceptance perspective, TAM is widely known and also the most frequently cited and influential model (Venkatesh 2000, Venkatesh and Davis 2000, Venkatesh, Speier et al. 2002, Ma and Liu 2004). According to David (1989), actual use is determined by behavioral intention to use which then depends on attitudes towards using. The two important determinants namely perceive usefulness and perceived ease of use jointly impact attitudes towards using, while perceived ease of use has a direct impact on perceived usefulness. Based on TAM, the research therefore defines the first hypothesis as follow: H1: ET/LS adoption attitude is significantly related to adoption intention.. Figure 2-2: Technology Acceptance Model. Additionally, there are two main facets of determinants that influence adoption attitude, namely technological and psychological facets. Also, different users with regard to their roles will likely have different needs and wants in the use of technology, therefore exploring the moderation effect of user types on the model is also essential. Therefore, based on the TAM, the research thesis will propose and examine a research model that considers the Technological facet, Psychological facet, and Use propensity to deepen the understanding of ET/LS adoption intention.. 14.
(22) 2.3.1 Technological facet ET/LS has dramatically changed the concept of traditional learning. To successfully develop and implement the system, it is vital that universities recognize the success factors of ET/LS. In TAM theory, David (1989) defined perceived usefulness as a person’s belief that that he/ she can enhance his/her job performance better by using a particular system. Also, he stated that perceived ease of use is a person’s belief that he/ she can gain free of effort by using a particular system. There was a research that attempted to consider some extrinsic and intrinsic motivators of technology acceptance (Lee, Cheung et al. 2005). Extrinsic motivation is a strong desire to perform and action that springs from outside influence, while intrinsic motivation originates from inside of the individual. It has been posited that perceived usefulness and perceived ease of use are extrinsic motivators which have being proved to be the key determinants of the acceptance and use ET/LS. Despite the fact that perceived usefulness and perceived ease of use are believed to be indispensable in ET/LS adoption, it seems that these two factors are not enough to fully explain how users come to accept and use a technology. To reflect a broader view and provide a more thorough explanation of IT adoption, there is a need to include other components (Legris, Ingham et al. 2003). Therefore, one study in 2010 mentioned another factor, perceived functionality as the degree to which a tool is used effectively and efficiently and when the user is satisfied (Siegenthaler, Wurtz et al. 2010). Put differently, system functionality refers to the flexible access to instructional and assessment media that ET/LS can offer. No matter how ET/LS is used as a supplementary tool in blended learning or a stand-alone distance education method, it is worthless if users fail to use it. In ET/LS adoption context, system functionality has strong impact on use belief construct (Pituch and Lee 2006). Pituch and Lee conducted a study to seek explanation of student use of ET/LS among 259 students who were given a demonstration of the e-learning system of Cyber University at National Sun Yat-sen University in Taiwan. There were two clear contexts of the system: blended learning and virtual classroom. For both outcomes, among the external variables, system functionality had the strongest total effect, even stronger than perceived usefulness and perceived ease of use. Overall, in this research, perceived usefulness, perceived ease of use and perceived functionality will be grouped into technological facets. In other word, three characteristics mentioned above are system characteristics used in predicting user ET/LS acceptance that need 15.
(23) validating in the model. The research therefore defines the second hypothesis along with three subhypotheses as follows. H2: Technological features of ET/LS are significantly related to adoption attitude. H2-1: Perceived usefulness of ET/LS is significantly related to adoption attitude. H2-2: Perceived ease of use of ET/LS is significantly related to adoption attitude. H2-3: Perceived functionality of ET/LS is significantly related to adoption attitude. 2.3.2 Psychological facet Apart from technological facet, there is another aspect which contributes to ET/LS adoption of users. Put it simply, it is psychological facet which consists of perceived playfulness and social influence. First, perceived playfulness was defined as the degree to which users show three features below simultaneously (Moon and Kim 2001). Users perceive that they totally focus and pay attention when interacting with the system. Also, during the time of interaction, they maintain intense curiosity. Last, users find the interaction enjoyable and stimulating. In technology acceptance research, most of the studies have been conducted from an extrinsic motivation perspective. Besides extending TAM in the research, Moon and Kim also proposed a new variable, perceived playfulness, to enhance understanding of an individual's acceptance behavior. Some preliminary work was carried out ago in 1992 when Martocchio and Webster demonstrated that users would perform better and express higher affective responses to computer tasks when they are considered to be high on playfulness trait (Martocchio and Webster 1992). In the later research in 2005, Lee, Cheung, and Chen postulated perceived playfulness or perceived enjoyment as a form of intrinsic motivation, a feeling of pleasure and joy inside an individual when he or she performs an action (Lee, Cheung et al. 2005). The second factor is social influence, which were defined as processes determine the individual user’s commitment, or more specifically, psychological attachment, to the use of any new information technology (O'Reilly and Chatman 1986). Preliminary work on technology adoption was undertaken by Kelman reported that social influence causes changes in attitudes and actions at different levels (Kelman 1958). Though the final result of action may appear the same, the 16.
(24) underlying processes may be different. More specifically, different processes of social influence that affect invidiual behavior are separated into 3 stages: compliance, identification, and internalization. More importantly, TAM has been a pivotal and robust predictive model in understanding technology usage and technology acceptance (Robey 1996, King and He 2006). However, since TAM only emphasized the system characteristics and did not bring up social influence in the adoption of the new information system, some researchers in the field noted that TAM has still been incomplete and needed further extension of the theory (Davis 1989, Davis, Bagozzi et al. 1989, Melone 1990, Hufnagel and Conca 1994). In the research of investigating social influence in TAM, Malhotra and Galletta (1999) pointed out Kelman's three processes of social influence have direct effects on the users' attitude and indirect effects on their behavioral intention via attitude (Malhotra and Galletta 1999). Similarly, the research therefore defines the third hypothesis along with three sub-hypotheses as follows. H3: Psychological features of ET/LS are significantly related to adoption attitude. H3-1: Perceived playfulness of ET/LS is significantly related to adoption attitude. H3-2: Social influence of ET/LS is significantly related to adoption attitude.. 2.3.3 Use Propensity Recently, ET/LS has been deployed in universities and educational institutions for providing new and innovative ways for delivering education. Many studies in this field have drawn attention to students as main subjects and tried to identify factors which affect the acceptance of ET/LS technology of students (Brown 2002, Lee, Cho et al. 2003, Saadé and Bahli 2005, Pituch and Lee 2006, Roca, Chiu et al. 2006, Chiu and Wang 2008, Lee 2008, Lee, Yoon et al. 2009). There have been less studies which target lecturers, some researches on this type of user has carried out by Liaw, Huang, and Chen (2007); Sánchez-Franco, Martínez-López, and Martín-Velicia (2009); Teo, Lee, Chai, and Wong (2009); Wang and Wang (2009). (Liaw, Huang et al. 2007, SánchezFranco, Martínez-López et al. 2009, Teo, Lee et al. 2009, Wang and Wang 2009) From a broader viewpoint, to ensure the successful implementation of ET/LS, it must be accepted and used by lecturers who use these technologies for providing learning materials to their. 17.
(25) students (ŠUmak, HeričKo et al. 2011). It is meaningless to provide large quantities of equipment if lecturers do not have any incentive to change their classroom practices (Jones 2004). When users are introduced about a new information technology, they are influenced by many factors to decide whether they are going accept and use not. The weight of impact of these factors may not remain unchanged for different types of users. Therefore, the research thesis also examines the moderation effect of user types, lecturer and learner, on the model. The research defines the forth and the fifth hypothesis along with three sub-hypotheses as follows. H4: User type significantly moderates the effect of technological features of ET/LS on adoption attitude. H4-1: User type significantly moderates the effect of perceived usefulness of ET/LS on adoption attitude. H4-2: User type significantly moderates the effect of perceived ease of use of ET/LS on adoption attitude. H4-3: User type significantly moderates the effect of perceived functionality of ET/LS on adoption attitude. H5: User type significantly moderates the effect of psychological features of ET/LS on adoption attitude. H5-1: User type significantly moderates the effect of perceived playfulness of ET/LS on adoption attitude. H5-2: User type significantly moderates the effect of social influence of ET/LS on adoption attitude.. 18.
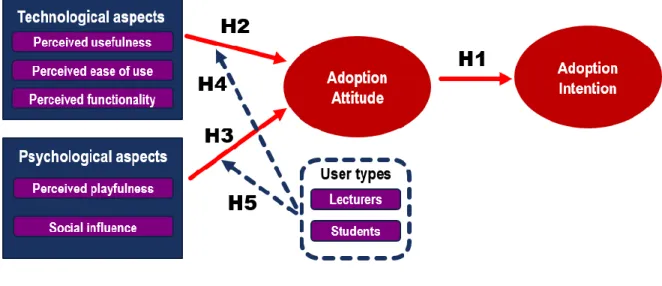
(26) CHAPTER 3 : RESEARCH METHOD. The chapter aims to introduce the philosophical assumptions underlying this research and to present the research methodology and the empirical techniques applied. The general goal of this study is to investigate the acceptance of both lecturers and students to adopt E-Teaching/Learning system, as well as to compare the differences in those two types of users. The idea is whether the technological and psychological aspects influence the users’ attitude, and eventually has any effect on the users’ adoption intention. In addition, the types of users are also addressed and examined since they may have different impact on different types of lecturers and learners who adopt ETeaching/Learning system. The research method used was largely based on empirical observation and was conducted via two non-overlapping stages, one was to conduct surveys on the mentioned above subjects and another was to analyze the results to answer to the hypotheses.. 3.1 Research Model According to the literature review discussed in Chapter 2, the research model was developed, as shown in Figure 3-1. There are two types of aspects in the model. One is technological aspect and another is the psychological aspect. The independent variables for the technological aspect are perceived usefulness, perceived ease of use and perceived functionality. On the other hand, for psychological aspect, the independent variables are perceived playfulness and social influence. The dependent variables are adoption attitude and adoption intention. The relationship between technological, psychological aspects and adoption attitude is also defined. This also leads to the final decision of lecturers and learners whether they are going to use the ET/L system to support their teaching and learning processes toward education merits. The research hypotheses could be presented as follows. In addition, operational definitions of variables are also demonstrated in Table 3-1.. 19.
(27) Figure 3-1: Research Model H1: ET/LS adoption attitude is significantly related to adoption intention H2: Technological features of ET/LS are significantly related to adoption attitude H2-1: Perceived usefulness of ET/LS is significantly related to adoption attitude H2-2: Perceived ease of use of ET/LS is significantly related to adoption attitude H2-3: Perceived functionality of ET/LS is significantly related to adoption attitude H3: Psychological features of ET/LS are significantly related to adoption attitude H3-1: Perceived playfulness of ET/LS is significantly related to adoption attitude H3-2: Social influence of ET/LS is significantly related to adoption attitude H4: User type significantly moderates the effect of technological features of ET/LS on adoption attitude H4-1: User type significantly moderates the effect of perceived usefulness of ET/LS on adoption attitude H4-2: User type significantly moderates the effect of perceived ease of use of ET/LS on adoption attitude H4-3: User type significantly moderates the effect of perceived functionality of ET/LS on adoption attitude 20.
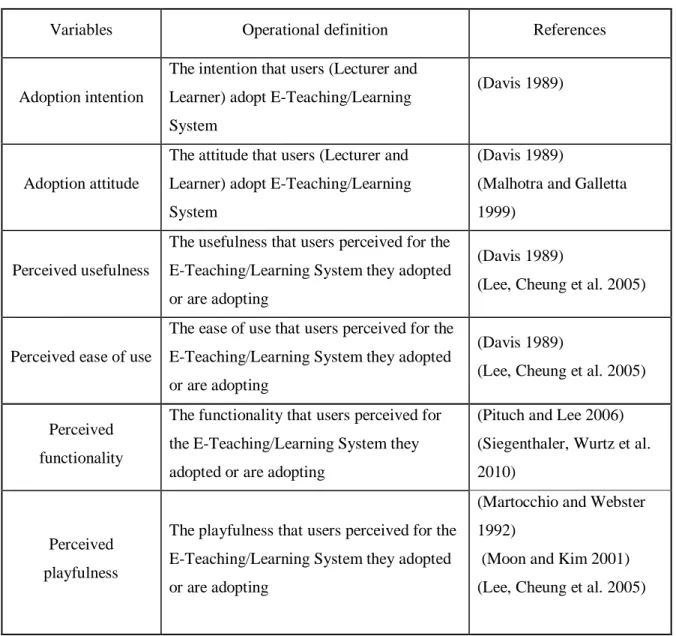
(28) H5: User type significantly moderates the effect of psychological features of ET/LS on adoption attitude H5-1: User type significantly moderates the effect of perceived playfulness of ET/LS on adoption attitude H5-1: User type significantly moderates the effect of social influence of ET/LS on adoption attitude. Table 3-1: Operational definition Variables. Operational definition The intention that users (Lecturer and. Adoption intention. Learner) adopt E-Teaching/Learning. References (Davis 1989). System. Adoption attitude. The attitude that users (Lecturer and. (Davis 1989). Learner) adopt E-Teaching/Learning. (Malhotra and Galletta. System. 1999). The usefulness that users perceived for the Perceived usefulness. E-Teaching/Learning System they adopted or are adopting The ease of use that users perceived for the. Perceived ease of use. E-Teaching/Learning System they adopted or are adopting. Perceived functionality. (Davis 1989) (Lee, Cheung et al. 2005). (Davis 1989) (Lee, Cheung et al. 2005). The functionality that users perceived for. (Pituch and Lee 2006). the E-Teaching/Learning System they. (Siegenthaler, Wurtz et al.. adopted or are adopting. 2010) (Martocchio and Webster. Perceived playfulness. The playfulness that users perceived for the. 1992). E-Teaching/Learning System they adopted. (Moon and Kim 2001). or are adopting. (Lee, Cheung et al. 2005). 21.
(29) Social influence. The social influence that users perceived. (Kelman 1958). for the E-Teaching/Learning System they. (O'Reilly and Chatman. adopted or are adopting. 1986). The moderators (lecturers and students) that User types. adopted or are adopting E-Teaching/. (ŠUmak, HeričKo et al. 2011). Learning System. 3.2 Sample To better focus on E-Teaching/Learning system, the research targeted lecturers and students who are currently using or will be using the E-system in teaching and learning. They are all from different departments in major universities in Ho Chi Minh City, Vietnam. The approached departments were specified based on the balance between Social Studies and Science/ Technology specialization. A list of surveyed schools and departments are provided in the Table 3-2. Data collection was based on an online questionnaire which was sent through social media, such as Facebook and Google+. Qualified participants are subjects who are experienced in or will be using E-Teaching/Learning system.. Table 3-2: Surveyed schools and departments University code Department. Number of. Number of qualified. participants. responses. Instructors. Students. Instructors. Students. 15. 15. 15. 15. 15. 15. 15. 15. 15. 15. 15. 15. Social Studies Ho. Chi. University. Minh of. City. Pedagogy. (HCMUP) Ho. Chi. University. Minh of. City Foreign. Languages and Information Technology (HUFLIT) Ho. Chi. University. Minh of. -English -Literature. -International Relationship -Translation. City -Journalism and Social Communication 22.
(30) Sciences and Humanities. -Linguistics. (HCMUSSH) -Psychology Sai Gon University (SGU). -International. 15. 15. 15. 15. 15. 15. 15. 15. 15. 15. 15. 15. 15. 15. 15. 15. 15. 15. 15. 15. 15. 15. 15. 15. 15. 15. 14. 15. Studies -Foreign Nguyen. Tat. Thanh. University (NTTU). Languages -Tourism and Vietnamese Studies Science/ Technology -Applied. Ton Duc Thang University Sciences (TDTU). -Electric and Electrical Engineering. University of Economics. -Economics. Ho Chi Minh City (UEH). -Public Finance -Electronic. Industrial University of Ho Technology Chi Minh University (IUH). -Chemical Engineering. Ho. Chi. Minh. City. University of Technology (HCMUT). Ho. Chi. University (HCMUS). -Materials Technology -Transportation Engineering. Minh of. City Science. -Biology and Biotechnology -Information Technology. 23.
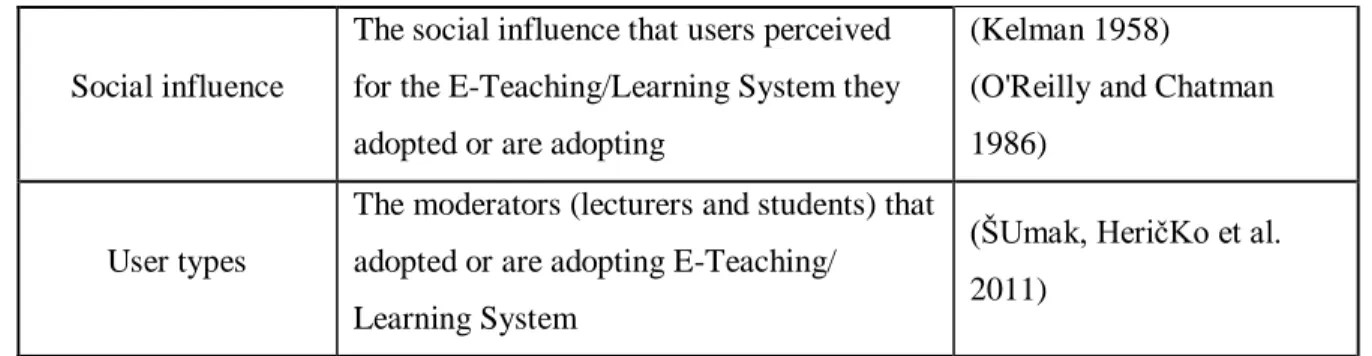
(31) 3.3 Measure Based on the previous reviews and research argument, the questionnaire was developed as presented in Table 3-3. It was based on a Likert 5-digit scale; where 5 represents strongly agree with the statement while 1 strongly disagrees. The questionnaire items were used to ask for how subjects perceive to the adoption intention, adoption attitude, technological appeal, and psychological appeal based on their aspects, understanding, expectation, experiences, and cognition. Although the questions did not seem so complex, it in fact, was used to help extract useful indications in order for the current research. The details are shown in Appendix. The first part of the questionnaires asked the subjects’ basic information, including age, gender, teaching/learning seniority, department. The latter part of it was about the subjects’ perception toward the quoted statements regarding all the variables. If one felt that statement close to his or her perception, he or she would give a higher score to that specific part. On the other hand, if disagreement with the questions, he or she would score a lower value.. Table 3-3: The designed questionnaire for variables (for lecturer) Facet. Variables and research. Measure items. arguments Perceived usefulness:. PU1: I think ET/LS can improve the learning. Subjects perceive that ET/LS. efficiency.. is useful, that induces positive. PU2: I think ET/LS can improve the quality of my. adoption attitude toward. learning.. adoption intention. PU3: I think ET/LS can reduce learning work load. PU4: Overall, I think ET/LS is useful.. Technological aspect. Perceived ease of use:. PEU1: I think ET/LS is not difficult to use.. Subjects perceive that ET/LS. PEU2: I do not need too much efforts to learn how. is easy to use, that induces positive adoption attitude. to use ET/LS in learning. PEU3: I do not need much time to learn how to use. toward adoption intention. ET/LS in teaching. PEU4: Overall, it is easy to use ET/LS in teaching. Perceived functionality:. PF1: I think ET/LS contains functions that I can use in teaching.. 24.
(32) Subjects perceive that ET/LS. PF2: I think functions of ET/LS are sufficient.. is functional, that induces. PF3: Overall, I am satisfied with the functions of. positive adoption attitude. ET/LS for teaching.. toward adoption intention. Perceived playfulness:. PP1: I think ET/LS is interesting.. Subjects perceive that using. PP2: I feel playful when I use ET/LS in teaching.. ET/LS is playful and. PP3: I enjoy using ET/LS in teaching. enjoyable, that induces. PP4: Overall, I am happy to use ET/LS in teaching.. positive adoption attitude toward adoption intention Psychological aspect. Social influence:. SI1: I think using ET/LS in teaching can help in. Subjects perceive that using. developing relationships with students.. ET/LS can develop social. SI2: I think using ET/LS in teaching can help in. value, that induces positive. developing relationships with colleagues.. adoption attitude toward. SI3: I think using ET/LS in teaching can help in. adoption intention. developing reputation. SI4: Overall, I think using ET/LS in teaching has social value in school.. Subjects are willing to use. AA1: I think using ET/LS is a good idea in. ET/LS. teaching.. Adoption. AA2: I think using ET/LS seems helpful in. attitude. teaching. AA3: I think I have a positive attitude toward the use of ET/LS. Subjects are ready to use ET/LS.. INT1: I will be willing to use ET/LS. INT2: I will be happy to use ET/LS now and in the. Adoption. future.. intention. INT3: Overall, I am (will be) sure to use ET/LS in teaching.. 25.
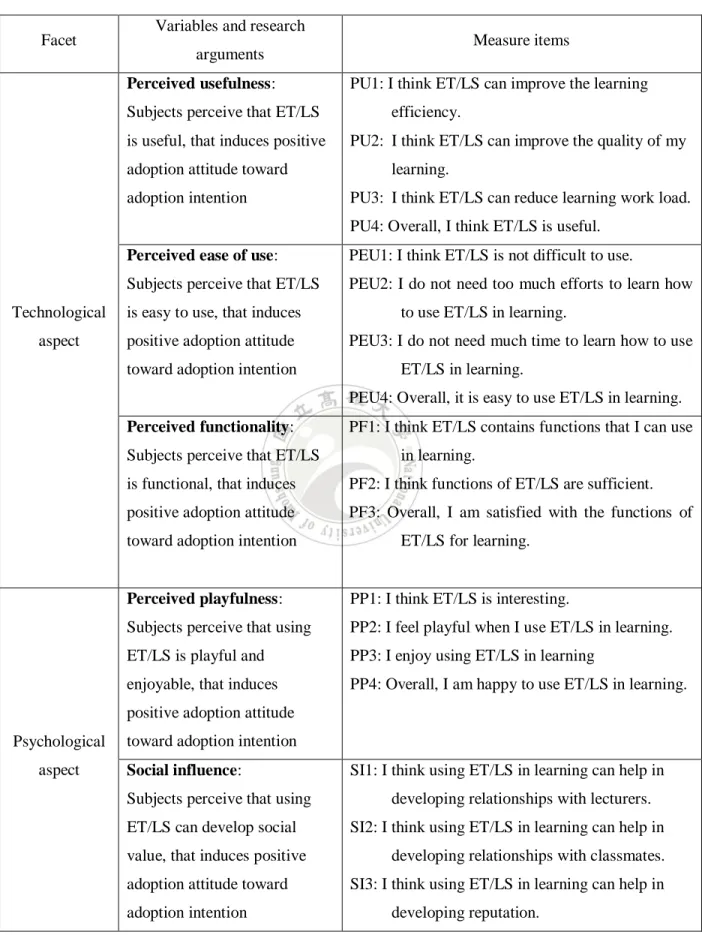
(33) Table 3-4: The designed questionnaire for variables (for student) Facet. Variables and research. Measure items. arguments Perceived usefulness:. PU1: I think ET/LS can improve the learning. Subjects perceive that ET/LS. efficiency.. is useful, that induces positive. PU2: I think ET/LS can improve the quality of my. adoption attitude toward. learning.. adoption intention. PU3: I think ET/LS can reduce learning work load. PU4: Overall, I think ET/LS is useful.. Perceived ease of use:. PEU1: I think ET/LS is not difficult to use.. Subjects perceive that ET/LS. PEU2: I do not need too much efforts to learn how. Technological. is easy to use, that induces. aspect. positive adoption attitude. to use ET/LS in learning. PEU3: I do not need much time to learn how to use. toward adoption intention. ET/LS in learning. PEU4: Overall, it is easy to use ET/LS in learning.. Perceived functionality:. PF1: I think ET/LS contains functions that I can use. Subjects perceive that ET/LS. in learning.. is functional, that induces. PF2: I think functions of ET/LS are sufficient.. positive adoption attitude. PF3: Overall, I am satisfied with the functions of. toward adoption intention. ET/LS for learning.. Perceived playfulness:. PP1: I think ET/LS is interesting.. Subjects perceive that using. PP2: I feel playful when I use ET/LS in learning.. ET/LS is playful and. PP3: I enjoy using ET/LS in learning. enjoyable, that induces. PP4: Overall, I am happy to use ET/LS in learning.. positive adoption attitude Psychological aspect. toward adoption intention Social influence:. SI1: I think using ET/LS in learning can help in. Subjects perceive that using. developing relationships with lecturers.. ET/LS can develop social. SI2: I think using ET/LS in learning can help in. value, that induces positive. developing relationships with classmates.. adoption attitude toward. SI3: I think using ET/LS in learning can help in. adoption intention. developing reputation.. 26.
(34) SI4: Overall, I think using ET/LS in learning has social value in school. Subjects are willing to use. AA1: I think using ET/LS is a good idea in. ET/LS.. learning.. Adoption. AA2: I think using ET/LS seems helpful in. attitude. learning. AA3: I think I have a positive attitude toward the use of ET/LS.. Adoption. Subjects are ready to use. INT1: I will be willing to use ET/LS.. ET/LS.. INT2: I will be happy to use ET/LS now and in the future.. intention. INT3: Overall, I am (will be) sure to use ET/LS in learning.. 3.4 Data Analysis and Techniques The research thesis utilized statistics techniques to analyze the collected valid data from subjects. The analysis results were used to test the hypothesis and derive research findings. To do so, first, construct and item reliability was used to ensure that internal consistency was acceptable, based on the Cronbach’s alpha. The Cronbach’s alpha coefficient value that above 0.8 is considered highly reliable, greater than 07 and less 0.8 is considered very good, between 0.7 and 0.6 is good, and over 0.5 but less than 0.6 is still acceptable, while value below 0.5 will be considered low reliability. The case in low reliability was rejected and the corresponding item was removed to try enhancing internal construct reliability. Second, the exploratory factor analysis was conducted to reduce dimensions as precisely as possible to reach certain factors according to the research expectation. Question items that present similar loadings or those may lower the reliability were removed to enhance the power of factor formation. Finally, structural equation model was established and hypotheses defined were tested. The computer software, e.g., SPSS, was utilized to ease the data analysis. Results are described in Chapter 4.. 27.
(35) CHAPTER 4 : RESULTS AND DISCUSSION 4.1 Descriptive Statistics The research was limited to ten universities in Ho Chi Minh City only. For reasons of accessibility, not all education institutions in geographical regions in Ho Chi Minh City were included in this study. Criteria for selecting the subjects were that the ten educational institutions had already implemented an ET/LS, which were acknowledged and recognized by the public. Educational organizations with no ET/LS implemented intention were not included. The group of educational institutions examined in this study is top ranked universities within the Vietnam higher education system in Ho Chi Minh City. In addition, the study did not include analysis of actual budgets; financial operations and funding or other factors related ET/LS implementation. The names of targeted universities are already mentioned in Chapter 3. To achieve a broader perspective of ET/LS adoption, half of departments chosen was specialized in Social studies and half was Science/Technology. The measurement items have been validated in prior studies and modified to fit the research purpose and context. The definitions of the constructs are outlined in Chapter 3, while questionnaire items are listed in Appendix A. Two separate surveys were designed to suit different type of users. Respondents were asked to evaluate the significance of measurement items using a Likert scale of 1–5, where a value of 5 represented ‘‘strongly agree,’’ and 1 represented ‘‘strongly disagree”. These include 4 items of perceived usefulness (PU), 4 items of perceived ease of use (PEU), 3 items of perceived functionality, 4 items of perceived playfulness, 4 items of social influence (SI), 3 items of adoption attitude (AA), and 3 items of adoption intention (AI). The study sample consisted of lecturers and students selected from universities in Ho Chi Minh City. A total of 10 universities agreed to participate and an online questionnaire which was sent through social media. A total of 300 replies were returned, though one was incomplete and so discarded. In this way, 299 samples were used for the data analysis, with 149 lecturers and 150 students. Table 4-1 shows the demographics of the respondents.. 28.
(36) Table 4-1: Demographic information of respondents Measurement. Items. Frequency. Percent. 1-5 years. 17. 11.41. 6-10 years. 60. 40.27. 11-15 years. 56. 37.58. Over 15 years. 16. 10.74. Less than 1 year. 12. 8.05. 1-2 year(s). 27. 18.12. 3-4 years. 38. 25.51. Over 5 years. 72. 48.32. Freshman. 8. 5.30. Sophomore. 49. 32.7. Junior. 74. 49.3. Senior. 19. 12.7. Less than 1 year. 14. 9.33. 1-2 year(s). 57. 38.00. Over 2 years. 79. 52.67. Lecturers Teaching experience. ET/LS experience. Students Current school status. ET/LS experience. 4.2 Reliability, Factor Analysis and Validity Cronbach’s alpha was used to assess the internal consistency of the proposed constructs, which means how closely related a set of items are as a group. Thus, Cronbach’s alpha is considered to be a measure of scale reliability. Table 4-2 summarizes the alpha value for each construct identified and used. All as ranged from 0.868 to 0.902 and these are greater than 0.8. As a result, the constructs were considered reliable.. 29.
(37) Table 4-2: Results of Reliability Tests Variables. Item. Average. Standard dev.. Item to total. PU1. 3.65. 1.030. 0.687. PU2. 3.80. 0.994. 0.661. PU3. 3.64. 1.106. 0.748. PU4. 3.77. 1.023. 0.820. PEU1. 3.42. 1.222. 0.708. Perceived Ease. PEU2. 3.55. 1.055. 0.730. of Use (PEU). PEU3. 3.55. 1.074. 0.811. PEU4. 3.57. 1.083. 0.839. Perceived Usefulness (PU). Perceived. PF1. 3.49. 1.185. 0.703. Functionality. PF2. 3.37. 1.114. 0.668. (PF). PF3. 3.48. 1.112. 0.879. PP1. 3.58. 1.125. 0.697. PP2. 3.54. 1.069. 0.743. PP3. 3.61. 0.992. 0.816. PP4. 3.60. 1.062. 0.869. 3.37. 1.244. 0.712. 3.50. 1.130. 0.717. 3.52. 1.145. 0.841. 3.61. 1.128. 0.813. Perceived Playfulness (PP). Social Influence (SI). SI1 SI2 SI3 SI4. Adoption. AA1. 3.72. 1.216. 0.787. Attitude. AA2. 3.81. 1.080. 0.722. (AA). AA3. 3.75. 1.119. 0.873. Adoption. AI1. 3.66. 1.164. 0.791. Intention. AI2. 3.72. 1.105. 0.732. (AI). AI3. 3.68. 1.099. 0.871. Cronbach’s Alpha. 0.873. 0.898. 0.868. 0.902. 0.897. 0.894. 0.897. For factor analysis, Kaiser-Meyer-Olkin (KMO) test was carried out by using SPSS to measure sampling adequacy for each variable in the model and for the complete model. According to Kaiser (1974), he recommended that values great than 0.5 are acceptable (Kaiser 1974). In addition, values between 0.5 and 07 are mediocre, values between 0.7 and 0.8 are good, values between 0.8 and 0.9 are meritorious, and values above 0.9 are superb (Hutcheson and Sofroniou 1999). For the data, the value is 0.936, which belongs to the range of superb. Thus, factor analysis is appropriate 30.
(38) for the data. The variance of the model is 84.77%, which is very acceptable. Table 4-3: Results of Factor Analysis test Variable. Item 1. 2. 3. 4. 5. 6. 7. PEU3. .833. .200. .177. .152. .115. .153. .109. PEU4. .768. .179. .215. .262. .241. .124. .194. PEU2. .757. .172. .291. .013. .170. .209. .136. PEU1. .675. .206. .159. .417. .111. .063. .132. SI3. .219. .801. .203. .208. .123. .162. .197. SI2. .206. .746. .110. .172. .087. .413. -.001. SI1. .209. .716. .197. .043. .324. -.025. .329. SI4. .178. .694. .225. .442. .173. .134. .207. PU3. .234. .223. .802. .124. .064. .265. -.017. PU1. .185. .152. .781. .158. .221. .026. .208. PU4. .340. .174. .715. .205. .251. .150. .226. AA1. .261. .211. .222. .809. .175. .133. .182. (AA). AA3. .286. .359. .194. .697. .235. .238. .219. Perceived. PF1. .182. .205. .221. .181. .850. .132. .150. (PF). PF3. .321. .244. .229. .198. .709. .319. .132. Perceived Playfulness (PP). PP3. .258. .323. .247. .177. .221. .729. .177. PP4. .287. .208. .251. .245. .375. .619. .294. Adoption. AI1. .275. .308. .208. .233. .207. .198. .758. AI3. .285. .370. .222. .380. .168. .235. .619. Perceived Ease of Use (PEU). Social Influence (SI). Perceived Usefulness (PU) Adoption Attitude. Functionality. Intention (AI). * PEU= Perceived Ease of Use; SI= Social Influence; PU= Perceived Usefulness; AA= Adoption Attention; PF= Perceived Functionality; PP= Perceived Playfulness; AI= Adoption Intention. 31.
(39) Table 4-3 depicts the results of factor analysis test. In each construct, some the items (PU2, PF2, PP1, PP2, AA1, AI1) were deleted due to their low factor loading and to increase the model fit due to the complexity of the whole model. All of factor loadings of the items remain in the research model were greater than 0.60. Lastly, Table 4-4 summarizes discriminant validity and correlation matrix. Table 4-4: Discriminant Validity and Correlation Matrix. PEU SI PU AA PF PP AI. CR. AVE. PEU. SI. PU. AA. PF. PP. AI. 0.84. 0.58. 0.76. -. -. -. -. -. -. 0.83. 0.55. 0.585. 0.74. -. -. -. -. -. 0.81. 0.59. -0.585. -0.053. 0.77. -. -. -. -. 0.73. 0.57. 0.059. 0.366. 0.488. 0.76. -. -. -. 0.76. 0.61. 0.280. 0.364. -0.174. -0.734. 0.78. -. -. 0.63. 0.46. 0.118. 0.175. -0.004. -0.355. 0.288. 0.68. -. 0.65. 0.48. 0.031. 0.211. 0.024. 0.307. 0.352. -0.383. 0.69. * Diagonal elements (in bold and italic) are the square root of the average variance extracted (AVE). Offdiagonal elements are the correlations among constructs * PEU= Perceived Ease of Use; SI= Social Influence; PU= Perceived Usefulness; AA= Adoption Attention; PF= Perceived Functionality; PP= Perceived Playfulness; AI= Adoption Intention. To examine discriminant validity, the shared variances between constructs is compared with the AVE of the individual constructs. This can be demonstrated by the fact that the square root of AVE of each construct should be generally greater than the coefficient of other variables, which means diagonal elements should be larger than off-diagonal elements to achieve discriminant validity (Fornell and Larcker 1981). Moreover, the Composite Reliability (CR) of each construct was over 0.7 and the Average Variance Extract (AVE) across five out of seven of the constructs exceeded 0.5. There were two constructs which came close to 0.5 in AVE. Overall, the measurement model demonstrated adequate reliability, convergent validity, and discriminant validity.. 32.
(40) 4.3 Analysis Results The hypothesis test of the model for the total samples was carried out by using SPSS. The test was needed to conduct three separate times (Total, Lecturers, Students) and there were two levels on each test. At first, in level 1, data collected was made into tables to test hypothesis of this study, which were on association between the independent variable, adoption attention (AAA), and the dependent variable, adoption intention (AIA). Then, two facets, technological (TA) and psychological (SA), were continued being examined with adoption attention (AAA). In level 2, three factors in technological facet which are perceive usefulness (PUA), perceived ease of use (PEUA), perceived functionality (PFA) and two factors in psychological facet which are perceived playfulness (PFA), social influence (SIA) were respectively examined to see whether each factor has any significant relationship with adoption attention (AAA). The significance level was set as *p<0.1, **p<0.05, ***p<0.01. The results of causal relationships among the constructs which stated in hypotheses are shown in table 4-5. To take a look in more detail at those relationships between variables and measure the moderation test of use propensity, the hypothesis test was conducted for each type of user (lecturers, students). Procedure of the test was the same as for Total, which also included two levels. The results are illustrated in Table 4-6 and Table 4-7.. 33.
(41) Table 4-5: Results of Hypothesis test of Total Dep. V Indep V.. AAA(H1). AIA. AAA. β. t value. p-value. VIF. 0.719***. 17.788. <.0001. 1.000. β. t value. AAA p-value. VIF. β. t value. S/NS p-value. VIF S. R²= 0.517 TA(H2). 0.370***. 5.940. <.0001. 2.702. S. PA(H3). 0.431***. 6.926. <.0001. 2.702. S. R²=0.576 PUA(H2-1). 0.077. 1.432. 0.153. 2.049. NS. PEUA(H2-2). 0.261***. 4.762. <.0001. 2.130. S. PFA(H2-3). 0.112**. 2.005. <.05. 2.230. S. PPA(H3-1). 0.146**. 2.357. <.05. 2.705. S. SIA(H3-2). 0.311***. 5.689. <.0001. 2.119. S. R²=0.588 *p<0.1, **p<0.05, ***p<0.01. *AIA= Adoption Intention; AAA= Adoption Attention; TA= Technological aspect; PA= Psychological aspect; PU= Perceived Usefulness; PEU= Perceived Ease of Use; PF= Perceived Functionality; PP= Perceived Playfulness; SI= Social Influence; S: Supported; NS: Not supported. 34.
(42) Table 4-6: Results of Moderation test (level 1). Moderation test results Dep. V.: AAA Ind. V.. Total (N=299). Lecturer (n=149). S/NS. Student (n=150). β. t. p. VIF. β. t. p. VIF. β. t. p. VIF. TA(H2). 0.370***. 5.940. <.0001. 2.702. 0.381***. 4.475. <.0001. 3.409. 0.412***. 4.642. <.0001. 1.974. NS. PA(H3). 0.431***. 6.926. <.0001. 2.702. 0.484***. 5.676. <.0001. 3.409. 0.286***. 3.229. <.01. 1.974. NS. R²=0.576. R²=0.689. *p<0.1, **p<0.05, ***p<0.01 *AAA= Adoption Attention; TA= Technological aspect; PA= Psychological aspect; S: Supported; NS: Not supported. 35. R²=0.418.
(43) Table 4-7: Results of Moderation test (level 2) Moderation test results Dep. V.: AAA. S/ NS. Ind. V. Total (N=299). PUA (H2-1) PEUA (H2-2) PFA (H2-3) PPA (H3-1) SIA (H3-2). Lecturers (n=149). β. t value. p-value. VIF. 0.077. 1.432. 0.153. 0.261***. 4.762. 0.112**. Students (n=150). β. t value. p-value. t value. p-value. 2.049. 0.026. 0.444. 0.658. 1.805. 0.180*. 1.942. <.1. 2.130. S. <.0001. 2.130. 0.382***. 5.807. <.0001. 2.267. 0.145. 1.604. 0.111. 2.031. S. 2.005. <.05. 2.230. 0.077. 1.066. 0.288. 2.744. 0.140. 1.638. 0.104. 1.797. S. 0.146**. 2.357. <.05. 2.705. 0.119. 1.462. 0.146. 3.488. 0.229**. 2.480. <.05. 2.111. S. 0.311***. 5.689. <.0001. 2.119. 0.362***. 5.133. <.0001. 2.609. 0.109. 1.345. 0.181. 1.618. S. R²=0.588. VIF. R²=0.727. β. VIF. R²=0.421. *p<0.1, **p<0.05, ***p<0.01. * AA= Adoption Attention; PUA= Perceived Usefulness; PEUA= Perceived Ease of Use; PFA= Perceived Functionality; PPA= Perceived Playfulness; SIA= Social Influence; S: Supported; NS: Not supported. 36.
(44) Based on the chosen significance level (*p<0.1, **p<0.05, ***p<0.01), for the results of Hypothesis test of Total, most of the hypotheses are supported, except H2-1 is not (p = 0.153 > 0.1). In the moderation test, for level 1, the comparison of Total and Lecturers, Total and Students were carried out respectively. The final results show all the p-value got the same number of star (*). Therefore, there is no moderation effect and all the hypotheses are not supported in level 1. In level 2, with the same technique, in the comparison between all samples and lecturers, and between all samples and students, all hypotheses are supported. 4.4 Discussion and Implications 4.4.1 Discussions The results of the hypothesis test of Total highlights that H1, H2, H3, H2-2 and H3-2 are strongly supported. H2-3 and H3-1 are also accepted. The remaining hypothesis H2-1 is unsupported. This reveals there is a significant correlation between adoption attitude and adoption intention, then results of each facet show that both technological and psychological facet have a remarkable relationship with adoption attitude. In addition, in the sub-hypothesis level, no significant relationship is detected between perceived usefulness and adoption attitude. The other sub-hypotheses are supported, which shows that higher level of perceived ease of use, perceived functionality, perceived playfulness and social influence contribute to the willingness of users to adopt and use a new information technology. The research model with general results is in Figure 4-1 and Figure 4-2 and further implications and limitations of this study are discussed in following sections.. 37.
(45) Figure 4-1: Evidence of p-value in Hypothesis test of Total (level 1). Figure 4-2: Evidence of p-value in Hypothesis test of Total (level 2). In the moderation test, two tests were separately conducted based on two different types of users (lecturers and students). The most surprising results to emerge from table 4-6 is that in level 1, both lecturers and students do not moderate the effect of technological features as well as psychological features of ET/LS on adoption attitude. In level 2, since different groups (lecturers and students) show different test results, it presents significant moderation effect in the relationship between all factors and adoption attitude. Thus, H4-H5 are not supported, but H4-1. H4-2, H4-3, H5-1, and H5-2 are supported. To summarize proposition test results in a concise manner, Table 4-8 reveals all hypothesis an d test results. The analysis confirms that H1, H2, H3, H2-2 and H3-2 are strong supported; H2-3 38.
數據
+7

相關文件
本校為一科技大學,學生之來源大多屬技職體系之職業高中及專科學
3.師培生修習教育課程期間,學期成績不及 格學分達該學期修習學分數 1/2、操行成績 未達 80 分或記 2
戶外考察活動 是歷史 科教師於課堂教學 以 外評估學生的常見方法。教師 在外 出之前應為學 生提供 明確的學習目標和 評 估準則。教師可以從以
二、 學 與教: 第二語言學習理論、學習難點及學與教策略 三、 教材:. 運用第二語言學習架構的教學單元系列
在整個學與教過程中,教師按不同因素(如課程和學習目標、學生的興趣、能力和需要等)運 用適切的學與教策略 [
The methodology involved in the study is based on the theory of innovation adoption, including the fact proposed by Holak (1988) that product attributes, consumer characteris- tics
teachers and were significantly better than boys; parents and teachers for junior high school students agree to use LINE attitude and be guided by real
Using Structural Equation Model to Analyze the Relationships Among the Consciousness, Attitude, and the Related Behavior toward Energy Conservation– A Case Study
