國立臺灣體育運動大學運動管理學系碩士班
碩士學位論文
A Confirmative Study of Customer Satisfaction
and Behavior Intensions on Sporting Events
研 究 生:范民娜 –
Phan, Danh Na
指導教授:林文郎 博士
中
華
民
國
103
年
6
月
I
Title of Thesis: A Confirmative Study of Customer Satisfaction and Behavior Intensions
on Sporting Events
Name of Institute: Graduate Institute of Sport Management
Graduate date: June, 2014 Degree Conferred: M.P.E Name of Student: Phan, Danh Na Advisor: Lin, Wen - Long
ABSTRACT
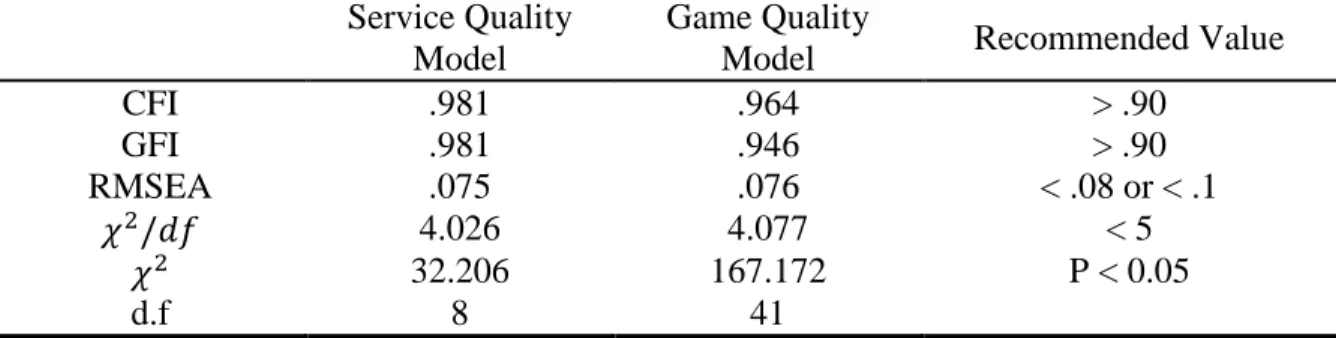
Purpose: The purpose of this study was to investigate the relationships among service quality, game quality, customer satisfaction and behavior intensions in 2014 Vietnam University Games. Methods: The study was conducted to survey in the final round of the games. Data were collected from the spectator’s (n = 536) who were attending the games in Tan Binh arena, Vietnam. Then, Confirm Factor Analysis (CFA) and Structure Equation Model (SEM) were adopted to test relationship among the hypothesis models. Results: Confirmatory factor analysis a measurement model among 7 latent variables including service employees, environment experiences, opponent characteristics, player performance, game atmosphere, customer satisfaction and behavior intensions showed that the model was a good fit (CFI = .952, GFI = .902, RMSEA = .060, ). The second-order-factor model was revealed an inadequate fit to data of service quality model (CFI = .981, GFI = .981, RMSEA = .075, ) and game quality model (CFI = .964, GFI = .946, RMSEA = .076, ). The Structural equation model was also good of fit (CFI = .908, GFI = .877, RMSEA = .082, ). The results indicated that game quality was more important factor than service quality to predict on customer behavior and behavior intensions. On the other hand, customer satisfaction was a partially mediated dimension to behavior intensions of the both service quality and game quality. Conclusion: The results suggest that to organize sporting events successfully in Vietnam, service quality and game quality effects are important factors on customer satisfaction and behavior intensions.
II
Keywords: service quality, game quality, customer satisfaction, behavior intensions, sporting events
III
ACKNOWLEDGMENTS
It was a journey. This thesis could not have been completed without the support and encouragement of my teachers, family and friends. First of all, I would like to express my deepest gratitude to my advisor, Dr. Lin, Wen - Long for his support and guidance throughout the research. His continued support led me to the right way.
I would also like to extend my appreciation to my committee members: Dr. Wang, Chiung - Hsia and Dr. Huang, Shih - Kuei for their advice during my research.
My sincere appreciation is extended to President of National Taiwan University of Physical Education and Sport, Prof. Wen-Jen Su; President of Ton Duc Thang University, Prof. Le Vinh Danh; Dr. Bui, Trong Toai; M.Sc. Nguyen, Van Bac for their great support to joint master program of sport management.
Most importantly, to my family in Vietnam, thank you for supporting my study in Taiwan. Without their love and support I would not have completed the master degree.
Finally, great thanks for my classmates who accompanied with me on the academic way. They were the ones who help me pass difficulties in study.
IV
TABLE OF CONTENTS
ABSTRACT ... I ACKNOWLEDGMENTS ... II TABLE OF CONTENTS ... IV LIST OF FIGURES ... VII LIST OF TABLES ... VIII
CHAPTER 1 INTRODUCTION ... 1
1.1 Statement of the Problems ... 3
1.2 Research Sub-problems ... 3
1.3 Scope of the Study ... 3
1.4 Assumptions ... 4 1.5 Limitations ... 4 1.6 Definition of Terms ... 4 1. Service quality: ... 4 2. Games quality: ... 5 3. Customer satisfaction: ... 5 4. Behavior intension: ... 5 1.7 Summary ... 5
CHAPTER 2 LITERATURE REVIEW ... 7
2.1 Service Quality ... 7
V
2.1.2 Sensory Experiences ... 9
2.2 Game Quality ... 10
2.2.1 Core Product ... 10
2.3 Customer Satisfaction and Behavior Intensions ... 13
2.4 Summary ... 16
CHAPTER 3 METHODOLOGY ... 17
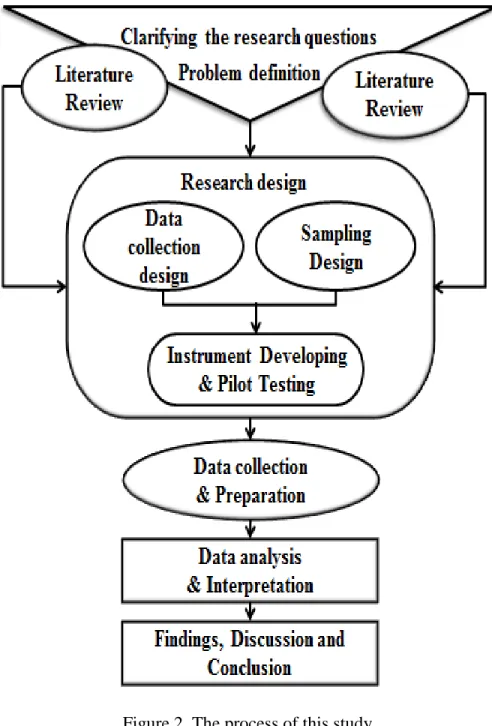
3.1 Research Procedure ... 17
3.2 Subjects ... 19
3.3 Developing Procedure of Instrumentation ... 19
3.3.1 Develop of Instrument ... 20 3.3.2 Validation of Instrument ... 21 3.3 Research Framework ... 23 3.4 Data Collection ... 24 3.5 Data Analysis ... 24 CHAPTER 4 RESULTS ... 26 4.1 Demographic Characteristics ... 26 4.2 Frequency of Variable ... 27 4.3 Descriptive Statistics ... 32 4.3.1 Reliability test ... 32
4.3.2 Factor loading analysis ... 33
VI
4.3.4 CFA Model Parameter ... 38
4.3.5. Confirmatory Factor Analysis ... 41
4.3.6 Estimated Correlations of Latent Variables for CFA ... 43
4.3.7 The Second-order-factor Model ... 44
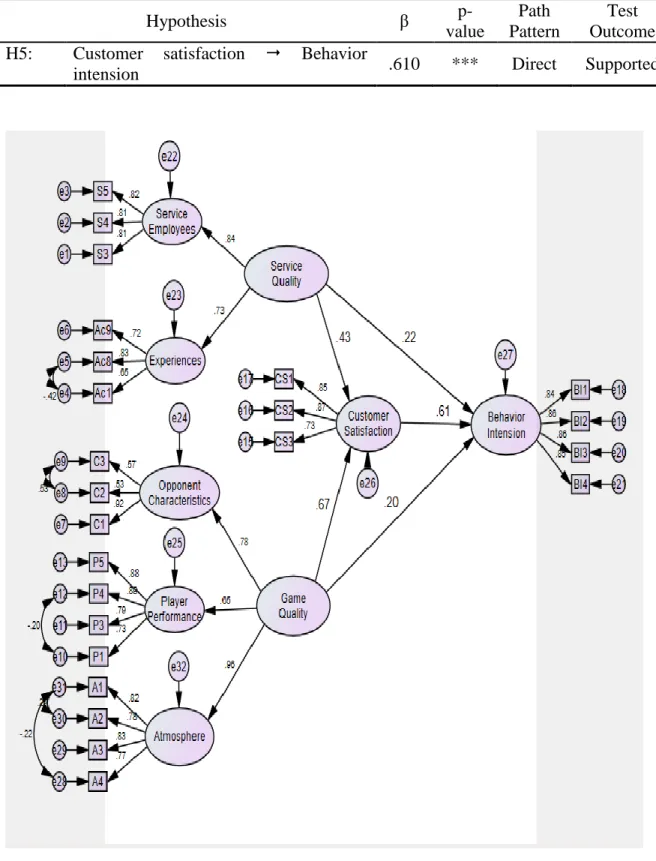
4.3.8. Structure Equation Model ... 46
4.3.9 Individual Hypothesis Testing ... 47
CHAPTER 5 CONCLUSION ... 49
5.1 Overview of the Study ... 49
5.1.1 Service Quality ... 50
5.1.2 Game quality ... 51
5.1.3 Customer Satisfaction and Behavior Intensions ... 51
5.2 Implication of Findings ... 52
5.3 Limitations and Future Research ... 54
5.4 Managerial Implication... 55
REFERENCES ... 56
VII
LIST OF FIGURES
Figure1. Product Levels for A Sporting Event ... 12
Figure 2. The process of this study ... 18
Figure 3. Developing Procedure of Instrument ... 19
Figure 4. The research framework ... 24
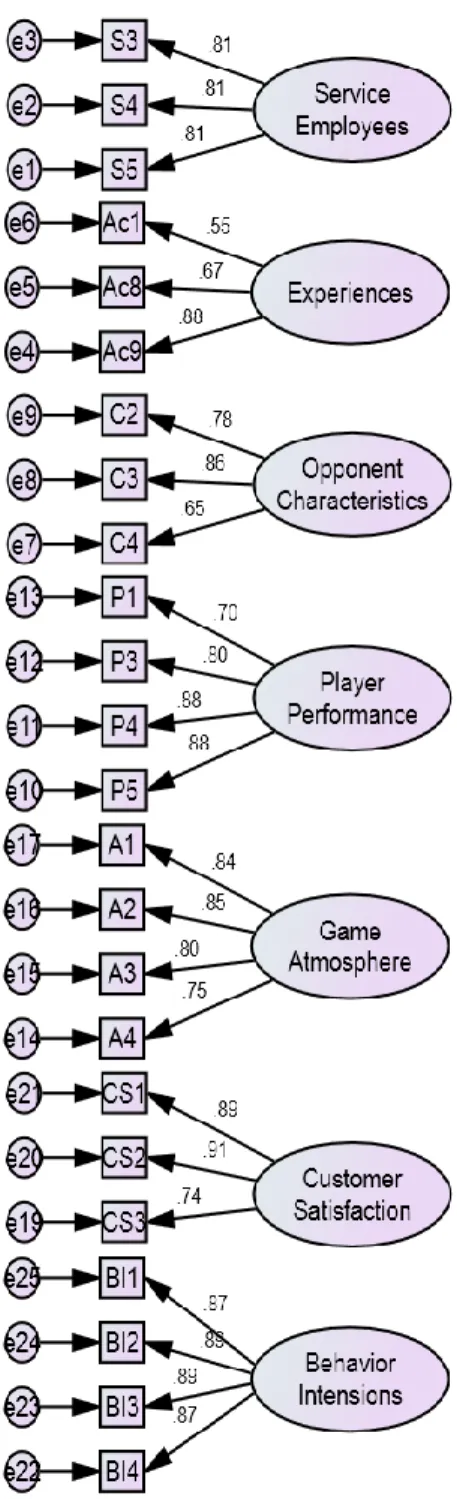
Figure 5. CFA diagrams for the 7 factors with factor loadings ... 40
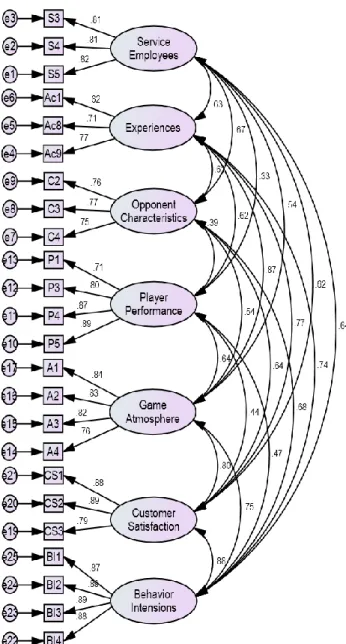
Figure 6. Confirmatory factor analysis a measurement model ... 42
Figure 7. The second-order-factor model for service quality ... 45
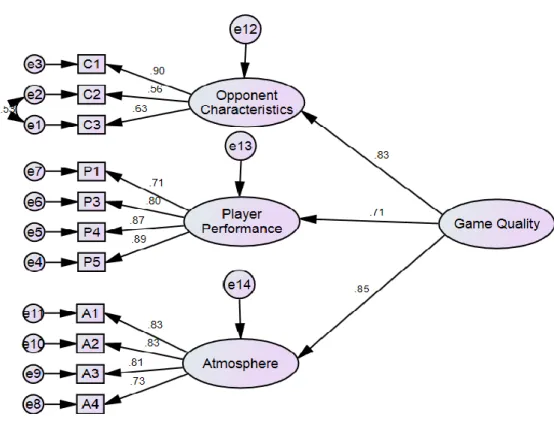
Figure 8. The second-order-factor model for game quality ... 46
VIII
LIST OF TABLES
Table 1 Reliability of coefficient for the Constructs of Pilot Study ... 23
Table 2 Demographic Characteristics (N = 536) ... 27
Table 3 Mean, Standard Deviation and Percentage of Frequencies of Top 5 highest ... 30
Table 4 Mean, Standard Deviation and Percentage of Frequencies of Top 5 lowest ... 31
Table 5 Reliability Estimates for the Constructs ... 32
Table 6 Reliability Estimates for Pilot-test and Post-test ... 33
Table 7 Factor Analysis of the Service Quality Dimension ... 34
Table 8 Factor Analysis of the Game Quality Dimension ... 35
Table 9 Factor Analysis of Customer Satisfaction Dimension ... 37
Table 10 Factor Analysis of Behavior Intensions Dimension ... 37
Table 11 Correlation among the variable in the contrast ... 38
Table 12 Standardized CFA measurement model results ... 39
Table 13 Results of model fit indices for CFA measurement model ... 41
Table 14 Correlation matrix between the CFA measurement model ... 43
Table 15 Estimated Correlation Matrix of Latent Variables for CFA ... 44
Table 16 Results of model fit indices for CFA second-order-model ... 45
Table 17 Results of Model Fit Indices for SEM ... 47
1
CHAPTER 1
INTRODUCTION
Mega sports events such as the Olympic Games, the Football World Cup or the Cricket World Cup have been highly sought after commodities by countries and cities thought the world. These events are viewed as powerful tools for both stimulating economic development as well as gaining international recognition (Hall, 1992; Andranivish et al., 2001; Burbank et al., 2002). Over the past two decades, sports, and the hosting mega events, has assumed a greater role in the economies of developing countries as they attempt to regenerate regional, national and local identities within the globalization process (Holder, 2003; John, 2004).
Since the 1970s, higher income, more leisure time, greater mobility and increasing individualism have contributed to greater participation in organized sports (The United States, Sports Academy, 2009). Sporting is a growing and rapidly evolving multi-billion dollar industry. It was estimated that in 1995 total the United States domestic sports consumption and investment was worth $151.9 billion, making the sports industry the nation’s 11th largest industry. By the end of the 1990s the size of the sports industry had grown to $213 billion (Mahoney & Howard, 2001). In 2011, sporting in the United States had become a $422 billion industry (Plunkett Research, 2011), almost doubling the industry in 5 years. McPherson, Curtis, and Loy (1989) conceptualized sports as a structured, goal-oriented, competitive, contest based, and ludic physical activity.
Today, sports are not only competitive contest or physical activities, but also special and fun experiences of socialization with friends and family. People can be part of sports anytime by participating in sports, watching sports on TV, watching sports in the arena or stadium, listening to sports on radio or reading sport from press, or receiving advertising related to sports. Sports have pervaded all elements of people’s daily lives and sports have dominated leisure activity in the world. According to International Event
2
Group (IEG), worldwide sponsorship spending was estimated to reach $37.9 billion in 2007, with around 70% of sponsorship expenditures directly on sporting event sponsorship (IEG, 2008).
The last decade has seen an increase in the number of sporting events held worldwide (Getz, 1998). According to the NASC Website, more than 270 cities across the country currently have a sports commission or a similar type of entity focused on attracting sporting events (National Association of Sports Commissions, 2005). The growth of college sport over the last several years, combined with increased competition for the sport consumer dollar, has created a need to understand spectator consumption behavior (Shapiro, Ridinger, and Trail, 2013). According to Fulks (2011), National Collegiate Athletic Association (NCAA) Division I Football Bowl Subdivision (FBS) schools, which is the highest level of college football competition in the Unites States, saw a 9.5% increase from 2009 to 2010 in median generated revenue.
In Vietnam, many recent sporting events have failed to attract spectators; therefore, the organizers were struggling to solve financial problems. In the 2012 National Cycling Championships silently took place in the southern province of Binh Duong with almost no spectators standing along local streets to watch the race. As in football, the ongoing economic malaise has scared sponsors away. Similarly, a gloomy atmosphere has been seen at the Golden Racket table tennis tournament concluded weekend at Ho Chi Minh City’s Phan Dinh Phung arena, where most of the spectators are the competitors’ relatives and friends. What were the reasons that sporting events in Vietnam have failed to attract spectators?
In the sport marketing content, the previous studies found the customer perception the service quality, game quality, satisfaction at sporting event has direct influence customer intensions in the next season. In the case in Vietnam, may the reason at the service quality or game quality do not attract spectator? In this current study, researcher
3
would to understanding the reality spectator perception on service quality, game quality, customer satisfaction, and behavior intensions on sporting event in Vietnam.
1.1 Statement of the Problems
The purpose of this study was to investigate the customer satisfaction and behavior intension in 2014 Vietnam University Games through the experiences of the spectators’ perceptions of sporting event about service quality, game quality, customer satisfaction and future intensions. In order to extend our understanding the relationships among those variable this study was conducted. The results could provide some suggestion for the manager for the future strategic decision-making on sporting event in Vietnam.
1.2 Research Sub-problems
Sub-problems were:
(1) to examine the service quality of the sporting events which includes elements related to the facility/area environment experiences, the supporting services, the interaction between spectators and the employees;
(2) to examine the game quality of the sporting events which game related attributes, such as players’ performance, opponent characteristics, game atmosphere;
(3) to investigate the customer satisfaction with the service quality and game quality, which plays an important role to predict spectators’ behavior intensions in sporting events.
1.3 Scope of the Study
The scope of the study consisted of following:
1. The subjects in the study were 600 spectators’ who attendance the final round in 2014 Vietnam University Games.
4
1.4 Assumptions
Followings are assumptions controlled for this study:
1. It was assumed that respondents answered the questions honestly and reflected a view consistent with their experiences.
2. It was assumed that the administrated questionnaires could measure the real response of respondents.
1.5 Limitations
Limitations of the study consisted of the following:
1. The scales for tested variables of this study were all based on experiences of sporting events which depend up the spectator’s perception and subjective judgment of respondent; therefore, data collection were influenced by respondent’s willing to cooperate, value and understanding the questions.
2. The questionnaires may have been some lost meaning in translating the questionnaire from English to Vietnamese.
3. The data collected from spectators of 2014 Vietnam University Games, which means that results are only indicative and cannot be generalized in the context of sporting events.
1.6 Definition of Terms
For the purpose of this study, following the terms was operationally defined: 1. Service quality: service quality as the interaction between font-line employees and service environment (Brady & Cronin, 2001; Cronin & Taylor, 1992; Parasuraman et al., 1985). Service quality is defined in this study as the spectator’s perceptions with the service of frontline employees with ticket seller, ticker takers, ushers, and concession clerks (Yoshida & James, 2010) and service environment with experiences in arena via their five senses: sight, sound, touch, smell and taste (Gobé, 2001; Hultén, Broweus, & Dijk, 2009; Lindstrom, 2005; Schmitt, 1999).
5
2. Games quality: Mason in 1999 identifies a number of aspects believed to be unique to spectator sport products game schedule, league designed home territory, special series of league games such as play-offs, uncertainty of game outcomes, interclub competitiveness, rivalry between clubs, seasonality of league games, and hedonic experiences. Games quality is defined in this study as the spectator’s perceptions with opponent characteristics, player performance, game atmosphere (Yoshida & James, 2010; Theodorakis, Kostas Alexandris, Nikolaos Tsigilis, Serafim Karvounis, 2013) in the relation to the sport competition on the arena.
3. Customer satisfaction: customer satisfaction in the sport content as ‘‘a pleasurable, fulfillment response to the entertainment of the sport competition and/or ancillary services provided during the games (Yoshida & James, 2010). Customer satisfaction is defined in the current study as a spectator’s pleasurable, fulfillment, satisfied with outcome of the game quality and service quality (Theodorakis et. al., 2013).
4. Behavior intension: Behavior intension is defined in this current study as the spectator’s will attend sporting event in the future, willingness to recommend a visit to others and word-of-mouth communications (Brady et al., 2006; Cronin et al., 2000) such as intention to say positive things about the games and its services. Behavioral intentions at sporting events as a customer’s favorable intentions to (1) recommend the team to other customers, (2) attend the team’s future sporting events, and (3) remain loyal to the team (Yoshida & James, 2010).
1.7 Summary
The purposes in this study were to: (1) understand the spectators’ satisfaction with the service quality and game quality, (2) propose a model of the relationship between service quality, game quality, customer satisfaction and behavior intensions and (3) examine the relationships among the proposed constructs. The theoretical background and
6
hypotheses will present in the Chapter 2, including the literature review relationship with service quality, game quality, customer satisfaction and behavior intensions in the content of sporting events.
7
CHAPTER 2
LITERATURE REVIEW
The purpose of this study was to examine the causal relationship between sporting event perceptions of service quality, game quality, game and service satisfaction, customer satisfaction and behavioral intentions in Vietnam University Game. The researcher seeks to understand the experiences of sports spectator’s while attending a sporting event. To carry out this study, it is necessary to complete a critical review of current literature. Four major areas of literature are critically reviewed: a) service quality, b) game quality, c) customer satisfaction, and d) behavioral intentions.
2.1 Service Quality
Service quality, defined as “the difference between what is expected from each of the service dimensions and what a consumer perceives he or she receives from them” (MacKay & Crompton, 1988, p.46), has become a great differentiator of service enterprises (Kandampully, 1998). Service quality has been linked to outcomes such as customer satisfaction (Ko & Pastore, 2004), customer loyalty (Kandampully, 1998; Zeithaml, Parasuraman, & Berry, 1990), value (Laroche, Ueltschy, Shuzo, & Cleveland, 2004), and repurchase intention (Fornell, 1992). In this regard, there are several descriptions of quality dimensions. For instance, Grönroos’ (1984) two-dimensional model is composed of technical quality and functional quality, while Lehtinen and Lehtinen’s (1983, 1991) included process quality and outcome quality. Lehtinen and Lehtinen (1991) also offered a three-dimensional model of physical quality, interactive quality, and corporate quality. Parasuraman, Zeithaml, and Berry’s (1985) SERVQUAL model consisted of five dimensions of tangibles, reliability, responsiveness, assurance, and empathy. Rust and Oliver (1994) introduced a three-dimensional model of service quality encompassing the service product, service delivery, and service environment. Brady and Cronin’s (2001) three-dimensional model of service quality consisted of interaction
8
quality, physical environment quality, and outcome quality. In the context of spectator sports, Croninet al. (2000) found that service quality had both a direct effect on spectators’ behavioral intentions and indirect effects (through satisfaction and service value) on such intentions. More recently, Theodorakis and Alexandris (2013) have provided support for the relationship between service quality and behavioral intentions among spectators of professional soccer by showing that the service dimensions of SERQUAL model including tangibles, reliability, responsiveness, assurance, and empathy. However, services marketing researchers clearly define service quality as the interaction with the service environment and the frontline employees (Brady & Cronin, 2001; Cronin & Taylor, 1992; Parasuraman et al., 1988). Thus, this study focuses on the interaction between service experiences and the frontline employees of service quality.
2.1.1 Service Employees
Milne and McDonald (1999) suggest that a critical challenge for sport marketers is managing the core product and ancillary services. Ancillary services, on the other hand, include factors such as stadium employees, facility layout, accessibility, seating comfort, and information signs which can be influenced through managerial control (Greenwell et al., 2002; Wakefield & Blodgett, 1996; Zhang, J.J., Pease, D.G., Smith, D.W., Lee, J.T., Lam, E.T.C., & Jambor, E.A. 1998). The quality of stadium employees is defined as a customer’s perceptions of the attitudes and behaviors of stadium employees based on the interactions with ticket sellers, ticket takers, ushers, and concession clerks. Assurance refers to employees’ knowledge and their ability to convey trust and confidence. Tangible refers to the physical environment. Empathy refers to employees’ willingness to provide individualized at attention to customers, and responsiveness refers to employees’ willingness to help customers and to provide prompt services. Thus, this study was to
9
evaluation employees of the events such as attitude, knowledge, respond and skill interactions with spectator during the games.
2.1.2 Sensory Experiences
According Lee, Lee, Seo, and Green in 2012, sensory experience is well established in consumer behavior that consumers’ sensory experiences play an important role in their perceptions of the value companies provide. A number of consumer behavior studies have begun to pay close attention to consumers’ experiences via their five senses: sight, sound, touch, smell and taste (Gobé, 2001; Hultén, Broweus, & Dijk, 2009; Lindstrom, 2005; Schmitt, 1999). In this regard, a stadium can be considered a “sensorycape” which provides a memorable experience by appealing to all five senses; spectators can appreciate the visual beauty of a stadium’s architecture and grounds, hear stimulating music at the stadium, feel comfortable seats, experience the stadium’s unique smell, and enjoy the taste of the food available at the concession stands. Experiences have always been at the heart of the entertainment business (Holbrook & Hirschman, 1982), and sporting events are no exception. This conceptualization of the stadium experience differs from most facility research that has focused on cognitive evaluations of customer service, with some attention to sight (e.g., facility aesthetics), seating comfort, and crowding (Lee, Lee, Seo, and Green, 2012).
Many researchers have studied the relationship between service quality and customer satisfaction. Empirical findings showed that service quality is related to customer satisfaction (Babakus, E., C. C. Bienstock, J. R. V. Scotter. 2004). Customers who are satisfied with the perceived service quality will have a favorable emotional response, i.e., customer satisfaction. On the other hand, from the definition of consumer behavior intentions, refer to the research by Theodorakis (2008, 2013) in which a multi-dimensional model of behavior intentions was proposed. It was suggested that favorable
10
behavioral intentions include elements such as saying positive things and recommending the games to others, attendance games in the future while spectator perception in service quality. Thus, in this study examined the influence of service quality on behavioral intentions in spectator sporting events. Accordingly the literature review and previous research, the following two hypotheses are proposed:
Hypothesis 1: The customer’s perceptions of the services quality have a positive impact on customer satisfaction.
Hypothesis 2: The customer’s perceptions of service quality have a positive impact on behavior intensions.
2.2 Game Quality
Game quality (core product quality) in the spectator sport industry includes numerous characteristics. Mason (1999) identifies a number of aspects believed to be unique to spectator sport products: game schedule, league designed home territory, special series of league games such as play-offs, uncertainty of game outcomes, interclub competitiveness, rivalry between clubs, seasonality of league games, and hedonic experiences (i.e., a sense of entertainment and drama).
2.2.1 Core Product
According to Schaaf (1995) was defined the core product at a sporting event refers to the entertainment of competition based on the uncertainty of game outcome, or physical goods or services associated with the excitement of the sporting event, or both. The core product consists of the central product or service (Mullin, Hardy, & Sutton, 2007). In sport, the core product usually consists of the set of items that influence customers’ perceptions of the quality of the game. Specifically, factors such as team performance (Baade & Tiehen, 1990; Branvold, Pan, & Gabert, 1997; DeSchriver, 1999; Pan, Gabert, McGaugh, & Branvold, 1997), quality of opponents (Madrigal, 1995; Marcum & Greenstein, 1985;
11
Zhang, Pease, Smith, Lee, Lam, & Jambor, 1997), rivalry rank (Wall & Myers, 1989) and star players (Schofield, 1983) have each been found to influence attendance.
Abdullah & Rozario (2009), Yoshida & James (2010), and Theodorakis, Koustelios, Robinson, & Barlas, (2009) support this conceptualization and provide the basis for the conclusion that the core product in sports is derived from sport-related factors, such as the quality of the home and opposing teams. Winning percentage of a team, their place in the standings, the team’s history, the number of star players on the team, and the reputation of the team are also important factors that impact on spectator satisfaction. The core product in spectator sports includes game-related components, which are key determinants of whether an element is the core product or ancillary service (Yoshida & James, 2010).
According Morgan and Summers (2005), the core sport product as the competition itself, as this is the main reason people spend money to attend sporting events. Like any product, the sport product is seen as also consisting of three product levels which together all enhance the total product experience. These levels are depicted in Figure 1.
As specified in Figure 1, competition, by its very nature, is completely uncontrollable and unpredictable and it is the key to the passionate and committed following of many sport fans. Spectators can be satisfied with their experience, even if their team does not win, as long as the quality and intensity of competition is of a high standard (Morgan & Summer, 2005). The actual products and the augmented products simply enhance the entire experience, which then affects and impacts spectator satisfaction. Sports marketers can thus use past performances of the team in any marketing communication initiatives to intensify the expectation that fans have of the core product.
12
Figure1. Product Levels for A Sporting Event Source: Morgan & Summers (2005)
A review of the literature suggests that there are two important constructs pertaining to the core product at sporting events: team characteristics (i.e., winning percentage, place in the standings, team history, number of star players on the team, and the quality of the opposing team) and player performance which is captured by players’ on-field performance (i.e., skill, strategy, team effort, and drama; Garvin, 1984; Greenwell, 2001; James & Ross, 2004; Zhang et al., 1997). The special atmosphere in sport stadiums is one of the most important reasons why people attend events (Bauer, Sauer, & Exler, 2005; Holt, 1995; Pfaff, 2002; Wochnowski, 1996). More specifically, atmosphere is associated not only with the ambiance of the stadium, but also with the festive, party-like atmosphere of the game, history of a game, perceived rivalry, attractiveness of team colors and logos, and courteousness of event staff (Kahle, L., Aiken, D., Dalakas, V., & Duncan, M., 2003; Melnick, 1993).
13
In the study of Yoshida and James (2010) used the game quality in a multi-dimension nature in the context of sport spectatorship including core product quality as player performance and opponent characteristics and game atmosphere. However the player performance, opponent characteristics and games atmosphere dimensions failed to predict spectator satisfaction and behavior intension. In 2013, the study of Theodorakis and Alexandris was proposed game quality (i.e. competitiveness, level, spectacular games) and team performance (i.e. plays hard, win/lose record, great results) of outcome dimension, this study failed to examine the game atmosphere of game quality but the results indicated the outcome quality is significant strongly than service quality. In the sporting events context, the game atmosphere is one of the most important reason the spectators’ attendance stadium. Based on the previously research and literature review, thus, in this study was proposed the relationship between game quality, customer satisfaction and behavior intension.
Hypothesis 3: The customer’s perceptions of game quality have a positive impact on customer satisfaction.
Hypothesis 4: The customer’s perceptions of game quality have a positive impact on behavior intensions.
2.3 Customer Satisfaction and Behavior Intensions
Customer satisfaction is treated as fundamental to the marketing concept the notion of satisfying the needs and desire of customers (Spereng, MacKenzie, & Olshavsky, 1996). Oliver (1997) defines customer satisfaction as a product or service feature or the product or service itself, providing a pleasurable level of consumption-related fulfillment. No longer can organizations afford to take their customers for granted as they can simply take their business elsewhere. Sports organizations are not an exception. Cronin and Taylor (1992) views customer satisfaction as the overall feeling customers have toward an organization. Customer satisfaction with a product can create long term benefits for firms
14
including positive word-of-mouth, cross-buying, and customer loyalty (Anderson, Fornell, & Lehmann, 1994; Palmatier, Dant, Grewal, & Evans, 2006). Spectators may be satisfied only when they truly believe that they have received value for their time and money.
A cognitive evaluation and affective elements are used to assess customer satisfaction (Homburg, Koschate, & Hoyer, 2006). Customer satisfaction has been defined as customer’s emotional response to its evaluation of the perceived discrepancy between their prior experience with and expectation (Oliver, 1997; Parasuraman, A., Zeithaml, V. A., & Berr y, L., 1985). It means that the customer’s own experiences of a service where the outcome has been evaluated in terms of what was received in order word what the customer had given to get something. According Jae Ko and Pastore (2007) stress that to be competitive in the very competitive sporting event’s market environment, sports organizations need to increase customer satisfaction by providing consistently high quality services.
In the context of spectator sports, the customer satisfaction that results from attending a game has been shown to be important indicator for developing fan loyalty and increasing team’s revenues (Koo, Y. G., Andrew, D. P. S., & Kim, S., 2008). and customer satisfaction has been viewed as a significant predictor of intentions to attend future sporting events (Cronin, J. J., Brady, M. K., & Hult, G. T. M., 2000; Kwon, Trail, & Anderson; 2005; Wakefield & Blodgett, 1996). Yoshida and James (2010) defined spectators’ satisfaction as ‘‘a pleasurable, fulfillment response to the entertainment of the sport competition and/or ancillary services provided during the game’’. The relationship between service quality and customer satisfaction has been widely studied in the service literature as the research of Theodorakis (2013) findings customer satisfaction was a partially mediate dimension among relationship of service quality and game quality in the context of a professional football game in Greece. Thus, in this study
15
was proposed the relationship among service quality, game quality and customer overall satisfaction.
In the literature of sports marketing, behavioral intentions have been used to examine the consequence of a service performance and are considered the most widely used outcome indicator (Kwon, Trail, and Anderson, 2005; Trail, Anderson, and Fink, 2005; Wakefield & Blodgett, 1996; Yoshida & James, 2010). The relationship among service quality game quality and behavior intension has been reported that positive perceptions about the quality lead to customer satisfaction, which in its turn leads to positive behavior intensions (Theodorakis, 2013).
Behavioral intention is not a single dimensional construct, but a multidimensional construct (Cronin et al., 2000; Yoshida & James, 2010; Zeithaml, Valerie A., Parasuraman, A. & Berry, Leonard L., 1996). Zeithaml et al. (1996) identified five dimensions of behavioral intentions: a) loyalty to company, b) propensity to switch, c) willingness to pay more, d) external response to problem (negative word of mouth), and e) internal response to problem (complaints to employees). According Cronin and his colleagues (2000) focused on the positive aspect of behavioral intentions and developed three indicators of behavioral intentions: repurchase intentions, positive word-of-mouth intentions, and customer loyalty.
The relationship between customer satisfaction and behavioral intentions is well documented by researchers across different service settings (Anderson & Fornell, 1994; Anderson & Sullivan, 1993; Athanassopoulos, Gounaris, & Stathakopoulos, 2001; Bolton & Lemon, 1999) and game setting (Theodorakis, 2013). Based on Zeithaml et al. (1996) conceptualized framework, Cronin et. al. (2000) proposed three determinants of behavioral intentions focusing on positive aspects: a) repurchase intentions, b) positive word of mouth intentions, and c) customer loyalty. With regard to the behavioral intentions, dimensions of repurchase intention and word of mouth are
16
frequently adapted for studies on the sporting events. Consistent with the literature review, we define behavior intensions at sporting events as a customer’s favorable intentions to (1) recommend the team to other customers, (2) attend the team’s future sporting events, and (3) remain loyal to the team. The literature review and previous research clearly defined customer satisfaction at sporting events will affect behavior intension. Thus, this study was proposed:
Hypothesis 5: Customer satisfaction has a positive impact on behavior intentions. 2.4 Summary
The previously research of sporting event such as the motivation, participation, customer satisfaction, behavior intentions, service quality, the experience on sporting event, in Vietnam was limited research regarding the customer satisfaction and behavior intension on sporting events.
In this chapter was presented the relationship among the service quality, game quality, customer satisfaction and behavior intensions in the context of sporting event can be understood that the factor influence the customer satisfaction on sporting events. Therefore, the study aimed to examine the relationship among service quality, game quality, customer satisfaction and behavior intension on 2014 Vietnam University Games. This study is limited research in Vietnam University Games for customer satisfaction and behavior intensions that can be recommendation to development of this field in professional sporting events in Vietnam.
17
CHAPTER 3
METHODOLOGY
This chapter presents the methodology used in the current study. It describes following (1) research procedure, (2) subjects, (3) instrumentation, (4) data collection, (5) data analysis.
3.1 Research Procedure
The procedure used in the current study was based on Churchill’s (1979) recommendations for scale development. The first stage in Churchill’s (1979) procedures is the specification and definition of the construct domain. The second step in the procedure for developing better measures is to generate items. Based on the literature review indicate the variable and dimension has been defined previously. Quantitative research is the focus of this current study. Survey research has been widely used in marketing academics and by practitioners for asking questions to understand, explain, and predict behaviors in the marketplace (Rindfleisch, Malter, Ganesan, & Moorman, 2008).
A survey questionnaire was set to distribute in the final round of Vietnam University Games for data collection. The assumption underlying the survey research method is that all respondents respond to questions honestly. Questionnaires allow more truthful responses by offering a sense of anonymity (Salkind, 2000). Each respondent will be requested to fill out the questionnaire about the experiences with the service quality and games quality, customer behavior and behavior intensions during the games.
In the current study was based on the research of the Yoshida & James (2010) and Theodorakis et. al. (2013), Lee, Lee, Seo, & Green, (2012), in the contexts of professional and collegiate spectator sports, respectively, treated it as a uni-dimensional construct. The questionnaire consisted of Likert scale ranging from “strongly disagree (1)” to strongly agree (7)” that were adapted from previous research studies showing high levels of reliability (α > 0.70).
18
This study intends to understand sporting event spectators’ perceptions of service quality, game quality, customer satisfaction at the event and future behavioral intentions toward the sporting events.
19
3.2 Subjects
The subjects for this study include spectators that who attendance in the national final round of 2014 Vietnam University Games. Participated volunteer in the study were 600 respondents. The 2014 Vietnam University Games during period from October 2013 to May 2014, over 40 team participating from 20 University in National Vietnam.
3.3 Developing Procedure of Instrumentation
The developing procedure of instrumentation was layout in the Figure 3 from the developing instrument total 37-items to measurement included service quality (15-items), game quality (14-items), customer satisfaction (4-items) and behavior intensions (4-items). The next step was to testing the validity of instrument by content analysis, questions translations into Vietnamese version and reliability test of 100 subjects were a spectators of the sporting event.
20
3.3.1 Develop of Instrument
The research conducted an extensive review of literature from service quality, game quality, customer satisfaction, and behavior intension literature to identify initial measurements for the related constructs. The instrument use including measures of service quality, game quality, customer satisfaction, and behavior intensions.
Service quality consisted of two sub-dimensions: stadium employees and sensoycape experience. Sensorycape in sport as noted by Lee, Lee, Seo, and Green (2011) sensorycape include five sensory: sight, sound, touch, smell, and taste. Sensoycape experience was measured with nine-item scale from Lee, Lee, Seo, and Green (2011). Service employees dimension to measure the interaction with the stadium employees, a six-item scale was an adapted from Yoshida & James (2010). This scale was intended to measure three different types of employee quality: employee’s attitude, behavior, and expertise. All service quality items were measured on a seven-point Likert type scale ranging from “strongly disagree (1)” to “strongly agree (7)”.
Player performance and team characteristic was maintained player skill and effort scale excitement was used to assess perceptions of player performance. A five-item scale player performance and four-item scales team characteristic was adopted from Yoshida & James (2010). Game atmosphere was to measure by five-item scale from Yoshida & James (2010). All quality items were measured on a seven-point Likert type scale ranging from “strongly disagree (1)” to strongly agree (7)”.
Customer satisfaction was measured scales two-item scales from Lee, Lee, Seo, and Green (2012); one-item scales from Dean and Fink (2005); and one-item scales from Hightower, R., Brady, M. and Baker, T. L. (2002). These scales expected to understanding the overall satisfaction of the customer on sporting event. Behavior intension was measured scales two-item scales from Hightower et al. (2002); two-item scales from
21
Williams & Soutar (2009). These scales intended to measure the different types of behavioral consequences: intentions to attend future sporting events, positive word-of-mouth intentions, and customer loyalty. Using a 7-point Likert type scale ranging from “very low (1)” to “very high (7),” participants were asked to rate the likelihood of their acting on the suggested behaviors. (Appendix 1)
3.3.2 Validation of Instrument
3.3.2.1 Pilot Study
Pilot study is conducted to detect the weaknesses in the design and instrumentation and to provide proxy data for selection of a probability sample. The following three pilot studies were including:
3.3.2.1.1 Pilot Study #1: Content analysis
To assess the content validity of the items in the survey form, three sport management Professor in Taiwan conducted a content analysis. Each expert received an e-mail from the researcher, which included the purpose of this study and content analysis, explanation of the procedures, construct definitions, and a list of the items.
3.3.2.1.2 Pilot Study #2: Questionnaire Translation
The original context of the instrument used for this study was described in English. The survey instrument was translated in to Vietnamese version to suit the subject’s understanding to questionnaires. According to Leedy (2001), the translation questionnaires not only need to be loyal to the original context of the source instrument but also should reflex a cultural understanding and effeteness of the target language.
This study adopted two translation techniques suggested by Brislin (1980), the use of interpreters and committee approach to create a reliable and valid measurement tool. The researcher was first translated all questions from English into Vietnamese and give
22
them to a lecture of English for correction of any word or sentence that had not reflected the original context of the source instrument. (See appendix 2 & 3)
3.3.2.1.3 Pilot Study #3: Reliability
Before the final form of the survey or questionnaires is conducted, this current study is useful to conduct a pilot study to determine if the items are yielding the kind of information that is needed. The pilot study may be indications that the instrument is unreliable and need revisions.
The pilot study use 37-items to survey randomly selected 100 students of Ton Duc Thang University in Vietnam, who was attended the Vietnam University Games. The results of pilot study were used to adapt and modify the instructions, pictorial frames, and comprehension questions.
The purposes of these pilot studies were to test the adequacy of the instruments, to review the questions, to translate questionnaires from the English version into the Vietnamese version and to establish the validity of the instruments.
3.3.2.2 Results of Reliability Test
A total of 100 students randomly selection was responded to the questionnaire which was evaluated the service quality, game quality, customer satisfaction and behavior intension in 2013 Vietnam University Games. The first, this study was employed items discrimination to assess performance of individual test items on the assumption that the overall quality of a test derives from the quality of its items. The results of items analysis indicated that a total of 37-items was significant at p-value smaller than 0.01. (See Appendix 4)
The second, this study was testing reliability of service quality, game quality, customer satisfaction and behavior intension. The measure of reliability used is Cronbach's Alpha. The results of the Cronbach’s Alpha were presented in the Table 1. All the results of the Cronbach’s Alpha were larger than 0.8 ranking from 0.868 to 0.918.
23
To explain the degree of reliability obtained in this study, the following general guidelines can be used to interpret reliability coefficients recommended by McGraw-Hill (1967).
.90 and above Excellent reliability .80 - .90 Very good
.70 - .80 Good
.60 - .70 Somewhat low
.50 - .60 Suggests need for revision of test
.50 or below Questionable reliability (Psychometric Theory, 1967, p. 196) Thus, the reliability coefficients for this instrument reflected a very good degree of reliability.
Table 1
Reliability of coefficient for the Constructs of Pilot-Study
Constructs Mean SD Cronbach’s Alpha
Service Quality (15 Items) 4.72 .95 .91
Game Quality (14 Items) 5.09 .95 .92
Customer satisfaction (4 Items) 5.19 1.13 .93
Behavior intension (4 Items) 5.27 1.07 .86
3.3 Research Framework
The review of the literature in service quality, game quality in sporting event that constructs of perceived service quality, game quality, customer satisfaction, and behavioral intentions. The relationship among these constructs will be test by this current study. The research framework is shown in Figure 4.
H1: The customer’s perceptions of the services quality have a positive impact on customer satisfaction.
H2: The customer’s perceptions of service quality have a positive impact on behavior intensions.
H3: The customer’s perceptions of game quality have a positive impact on customer satisfaction.
H4: The customer’s perceptions of game quality have a positive impact on behavior intensions.
24
H5: Customer satisfaction has a positive impact on behavior intentions.
Figure 4. The research framework
3.4 Data Collection
After the pilot study, the data collection was set to survey on Tan Binh arena, Vietnam in the final round of the Vietnam University Games. Question was distributed around the arena after the game over during two weekends of the event from 19th to 26th April, 2014. In our study was distributed randomly to spectator who willing respondents the questionnaires. It was collected 600 respondents for this study.
3.5 Data Analysis
All of the return questionnaires would be review, and the research sorted out the invalid questionnaires. The Statistical Package for Social Science (SPSS) 20.0 was used to analysis the descriptive statistic; Exploratory Factor Analysis (EFA); Confirmatory Factor Analysis (CFA); Structural Equation Modeling (SEM) and Cronbach’s Alpha were employed to ensure the construct validity and reliability. Cronbach’s Alpha will test to ensure internal consistency of the scales. At least it should meet the minimum acceptable level of 0.7 or above (Nunnally & Bernstein, 1994).
25
Descriptive statistics will use to analyze subject’s demographic profile including gender, age, marital status, educational level and occupation of the spectator’s Vietnam University Games.
Exploratory Factor Analysis (EFA) is used to determine the number of continuous latent variables that are needed to explain the correlations among a set of observed variables. EFA helps researchers define the construct based on the theoretical framework, which indicates the direction of the measure (DeVon et al. 2007) and identifies the greatest variance in scores with the smallest number of factors (Delaney 2005; Munro 2005). This is statistical approaches used to examine the internal reliability of a measurement.
Structural Equation Modeling (SEM) is a stage to examine if the model can be useful and identify whether the scope of dimension fit or not. SEM encompass an entire family of the model by names, among them covariance, structure analysis, latent variables analysis, confirmatory factor analysis (Hair et al., 2006). It includes one or more linear regression equations that describe how the endogenous constructs depend upon the exogenous constructs. Their coefficients are called path coefficients, or sometimes regression weights (Reisinger & Turnes, 1999).
CFA and SEM will use to analysis by AMOS Statistical package software to testing hypothesis in this study. By convenience, the value of overall fit of a hypothesis model can test to evaluate significant when criteria Chi-square (P value > 0.05), fit indices such as the ratio of Chi-square to degrees of freedom (Chi-square/df 5), goodness of fit index (GFI > 0.9), goodness of fit index (GFI > 0.9), root mean square error of approximation (RMSEA < 0.08) (Hair et al, 2006 an Patrick, 1997).
26
CHAPTER 4
RESULTS
This chapter provided analysis of the collected data and explained the results of the statistical analyses in this study. SPSS was used to initially screen data for statistical assumptions, to estimate Cronbach’s alpha coefficient (α), bivariate correlation and descriptive statistics. Then, AMOS was employed to test all structural models, Confirmatory Factor Analysis (CFA) and Structural Equation Model (SEM). There are three sections included in this chapter. The first section contained the demographic characteristic data of the study sample. The second section provided descriptive statistics of the variable in this main study. Finally, the relationship among the hypothesis model by CFA and SEM was presented.
4.1 Demographic Characteristics
A frequency analysis was run on respondents’ demographic information of spectator in 2014 Vietnam University Games. Demographic characteristics are provided in table 2. A total of six hundred surveys were distributed and there were a total of 536 usable surveys in this study for statistical data analysis. Among the respondent participants, the gender of female was 58.6% (n = 314) which was a higher than rate of male 41.4% (n = 222). In the term of age, the most participants were 18-24 years old with the rate of 99.8%. Almost of respondents in attendance at this sporting event were single or never married (99.8%), those who were divorced or separated only one of the sample size. In the review of participants’ education background, majority respondents were undergraduate 99.4%, only 0.4% of respondents were graduated or above. The occupation of respondents approximately 100% were student, 0.4% were business and others.
27 Table 2
Demographic Characteristics (N = 536)
Demographic Variables Frequency Percentage%
Gender Male 222 41.4 Female 314 58.6 Marital Status Single/Never married 535 99.8 Divorced/Separated 1 0.2 Age 18-24 years old 535 99.8 25-30 years old 1 0.2 Education
High school/technical school 1 0.2
Undergraduate 533 99.4 Graduated or above 2 0.4 Occupation Student 534 99.6 Business 1 0.2 Others 1 0.2 4.2 Frequency of Variable
The results of mean; standard deviation and percentage of frequencies was presented in (Appendix 5) included 37 variables to measurement which the perception of spectators’ service quality dimension, game quality dimension, customer satisfaction dimension and behavior intensions dimensions.
Service quality dimension a score equal 1 disagree to 7 strongly agree. In the service employees, the respondents were most agree with “professional knowledge” of employees (M = 4.89, SD = 1.174). The respondents least agree with “attitude shows understand” (M = 4.66, SD = 1.128). Overall, respondents were evaluated neither agree or disagree ranking from 29.1% to 36% in employees service. For the experiences, the respondent evaluation “scoreboards are entertaining” were the most agree with (M = 5.34,
28
SD = 1.131). The spectators evaluation lowest “food better than outside” (M = 4.28, SD = 1.332). In general, spectators’ somewhere agree with the experiences in the arena.
Game quality dimension was evaluated by spectators’ equal one is disagree to seven is strongly agree. For opponent characteristics the highest agree with “opposing teams have a good history” (M = 4.95, SD = 1.160); player performance most agree with “players try to do their best” (M = 5.44, SD = 1.131) and game atmosphere most agree with “the team understand atmosphere is important to you” (M = 5.29, SD = 1.107). For the lowest evaluation of game quality dimensions as following “opposing teams have star players” (M = 4.47, SD = 1.081), “players on your team have superior skills” (M = 4.96, SD = 1.027) and “the excitement surrounding the performance of the players” (M = 5.11, SD = 1.105). In the overall, the perceptions of spectators’ of game majority was examined somewhere agree to agree, as the items “music exciting” 56.7% spectators strongly agree.
Customer satisfaction and behavior intension dimension was indicated the level satisfaction and behavior intension of spectators’ equal one is very low to seven is very high. For the customer satisfaction after perception the quality of the service and the game, the spectators’ were most satisfied “my experience very satisfied” with (M = 5.06, SD = 1.125). Where in satisfaction dimension “outcome of this game” was lowest satisfied with (M = 4.98, SD = 1.223). For the behavior intension dimension, the spectators highest “would like to visit this sporting event in the future” with (M = 5.18, SD = 1.186) and second was “recommend this sporting event to others” with (M = 5.14, SD = 1.239), finally, the lowest in behavior intension was “I would like to attend this sporting events in future” with (M = 5.07, SD = 1.219). According the presented in the table 3, spectators’ was evaluated somewhat high to high in the satisfaction and behavior intension ranking from 28% to 35%. (See Appendix 5)
Table 3 indicated the mean values, standard deviation and percentage of frequencies were obtained from top 5 highest and top 5 lowest mean values which the
29
evaluation of spectators’ perception the service quality and game quality. According the evaluation of spectators’, the most highest agree in the service was following as (1) “players on your team always try to do their best” (M = 5.44, SD = 1.131); (2) “your team plays hard all the time” (M = 5.39, SD = 1.090); (3) “your team gives 100% effort every game” (M = 5.38, SD = 1.095); (4) “the arena scoreboards are entertaining to watch” (M = 5.34, SD = 1.131); (5) “you like the excitement associated with player performance” (M = 5.3, SD = 1.061). The top five highest items percentage of frequency over 30% the spectators’ at agree level with the service during the game, ranking from 31.2% to 36.2%. Following in the table 4 the results clearly indicated the top five lowest in the performance of the service included (1) “the arena provides better food than outside” (M = 4.28, SD = 1.332); (2) “opposing teams have star players” (M = 4.47, SD = 1.081); (3) “the arena has a quality sound system” (M = 4.62, SD = 1.419); (4) “opposing teams have good win/loss records” (M = 4.66, SD = 1.186); (5) “the attitude of the employees at this arena shows that they understand your needs” (M = 4.66, SD = 1.128). The evaluation of spectators’ majority 26.7% to 40% at neither agree or disagree level in the top five lowest of mean values.
30 Table 3
Mean, Standard Deviation and Percentage of Frequencies of Top 5 highest
Percentage of Frequencies (%) Items Mean Standard Deviation (SD) 1 Strongly Disagree 2 Disagree 3 Somewhat Disagree 4 Neither agree or disagree 5 Somewhat Agree 6 Agree 7 Strongly Agree 1 Players on your team
always try to do their best 5.44 1.131 0.0 0.6 3.5 17.9 27.2 31.2 19.6
2. Your team plays hard all
the time 5.39 1.090 0.0 0.9 2.4 19.0 27.4 34.7 15.4
3. Your team gives 100%
effort every game 5.38 1.095 0.0 0.2 3.5 20.1 26.9 33.0 16.2
4. The arena scoreboards are
entertaining to watch 5.34 1.131 0.0 0.9 4.3 19.8 24.4 36.2 14.4
5. You like the excitement Associated with player performance
5.3 1.061 0.2 0.9 1.1 22.6 29.3 33.6 12.3
31 Table 4
Mean, Standard Deviation and Percentage of Frequencies of Top 5 lowest
Percentage of Frequencies (%) Items Mean Standard Deviation (SD) 1 Strongly Disagree 2 Disagree 3 Somewhat Disagree 4 Neither agree or disagree 5 Somewhat Agree 6 Agree 7 Strongly Agree 1 The arena provides better
food than outside 4.28 1.332 2.4 7.6 13.8 34.5 23.1 13.8 4.5
2. Opposing teams have star
players 4.47 1.081 0.2 4.9 8.2 40.3 30.0 13.6 2.8
3. The arena has a quality
sound system 4.62 1.419 3.2 4.5 11.8 26.7 22.2 25.4 6.3
4. Opposing teams have good
win/loss records 4.66 1.186 0.6 4.5 7.1 34.5 28.0 20.5 4.9
5. The attitude of the employees at this arena shows that they understand your needs
4.66 1.128 0.2 3.7 8.4 33.4 29.5 21.5 3.4
32
4.3 Descriptive Statistics
4.3.1 Reliability test
Reliability refers to the extent to which a scale produces consistent results if repeated measurements are made (Malhotra, Hall, Shaw, & Crisp, 1996). The precise measurement of variables is an important step in the process of research. The reliability of the scales is measured in order to determine if the scales consistently reflect the construct it is measuring. Scale reliability was measured by calculating Cronbach’s alpha (α), the most common measurement for scale reliability. Table 5 showed the reliability estimation for the four constructs. Service quality dimension included fifteen items with a Cronbach’s Alpha of .93. Game quality dimension included fourteen items with a Cronbach’s Alpha of .91. Customer satisfaction dimension included four items (α = .93) and behavior intension included four items (α = .93). Thus, the Cronbach’s Alpha values for all scales were above .80, which is generally the accepted value indicating good reliability of scales (Nunnaly & Bernstein, 1994).
Table 5
Reliability Estimates for the Constructs
Constructs Mean SD Cronbach’s Alpha
Service Quality (15 Items) 4.83 0.86 .93
Game Quality (14 Items) 5.09 0.76 .91
Customer satisfaction (4 Items) 5.03 1.02 .93
Behavior intension (4 Items) 5.12 1.09 .93
Reliability estimates for the constructs between Pilot-test (n = 100) and Post-test (n = 536) was presented in the table 6. The results of Cronbach’s Alpha are the correlation between scores from the same subjects test at two different seasons. The correlation coefficients for the variables ranged from .86 to .93. The closer the two seasons sets of
33
score are to each other and the greater in the Pilot test reliability. That refers to the correlations between two season consistent with the subjects is spectator in the content of college games.
Table 6
Reliability Estimates for Pilot-test and Post-test
Constructs Pilot-test Season 2013 VUG (n = 100) Post-test Season 2014 VUG (n = 536) Cronbach’s Alpha Cronbach’s Alpha
Service Quality (15 Items) .91 .93
Game Quality (14 Items) 92 .91
Customer satisfaction (4 Items) .93 .93
Behavior intension (4 Items) .86 .93
4.3.2 Factor loading analysis
Factor validity is construct validity technique used in assessing the quality of questionnaire and it is obtained by means of factors analysis. The main measures used to test the validity of an instrument in factor analysis include:
Extraction communalities are estimates of the variance in each variable accounted by the components. The communalities values indicate that the extracted components represent the variables well. Thus, small values indicate variables that do not fit well with the factor solution, and should possibly be dropped from the analysis.
aiser-Meyer-Olkin Measure of Sampling Adequacy is a statistic that indicates the proportion of variance in the variables that might be caused by underlying factors. High values (close to 1.0) generally indicate that a factor analysis may be useful with the data. If the value is less than 0.50, the results of the factor analysis probably won't be very useful.
34
matrix, which would indicate that the variables are unrelated and therefore unsuitable for structure detection. Small values (less than 0.05) of the significance level indicate that a factor analysis may be useful with the data.
Base on the original dimension of service quality, game quality, customer satisfaction and behavior intensions, the current study made on effort to examine underlying of four dimension. In this section we discuss the results of the exploratory factor analysis to assess the suitability of the instruments.
According the results analyze of factor loadings, the table 7 indicated the service quality dimension rotated component matrix, it was recognized that were two factor component to be correlated with all variable. The KMO for the service quality dimension of this study was .800. Bartlett's Test of Sphericity test ( The factor loadings of service employees factor (3 items) was ranking from (.864 - .841) with Cronbach’s Alpha of .853. For the experiences factor (3 items) the factor loadings was higher than .7, ranking from (.701 – .859) and the Cronbach’s Alpha at .733. In this dimension, nine items were deleted by the value is less than 0.50, the results of the factor analysis probably won't be very useful.
Table 7
Factor Analysis of the Service Quality Dimension
Factors Items Cronbach’s
Alpha Factor loadings Factor 1 Service Employees .853 The attitude of the employees at this
arena shows you that the understand
.841 You can rely on the arena employees
taking actions to address your needs
.843 The employees at this arena respond
quickly to your needs
.864 Factor 2
Experiences
The arena’s scoreboards are entertaining to watch
35
The arena’s provides good sightlines to watch the game
.701
The smell of the crowd is exciting .859
Kaiser-Meyer-Olkin Measure of Sampling Adequacy .800
Bartlett's Test of Sphericity Approx. Chi-Square 1253.806 df 15 Sig. .000 % of Total Cumulative 71.71
From the table 8 indicated the factor analysis of the game quality dimension. The results showed factor loadings of eleven items were higher than .5 ranking from (.552 – .892), the factor loading of three items were less than .5. The KMO for the game quality dimension was .882. Bartlett's Test of Sphericity test ( After rotated component matrix, that was rotated 3 factor including opponent characteristics, player performance and game atmosphere. In the opponent characteristics factor (3 items) the results of factor loadings ranking from (.552-.892) with Cronbach’s alpha was .786. For the player performance factor (4 items) with the factor loading ranking from (.713-.850) and Cronbach’s alpha was .889. In the third factor of game quality dimension, game atmosphere (4 items) with the factor loadings ranking from (.746-.840), the Cronbach’s alpha also larger than .7 that was .884 of game atmosphere. Table 8
Factor Analysis of the Game Quality Dimension
Factors Items Cronbach’s
Alpha Factor loadings Factor 1 Opponent Characteristics .786
Opposing teams are high quality teams .552
Opposing teams have star players .892
Opposing teams have good win/loss records .870 Factor 2 Player Performance .889 Your team’s players perform
well-executed plays
36
Factors Items Cronbach’s
Alpha
Factor loadings
Your team gives 100% every game .850
Your team plays hard all the time .871
Players on your team always try to do their best .839 Factor 3 Game atmosphere .884 At this stadium, you can rely on there
being a good atmosphere.
.811 This stadium’s ambiance is what you
want at a game.
.840 The (team name) understand that
atmosphere is important to you.
.820 You enjoy the excitement surrounding the
performance of the players
.746 Kaiser-Meyer-Olkin Measure of Sampling Adequacy
.882 Bartlett's Test of Sphericity Approx. Chi-Square 3482.801 df 55 Sig. .000 % of Total Cumulative 74.84
The results showed in table 9 & table 10 present the detail the factor loadings of customer satisfaction dimension and behavior intension dimension. In the customer satisfactions dimension the results factor loading of all items higher than .8, it ranges from .918-.903. “I am very satisfied” (.895), “I am satisfied with my decision” (.903), “I am satisfied with the outcome” (.849), “I truly enjoy to going this event” (.818) and the Cronbach’s alpha was .889, “I would go on in the future” (.920). The KMO for the customer satisfaction dimension was .813. Bartlett's Test of Sphericity test (
For the behavior intension dimension, Cronbach’s alpha was highest with .932 and the factor loadings ranking from .904-.920. “I intend to visit this sporting event in the future” (.904), “I would say positive things” (.916), “I would go on in the future” (.920),
37
“I would recommend to other people” (.908). The KMO for the behavior intensions dimension was .855. Bartlett's Test of Sphericity test (
Table 9
Factor Analysis of Customer Satisfaction Dimension
Factors Items Cronbach’s
Alpha Factor loadings Customer Satisfaction .889 Based on all my experience in this arena,
I am very satisfied
.895 I am satisfied with my decision to attend
this games
.903 I am satisfied with the outcome of this
game
.849 I truly enjoy going to this sporting event .818
Kaiser-Meyer-Olkin Measure of Sampling Adequacy .813
Bartlett's Test of Sphericity Approx. Chi-Square 1279.188 df 6 Sig. .000 % of Total Cumulative 75.18 Table 10
Factor Analysis of Behavior Intensions Dimension
Factors Items Cronbach’s
Alpha
Factor loadings Behavior
Intensions
I intend to visit this sporting event in the future
.932
.904 I would say positive things about going
to this sporting event to others .916
I would go on sporting events in future .920 I would recommend going to this
sporting event to other people .908
Kaiser-Meyer-Olkin Measure of Sampling Adequacy .855
Bartlett's Test of Sphericity Approx. Chi-Square 1767.142 df 6 Sig. .000 % of Total Cumulative 83.16