國 立 交 通 大 學
經營管理研究所
博 士 論 文
No. 147
不同科技接受模型的實證研究:數位產品與服務
Alternatives of empirical studies of TAM: Digital
products and services
研 究 生:湯凱喻
指導教授:楊 千 教授
不同科技接受模型的實證研究:數位產品與服務
Alternatives of empirical studies of TAM: Digital
products and services
研 究 生:湯凱喻
Student:
Kai-Yu
Tang
指導教授:楊 千 教授 Advisor: Prof. Chyan Yang
國 立 交 通 大 學
經 營 管 理 研 究 所
博 士 論 文
A Dissertation
Submitted to the Institute of Business and Management College of Management
National Chiao Tung University in Partial Fulfillment of the Requirements
for the Degree of Doctor of Philosophy
in
Business and Management June, 2012
Taipei, Taiwan, Republic of China
不同科技接受模型的實證研究:數位產品與服務
研究生:湯凱喻
指導教授:楊 千 教授
國立交通大學經營管理研究所博士班
摘
要
資訊科技的快速發展改變了產品和服務的本質,也提供了使用者實用的數位產品與服 務。主流的資訊管理學術研究也依循著管理實務上的需求,長期圍繞在討論使用者的科技 接受及資訊科技的使用。和主要的資管議題一致,本研究也嘗試以最成熟的資管理論之一 「科技接受模型」來探索影響使用者對於數位產品與服務的科技接受前因,以及影響其滿 意度與購買行為的前因。為此,本研究進行了兩個調查研究,分別是電子教科書的科技接 受及智慧型手機應用軟體的使用滿意度與購買意願。 第一個研究旨在提出一個延伸型的科技接受模型並以之驗證使用者對於電子教科書的 科技接受意願。根據實證結果顯示,相較於原始的科技接受模式,我們所提出的一個結合 知覺享受構念的模型對於電子教科書的科技接受意願有較佳的解釋能力。實證結果也提供 了一個可能的方向來提高消費者對於電子教科書的採用意願,那就是提高消費者對於電子 教科書的正面態度。 第二個研究整合了科技接受模式及資訊系統繼續使用中的「期望-確認理論」,來探 索影響智慧型手機應用軟體的使用滿意度和購買意願的前因。研究發現包括:第一、三種影響智慧型手機應用軟體的使用滿意度前因,包括知覺有用性、知覺享受及社會印象等三 構念的假說皆得到支持。第二、知覺有用性及社會印象構念有效地解釋了智慧型手機應用 軟體的購買意願。以上兩點研究發現提供了一個證據,那就是相較於智慧型手機應用軟體 其他的實用功能,終端使用者更關心的是使用智慧型手機應用軟體是否可以改善他們的自 我認知及別人對於他們的印象。針對以上兩個調查研究結果的討論及管理意涵也在本論文 中提供。 關鍵詞: 電子教科書、智慧型手機應用軟體、科技接受模式、期望確認理論、知覺享受、 滿意度、社會印象、購買意願
Alternatives of empirical studies of TAM: Digital
products and services
Student:
Kai-Yu
Tang
Advisor:
Prof.
Chyan
Yang
Institute of Business and Management
National Chiao Tung University
ABSTRACT
Rapid developments in information system (IS) have changed the nature of products and services, and proving a useful accessibility to consumers. In line with the technological changes above, major research streams in IS discipline have continued interests in understanding individual acceptance and their IT usage. Aligned with the emerging interests, the current study attempts to investigate the antecedents of user’s technology acceptance and their satisfaction towards digital products and services on the basis of the sound theory - Technology Acceptance Model (TAM). Therefore, two studies are created for this purpose, including user’s adoption towards e-textbook as well as satisfaction and purchase intention in the use of App, respectively.
The first study aims to propose and verify an extended TAM to understand the antecedents of user’s adoption in the use of e-textbook. Based on the empirical findings, we concluded that our proposed model incorporated with perceived enjoyment is more suitable to predict user’s adoption of e-textbooks than the original model, indicating a way to enhance customer’s positive attitude towards e-textbook.
The second study integrated the TAM and Expectation-Confirmation Theory (ECT) for IS continuance to explore antecedents of satisfaction and purchase intention towards App usage.
Findings included: (1) All three antecedents of App satisfaction, perceived usefulness, enjoyment, and social image, were confirmed. (2) Perceived usefulness and social image successfully predicted the purchase intention of App. The findings demonstrated a fact that end-users much concerned with whether the use of App can improve their self-concept and images among others than with other utility concern. Further discussions from the two surveys are provided.
Keywords: E-textbook, App, Technology acceptance model, Expectation-confirmation theory, Enjoyment, Satisfaction, Social image, Purchase intention
致謝
還不會看SSCI的時候,最常翻的論文就是別人的學位論文,最先看的章節就是致謝。雖然每 一本都是大同小異,但每一本都可以看出背後的努力與付出。現在自己在寫著這段致謝的同時,心 中果然也是五味雜陳。不大會說話的我希望能透過這段致謝,對身旁周遭的貴人們深深的一鞠躬, 也致上最高的敬意與謝意。 首先,必須要深深的感謝指導教授楊千老師。少了老師的照顧,沒辦法走到這;少了老師的 幫忙,這篇博士論文也無法順利完成。修業期間能夠獲得扶輪獎學金,畢業之初的博士後研究,老 師的推薦至關重要。能夠成為老師的門生真是太好了。另外,對於指導委員會丁承老師、胡均立老 師許多的建議,凱喻也是相當感謝。課程中,丁金輝老師在實務方面的啟發,Rosa在英文寫作上的 提點,在此也一併致謝。經管所的老師們,謝謝您們。 良師益友。若少了前後期的各位,研究的路上肯定寂寞不少。在此,凱喻也要向各位表達由 衷的感謝。特別是大學長與大學姐們的幫助。修業前後,生病期間都受到許多貼心的幫忙與照顧的 耿杰學長,真是讓我及家人都非常感動,學長謝謝您。所上的助理姐姐們,研究室的各位,太感動 了,您們的陪伴讓凱喻渡過了艱難的一關。還有憲明,低潮時候對於事務的交接真是麻煩你了,住 院期間讓你和貴夫人為我奔波,凱喻感謝了。可愛的學妹們,君華、薰瑤還有娟娟,各位對於調查 研究的支持,凱喻不會忘記的。特別是小老闆在關鍵時刻的出手,這本論文只有這裡可以記上這一 筆。以上各位對凱喻的不嫌棄,凱喻只有擇日再報。各位,真是謝謝了。 先後定居天國的奶奶和爺爺,終於可以在這裡跟您們告捷了。親愛的大家族們,能和你們結 緣真是我的福氣。そして、いつもお世話になりましたタケさんへ、本当にありがとうございまし た。今後ともどうぞ、よろしくお願いいたします。最後也最重要的,我的母親,黃淑美,對我不 求回報的愛,這本論文是獻給您的。 以上 湯凱喻 謹誌於 2012盛夏 交大台北校區TABLE OF CONTENTS
摘 要... i
ABSTRACT ... iii
TABLE OF CONTENTS ... vi
List of Tables... vii
List of Figures... viii
Chapter 1. Research background ... 1
Chapter 2. Understanding the antecedents of e-textbook adoption among college students ... 4
2.1. Introduction ... 4
2.2. The technology acceptance model (TAM) ... 7
2.3. Enjoyment and technology acceptance... 10
2.4. Research methodology ... 12
2.4.1 Participants and procedure ... 12
2.4.2 Measurement... 14
2.4.3 Measurement assessment... 15
2.5. Results ... 19
2.5.1 Common method variance... 19
2.5.2 Hypotheses testing ... 20
2.5.3 Comparing extended TAM with the original TAM... 22
Chapter 3. Why do people use App? Exploring the antecedents of satisfaction from usefulness, enjoyment and social image ... 23
3.1. Introduction ... 23
3.2. Theoretical background ... 25
3.2.1 App satisfaction and purchase intention... 26
3.2.2 Utilitarian influence ... 28
3.2.3 Hedonic influence... 30
3.2.4 Social influence ... 31
3.3. Research methodology ... 33
3.3.1 Participants and procedure ... 33
3.3.2 Measurement... 35
3.3.3 Measurement assessment... 36
3.4. Empirical results... 38
3.4.1 Common method variance... 38
3.4.2 Results of structure model ... 39
Chapter 4. Managerial implications... 42
4.1. Implications from the first study ... 42
4.2. Implications from the second study... 44
Reference... 47
APPENDIX A - Measure of constructs in the use of e-textbook... 54
List of Tables
Table 2.1 The wholesale of electronic book sales in the U.S. ... 5
Table 2.2 Characteristics of the sample (N=312) ... 14
Table 2.3 Reliability and variance explained... 16
Table 2.4 Chi-square difference tests... 18
Table 2.5 Means, standard deviations, and correlations ... 18
Table 2.6 Goodness-of-fit indices for the comparison of models... 20
Table 2.7 Path coefficients and t-values ... 21
Table 3.1 Characteristics of the sample (N=341) ... 35
Table 3.2 Descriptive statistics, reliability, variance explained, and correlations. ... 37
Table 3.3 Chi-square difference tests... 38
List of Figures
Figure 2.1 The technology acceptance model (TAM) ... 8
Figure 2.2 Proposed model... 12
Figure 2.3 Results of final model with standardized coefficients ... 22
Figure 3.1 Research framework... 25
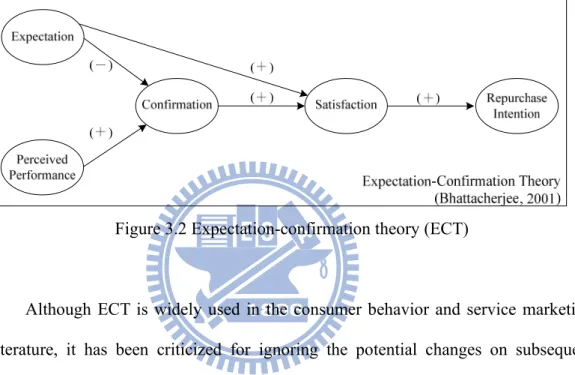
Figure 3.2 Expectation-confirmation theory (ECT) ... 27
Chapter 1. Research background
Developments in computer technology have changed the nature of digital contents and its accessibility to consumers. In the early stages, information systems (IS) were designed to improve task performance and efficiency. For instance, those job-related information systems can be categorized as automation software (e.g., spreadsheet, text-editor), office systems (e.g., word processor, spreadsheet, database programs), system developments (e.g., programming tools, software maintenance tools), and communication systems (e.g., e-mail, voice mail, mobile phone, face-to-face meeting) (Legris, Ingham and Collerette, 2003).
The advantages of technology development allow people to conduct their business, enjoy entertainments ubiquitously, and update the latest information at any time. For example, electronic journals and databases have changed the way of information-seeking on academics, scientists, and researchers, successfully proving themselves as essential resources for libraries and readers (Nicholas et al., 2010). Specifically, an e-book is defined as “any piece of electronic text regardless of size or composition (a digital object), but excluding journal publications, made available electronically (or optically) for any device (handheld or desk-bound) that includes a screen” (Armstrong et al., 2002). Morineau et al. (2005) proposed similar concept that it refers a new means of presenting text, allowing downloading of documents and multiple readings on a portable computer.
Likewise, an electronic textbook (e-textbook) can be regarded as any piece of textbook which is available electronically for either handheld or desk-bound device
with a screen. E-textbooks are produced in various formats, mostly in PDF format. However, it should be pointed out the differences between e-textbooks and e-books in the content and goals. E-textbooks are often well structured for the purpose of learning and retention, containing more unfamiliar information. On the other hand, e-books have a narrative structure, being read for pleasure (Daniel and Willingham, 2012).
A great deal of new end-user digital services on smart phone, such as mobile games and mobile social networking services, have been developed, distributed, and adopted. Moreover, service provider shave focused on these digitalized contents and applications to foster company’s revenue. Mobile applications, also called mobile App(s) or App, are therefore happened to be an important issue for the use of smart phones and other mobile devices. Accompanying with characteristics such as exact localization, imaging, and augmented reality, App is usually designed to run on smart phones (Weiss, 2010). App services are available from various information and communications technology (ICT) providers, including Apple App Store, BlackBerry App World, and Google Play-formerly Android Market. Since 2009, the great demands for App users were dramatically shaped and developed. However, it should be noted that the investments in information systems for today’s organizations have expanded dramatically, explaining over 50% of new capital investment (Venkatesh, et al., 2003). In addition, about 74% of IS and software engineering projects are delayed, exceed budget, and fail to meet the functional expectations, despite the considerable investments in IS (Schepers and Wetzels, 2007).
In order to deal with the above management problems in reality, one of the most mature research streams in IS discipline is to understand individual acceptance and
their IT usage. Following the main research interests, the current study attempts to investigate the antecedents of user’s technology acceptance and their satisfaction towards digital products and services on the basis of the TAM. Among numerous theories, the TAM was considered to be the most influential and valid model for describing an individual’s acceptance of information systems and identifying influential factors on technology acceptance across different settings have been an important and focal interest in IS for both researchers and practitioners (Davis, 1989; Davis, Bagozzi and Warshaw, 1989). Two studies including user’s adoption towards e-textbook as well as satisfaction and purchase intention in the use of App, respectively, are therefore created for this research.
The first study is one of the few attempts to investigate students’ acceptance of electronic textbooks. The TAM was served for the purpose of the current study. In addition, from the motivational perspective, an intrinsic motivation such as perceived enjoyment was suggested to incorporate into the TAM. Specifically, the current study has the following objectives: (1) to propose and verify a modified TAM specific to the usage of e-textbooks; (2) to identify antecedents of E-textbook adoption among college students.
Despite of the substantial amounts downloaded of App globally, factors influencing consumers’ satisfaction toward the use of App are still unknown. The second investigation is dedicated on the study of App by integrating and extending the TAM and expectation-confirmation theory (ECT) for IS continuance to answer: (1) what is the adequate model specific to App? (2) what are the factors determining consumers’ satisfaction and purchase intention of App?
Chapter 2. Understanding the antecedents of e-textbook adoption
among college students
To understand user’s adoption intention towards digital products, a study of an extended technology acceptance model (TAM) along with the context of e-textbook is demonstrated in this chapter. First, e-textbook, represented as a digital product, is first introduced. Theoretical background towards TAM as well as perceived enjoyment is elaborated in the next section. In section 2.3, research methodology is presented. The empirical results are summarized in section 2.4.
2.1. Introduction
Developments in computer technology have changed the nature of digital content and its accessibility to consumers. Electronic journals and databases have changed the way of information-seeking on academics, scientists, and researchers, successfully proving themselves as essential resources for libraries and readers (Nicholas et al., 2010). In this sense, book publishers have expectation on the new opportunities of digital form of book contents, such as electronic books (e-books) for substantial profits.
E-books have the following distinct features that should make themselves attractive to the consumers: (1) E-books are friendly to our environments, eliminating the need to cut down trees for paper and to transport them. (2) The ability for readers
to customize the type size and font displayed in electronic devices. (3) E-book contents can be purchased and downloaded within minutes. (4) E-books allow keyword searches. (5) E-books allow users to highlight, annotate, underline and bookmark. (6) E-books only take up space digitally. For college students, they do not need to carry cumbersome, printed textbooks. (7) Most importantly for students, the cost of e-textbook is cheater than print version, even cheater than second hand one.
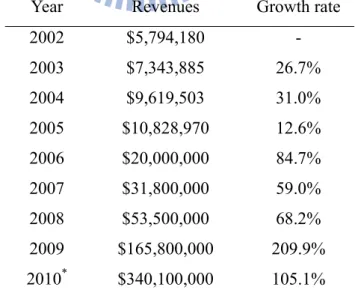
E-book’s industry has also grown remarkably during the last two decades. Just (2007) found that there was an average 20 percent annual rate of growth in the global e-book market. In States, the annual average growth rate was 74.7 percent from $6 million USD in 2002 to $340 million USD in 2010 (IDPF, 2012). The growth rate hit 210% in 2009, and 105% in 2010. Similar prosperity was found in Taiwan, about 74.3 percent growth from 2009 to 2010 (IDB, 2012), indicating a considerable opportunity from the demand side. More detailed items and figures are listed in Table 2.1.
Table 2.1 The wholesale of electronic book sales in the U.S.
Year Revenues Growth rate
2002 $5,794,180 - 2003 $7,343,885 26.7% 2004 $9,619,503 31.0% 2005 $10,828,970 12.6% 2006 $20,000,000 84.7% 2007 $31,800,000 59.0% 2008 $53,500,000 68.2% 2009 $165,800,000 209.9% 2010* $340,100,000 105.1%
* The original revenue number in IPDF digital book is presented as quarterly data, and the yearly revenue reported in 2010 is calculated until October 2010.
In Taiwan, only few book publishers provide few versions of e-textbooks for college students. Some factors might threaten the growth of e-books in academic environment. First, security technology has not kept pace with platform technology to avoid the risk of books being hacked and changed. Most distributors do not allow e-book downloading to print, nor do they allow multiple downloads. Certain kind of acts is employed to prevent from unauthorized downloading. For example, in Taiwan, the existing period of e-textbooks is 180 days after purchasing online. Second, the emergency of e-textbooks challenges the reading habits of most people, because it is difficult to read from a screen (Morineau et al., 2005). Many consumers claimed that reading on computer screen is never a pleasant experience, especially with long texts from a screen. For most college students, physical books on their shelf are more convenient to refer. Besides, it is difficult to lend textbooks among classmates if they are not in print version. Print will always play a part in research, even though science and technology books go online. However, for a younger generation, who grew up with all kind of games and digital texts (e.g., email, chat room) on their computers, electronic reading may become their preferred format.
Despite of the above technological hindrances for the development of e-textbooks, e-textbooks still provide a new channel for students to learn and a new business opportunity for marketers (Landoni et al., 2001). Further technological and internet developments will have tremendous impact on e-textbooks market. For example, the improvement in e-book reader technologies (e.g., PDA, Kindle, iPad) increasingly brings e-books to the attention of information users (Pinkwart et al., 2003).
electronic textbooks. The technology acceptance model (TAM) was served for the purpose of the current study. In addition, from the motivational perspective, an intrinsic motivation such as perceived enjoyment was suggested to incorporate into the TAM (Hsiao and Yang, 2010; Van der Heijden, 2004). Therefore, the current study has the following objectives:
1. To propose and verify a modified technology acceptance model (TAM) specific to the usage of e-textbooks;
2. To identify antecedents of E-textbook adoption among college students.
2.2. The technology acceptance model (TAM)
Since the mid-eighties, IS researchers have concentrated their efforts in developing and testing models that could help to predict system use. Among which, TAM has been widely recognized as a robust, powerful, and economical model for predicting the acceptance of information technology.
TAM, an adaptation of the theory of reasoned action1 (TRA) which assumed that human behavioral intention is affected by attitudes and subjective norm (Fishbein and Ajzen, 1975), has received empirical support in information technology research. Although the TAM is considered as a special case of the TRA, the model excludes the influence of social factors (e.g., subjective norms).
1 TRA, introduced by Fishbein and Ajzen (1975), is considered to be the most integrated models from social psychology. Established by attitude-behavior theories, TRA are widely used in explaining and predicting human behavior across a variety of disciplines, such as social psychology, knowledge management, medical studies, and IT adoption. The core of TRA is the beliefs-attitudes-behavior logic, in which knowledge or beliefs lead to general attitudes that in turn lead to intentions and behavior (Shaw and Clarke, 1999; Shaw and Shiu, 2002, 2003; Vitell et al., 2001). According to TRA, therefore, behavioral intention, an immediate predictor of behavior, is a function of attitude and subjective norm.
TAM posited the usage behavior as a direct function of behavioral intention (BI), which in turn, is determined by two salient beliefs: perceived usefulness (PU) and perceived ease of use (PE) (Davis, 1989). In the TAM, intentions are determined by attitude towards usage as well as by the direct and indirect effects of PE and PU (see Figure 2.1). While PE is defined as “the degree to which a person believes that using a particular system would enhance his or her job performance,” PU is defined as “the degree to which using the technology will be free of effort.” The mediating roles of PU and EU are examined in the relationship between external variables (e.g., system characteristics, development processes and training) and the intention of system usage. Both PU and PE influence the individual’s attitudes (AT) towards using an information system, which reflecting the feelings of favorableness or unfavorableness towards using the technology. AT and PU, in turn, predict the individual’s behavioral intention to use it. According to the TAM, the easier a technology is to use, the more useful it is perceived to be, and the more positive are one’s attitudes and intentions towards using the technology.
Figure 2.1 The technology acceptance model (TAM)
It should be noted that a complete assessment of the model by including actual measures of usage is important to fully understand usage behavior (Davis et al., 1989).
However, it needs to collect data over time to test actual behavior. Substantively, the formation of an intention to carry out a behavior is thought to be a necessary precursor to behavior (Fishbein and Ajzen, 1975). Therefore, the current study did not include actual usage.
TAM has been widely used and validated in the IT/IS research. Recent researchers have continued interests in understanding users’ acceptance of trendy technology and related applications by incorporating other theoretical underpinnings with TAM. For instance, Lee (2006) investigated factors influencing the adoption of an e-learning system through an extended TAM. In another study, Lai and Chang (2011) proposed a TAM-based causal model to examine user attitudes toward dedicated e-book readers for reading. Shin (2010) launched a cross-national study to predict users’ acceptance of online social networking services by using the TAM factors, extrinsic and intrinsic motivations. Liao et al. (2011) conducted a survey to explore the factors influencing the intended use of web portals based on the original TAM.
Numerous empirical studies have found that the TAM consistently explains a substantial proportion of the variance (typically about 40%) in usage intentions and behavior (Venkatesh, 1999). From this stream of research, the TAM emerges as a powerful and parsimonious model in elucidating user acceptance of a technology and is well adapted in the mainstreams of task-related systems, e-commerce systems, and hedonic systems (Hsiao and Yang, 2011). Additionally, Chau and Hu (2001, 2002) proposed that the TAM is superior to the TPB2 in explaining the behavioral intention
2 Different from TRA, TPB added a new construct, perceived behavioral control, which refers to an individual’s control beliefs and is suggested to impact both behavioral intentions and behavior.
of professional workers.
Since an e-textbook is a new means of presenting text through electronic devices (e.g., portable computers), we then hypothesized that paths predicted by TAM can also apply to the context of e-textbooks. Besides, e-textbooks have rarely been published in Taiwan, and very limited students have accessed to them. The intention-behavior relationship was then omitted. The present study verifies those relationships of TAM in e-textbook context with the following hypotheses:
Hypothesis 1: A consumer’s PE of e-textbooks affects his/her PU of e-textbooks. Hypothesis 2: A consumer’s PE of e-textbooks affects his/her AT of e-textbooks. Hypothesis 3: A consumer’s PU of e-textbooks affects his/her AT of e-textbooks. Hypothesis 4: A consumer’s PU of e-textbooks affects his/her BI of e-textbooks. Hypothesis 5: A consumer’s AT of e-textbooks affects his/her BI of e-textbooks.
2.3. Enjoyment and technology acceptance
Recently, a critical review work performed by Legris et al. (2003) suggested that TAM explains only 40% of system use. This revealed that other significant factors affecting PU, PE, and user intention of new technology existed. Previous consumer behavior literature has demonstrated the determinants of consumers’ intention depending on the utilitarian or hedonic nature of the product (Babin et al., 1994; Holt, 1995). The objective of a utilitarian information system is to increase the user’s task performance and encourage efficiency at the same time. Therefore, the dominant design objective is captured by the perceived usefulness construct which is regarded
as extrinsic factor (Venkatesh and Davis, 2000).
In contrast, the value of a hedonic system is a function of the degree to which the user experiences fun when using the system since the term “hedonism” relates to pleasure or happiness in life. “Perceived enjoyment” (EY), one dimension of consumers’ emotional and hedonic perceptions, defined as the extent to which the activity of using the system is perceived to be enjoyable in its own right, apart from any performance consequences that may be anticipated. Davis et al. (1992) introduced the concept of perceived enjoyment to TAM model as the role of intrinsic motivation. Since motives are essential to consumers’ experiential behavior for receiving entertainment (Hoffman and Novak, 1996), perceived enjoyment stands out as an important motive to demonstrate how it affects the individual’s acceptance of e-textbook.
Based on the definition of perceived enjoyment, several recent studies reported that playfulness plays a crucial role in explaining consumer adoption of new technology applications such as 3G mobile services (Liao et al., 2007), online games (Lee, 2009), and websites (Van der Heijden, 2004). In their studies, perceived enjoyment was verified to be a significant intrinsic motivation in determining consumers’ attitudes and behavioral intention towards information system.
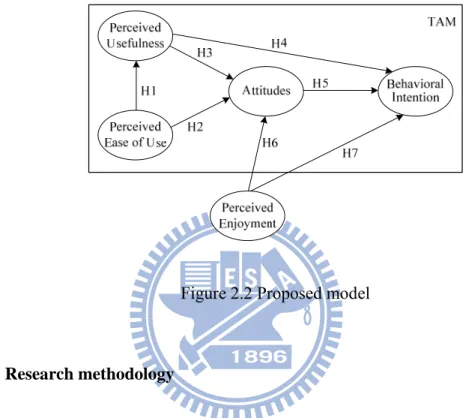
According to the above studies, perceived enjoyment stands out as an important motive for new technology usage. Since e-textbook is novel for college students, while taking into account of an entertainment characteristic and intrinsic attribute of e-textbooks, this research then included perceived enjoyment to the TAM model. Consequently, hypotheses 6 and 7 were added to verify the effect of perceived enjoyment. The research framework also depicted in Figure 2.2.
Hypothesis 6: A consumer’s EY of e-textbooks affects his/her AT of e-textbooks. Hypothesis 7: A consumer’s EY of e-textbooks affects his/her BI of e-textbooks.
Figure 2.2 Proposed model
2.4. Research methodology
Following literature review, research method is presented. For the purpose of this study, participants and procedure are first introduced. Next, descriptive statistics of the sample used in this study are presented. Other related issues in this section are measurement and instrument assessment. Finally, a confirmatory factor analysis (CFA) was performed to validate the critical factors of perceived usefulness, ease of use, enjoyment, and attitude as well as behavioral intention towards e-textbooks.
2.4.1 Participants and procedure
northern Taiwan. The survey was administered during regular class time under the permission of students. Extra credits were offered to increase the seriousness of subjects’ participation. A trained instructor explained the purpose of the current study, provided the assurance of confidentiality and anonymity, and then gave a copy of questionnaire to each student. After finishing all these tasks, respondents were thanked and dismissed.
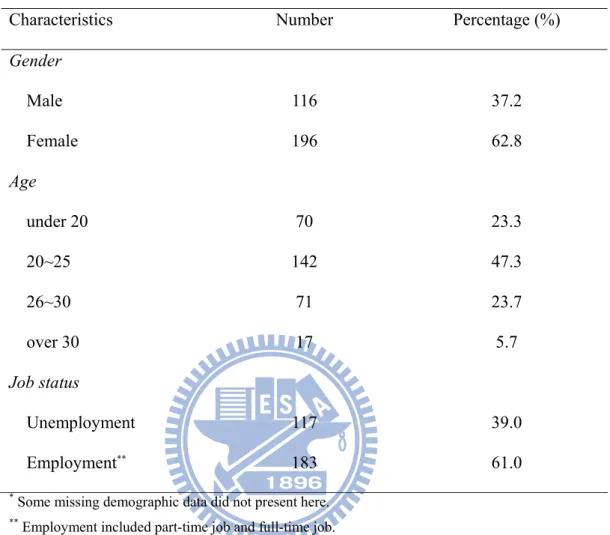
As a result shown in table 2.2, 312 complete questionnaires were collected, resulting in an effective response rate of 93.4%. Male and female students made up 37% and 63% of the sample, respectively. Most participants were under age 30, 47% of which between age 20 to 25.
Table 2.2 Characteristics of the sample (N=312)*
Characteristics Number Percentage (%)
Gender Male 116 37.2 Female 196 62.8 Age under 20 70 23.3 20~25 142 47.3 26~30 71 23.7 over 30 17 5.7 Job status Unemployment 117 39.0 Employment** 183 61.0
* Some missing demographic data did not present here. ** Employment included part-time job and full-time job.
2.4.2 Measurement
Research items used to measure the constructs of interest were drawn and modified from existing validated scales using a five-point Likert-type scale, with anchors from “strongly disagree” to “strongly agree”. One advantage of using TAM is that they are well-validated measurement. All items were measured with a Likert-type scale ranging from 1 (strongly disagree) to 5 (strongly agree). Backward translation (with items translated from English into Chinese, and back into English) was employed. The discrepancies of versions were also compared and resolved to ensure
consistency between the Chinese and the original English editions of the instrument (Singh, 1995).
The measures of behavioral intention (BI) and attitudes (AT) were adapted from Ajzen (1991). BI measured individuals’ likelihood to use e-textbook. AT referred to individual’s likeness or dislikeness toward using e-textbook. Items of PE was adapted from Davis (1989), which measuring the degree to which a person believes that using e-textbook would be free of effort. Similarity, the instrument for PU was also adapted from Davis (1989), measuring the degree to which a person believes that using e-textbook would enhance his or her job performance at school. Adapted from Nysveen et al. (2005), the measurements of perceived enjoyment were defined as the extent to which individual feels enjoyable toward using e-textbook. All of the items and their sources are listed in the Appendix-A.
2.4.3 Measurement assessment
A two-step approach structural equation modeling (SEM) procedure was used to the measurement assessment section (Anderson and Gerbing, 1988). First, confirmatory factor analysis (CFA) using LISREL 8.51 was conducted to evaluate the reliability and validity of the measures. The structural model was then conducted for hypotheses testing.
The results of CFA on all items showed a satisfactory fit with chi square (χ2) of 197.87 (df =80, p<0.001) and other fit indices, including GFI = 0.92, CFI = 0.95, IFI = 0.98, NNFI = 0.98, RMR = 0.048, RMSEA = 0.069. In addition, internal consistency measures how consistently individuals respond to the items within a scale.
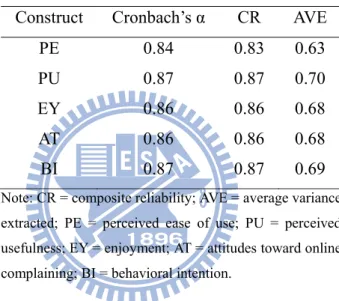
Indices of Cronbach’s alpha (α) and composite reliability (CR) were used to determine the internal consistency reliability of each of the composite constructs. The results for the all constructs were reported in Table 2.3: (1) α ranged from 0.84 to 0.87; (2) CR ranged from 0.83 to 0.87, providing the evidences for the existence of reliability (Nunnally, 1978).
Table 2.3 Reliability and variance explained
Construct Cronbach’s α CR AVE
PE 0.84 0.83 0.63
PU 0.87 0.87 0.70
EY 0.86 0.86 0.68
AT 0.86 0.86 0.68
BI 0.87 0.87 0.69
Note: CR = composite reliability; AVE = average variance extracted; PE = perceived ease of use; PU = perceived usefulness; EY = enjoyment; AT = attitudes toward online complaining; BI = behavioral intention.
Convergent validity is determined by how closely related the two measures are with the same construct (Viswanathan, 2005). It is achieved if different indicators used to measure the same construct obtain strongly correlated scores, via two methods. First, all factor loadings for items contained in the same construct were statistically significant, revealing that all the items effectively measure their corresponding construct (Anderson and Gerbing, 1988). Second, CR and AVE for each construct exceeded 0.5, suggesting that items capture more variance in the underlying construct than measurement error doses (Fornell and Larcker, 1981). In this study, all factor loadings for items were statistically significant with t-value
ranging from 14.74 to 19.09. Moreover, CR (ranging from 0.83 to 0.87) and AVE (ranging from 0.63 to 0.70) all exceeded the acceptable value of 0.50, showing an acceptable convergent validity of the measurement.
Discriminant validity is secured if a construct was not significantly correlated with other different constructs (Viswanathan, 2005). A Chi-square difference test can be used to evaluate discriminant validity by simultaneous pair-wise comparisons between constrained and unconstrained measure models (Anderson and Gerbing, 1988). In a constrained model, the correlation between two constructs was fixed at 1 but allowed other constructs to vary. If the chi-square difference (with 1 df) was significant, meaning that the two constructs are viewed as distinct (but correlated) factors, then discriminant validity can be obtained.
The critical value of the chi-square test based on the Bonferroni method under overall 0.01 levels is χ2(1, 0.01/10) = 10.83 (Bagozzi and Yi, 1988). Since the chi-square difference statistics for paired constructs all exceeded 10.83 (see Table 2.4), discriminant validity is successfully accomplished. Table 2.5 shows relevant background information about the latent constructs, including means, standard deviation, and intercorrelations for all constructs, as well as square root of the AVE on the diagonal line.
Table 2.4 Chi-square difference tests
*Significant at the 0.01 overall significance level by using the Bonferroni method.
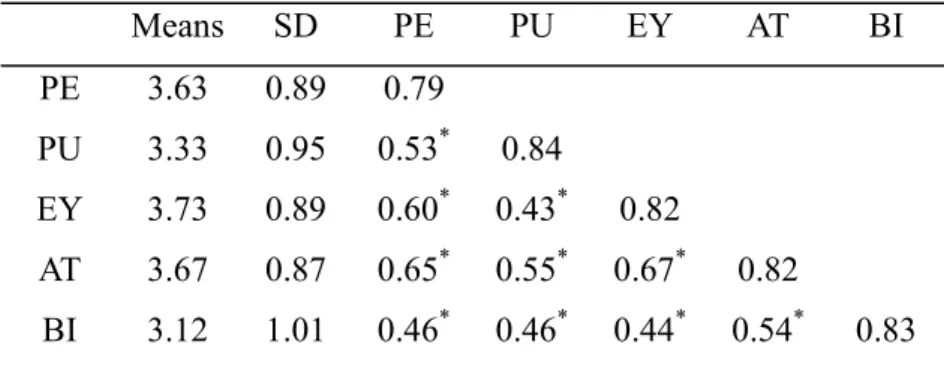
Table 2.5 Means, standard deviations, and correlations
Means SD PE PU EY AT BI PE 3.63 0.89 0.79 PU 3.33 0.95 0.53* 0.84 EY 3.73 0.89 0.60* 0.43* 0.82 AT 3.67 0.87 0.65* 0.55* 0.67* 0.82 BI 3.12 1.01 0.46* 0.46* 0.44* 0.54* 0.83
* p<0.01. Diagonal elements are the square root of AVE.
Unconstrained χ2(80)= 197.87 Construct Pair Constrained χ2(81) χ2(1) difference (PE, PU) 428.79 230.92* (PE, EY) 366.12 168.25* (PE, AT) 307.20 109.33* (PE, BI) 452.11 254.24* (PU, EY) 603.11 405.24* (PU, AT) 501.95 304.08* (PU, BI) 606.15 408.28* (EY, AT) 343.95 146.08* (EY, BI) 588.99 391.12* (AT, BI) 469.43 271.56*
2.5. Results
First, the issues of common method variance in this study are revealed in this section. Then structural equation modeling was conducted to ascertain the relationships among the above-mentioned constructs. Finally, the hypothesis results were demonstrated.
2.5.1 Common method variance
The issue of method biases has a long history in the behavioral sciences (Lindell and Whitney, 2001). Because items were mostly self-reported (same-respondent replies) from the same source, an uncertainty of common method variance (CMV) in survey research existed (Chang et al., 2010). After reviewing 216 IS-related literature, Malhotra et al. (2006) suggested that the existence of CMV leads to an inflated correlation approximately 0.10.
To deal with the issues of CMV, previous research have provided some useful strategies and statistical remedies for evaluating the extent of the potential biases, including the Harmon’s one-factor test and the Chi-square difference test (Podsakoff et al., 2003; Straub and Burton-Jones, 2007; Straub et al. 2004)
First, a Harmon’s one-factor test was conducted. This test involves an exploratory factor analysis of all items to “determine whether the majority of the variance can be accounted for by one general factor” (Podsakoff et al., 2003). If a common method variance exits, then all items constitute a single general factor which accounts for over 50% of the variance. In this study, the first emerging factor accounted for explaining 39% of the variance, and all five factors together accounted
for explaining 79.34% of the variance. Results from this test suggested the presence the little chance of the possibility of common method bias.
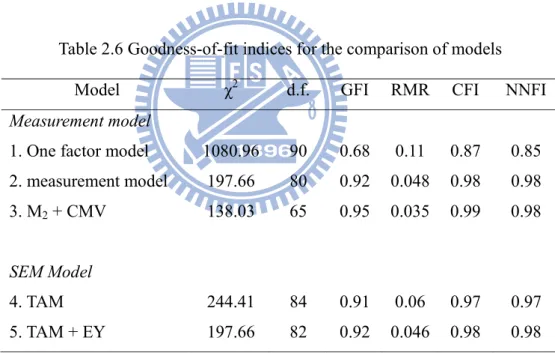
A second analysis follows Straub et al. (1995), in which we compared Chi-square values of two models: the measurement model (model 2) and the common-factor measurement model (model 1), in which all items have one underlying factor (see Table 2.6). According to the chi-square difference test, the result showed that the measurement model fits the data better than a single-factor model (p<0.0001), providing a support for the validity of constructs in the measurement model.
Table 2.6 Goodness-of-fit indices for the comparison of models
Model χ2 d.f. GFI RMR CFI NNFI
Measurement model
1. One factor model 1080.96 90 0.68 0.11 0.87 0.85
2. measurement model 197.66 80 0.92 0.048 0.98 0.98 3. M2 + CMV 138.03 65 0.95 0.035 0.99 0.98 SEM Model 4. TAM 244.41 84 0.91 0.06 0.97 0.97 5. TAM + EY 197.66 82 0.92 0.046 0.98 0.98 2.5.2 Hypotheses testing
Following the first step of measurement model testing, the next step was to analyze the structure model. Our proposed model showed that the goodness-of-fit is acceptable (χ2/df = 197.66/82 = 2.41; CFI = 0.98, IFI = 098, NNFI = 0.98, GFI = 0.92,
RMR = 0.05, RMSEA = 0.067). In order to examine the relationships between independent and dependent variables, a further examination of hypotheses testing was reported in Table 2.7.
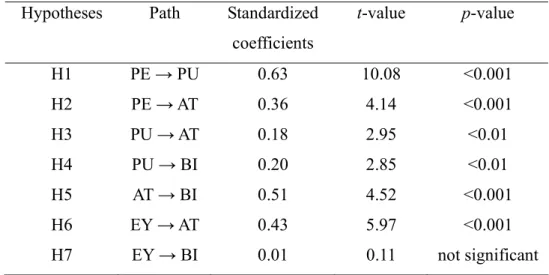
Hypotheses from 1 to 5 examined the paths in TAM. The results indicated that: the effects of perceived ease of use on perceived usefulness (β = 0.63, p<0.001) and attitudes (β = 0.36, p<0.01) were significant; the links between perceived usefulness on attitudes (β = 0.18, p<0.01) and behavioral intention (β = 0.20, p<0.01) were significant. Finally, attitudes had an impact on behavioral intention (β = 0.51,
p<0.001). All the paths were supported.
Hypotheses 6 and 7 investigated the links between perceived enjoyment and the TAM variables. The positive influences of perceived enjoyment on attitudes (β = 0.43,
p<0.001) were confirmed, but not on behavioral intention to use e-textbook (β = 0.01, t = 0.11, not significant). According to the testing results, hypothesis 6 was supported,
but hypothesis 7 was not.
Table 2.7 Path coefficients and t-values Hypotheses Path Standardized
coefficients t-value p-value H1 PE → PU 0.63 10.08 <0.001 H2 PE → AT 0.36 4.14 <0.001 H3 PU → AT 0.18 2.95 <0.01 H4 PU → BI 0.20 2.85 <0.01 H5 AT → BI 0.51 4.52 <0.001 H6 EY → AT 0.43 5.97 <0.001 H7 EY → BI 0.01 0.11 not significant
The present study also found that the proposed model accounted for 43% of the variance explained in behavioral intention, and 71% of variance in attitudes toward e-textbook. The results of the current study also depicted in Figure 2.3.
Perceived Usefulness Perceived Ease of Use Attitudes (R2=0.71) Behavioral Intention (R2=0.43) Perceived Enjoyment 0.63*** 0.18** 0.20** 0.51*** 0.01 0.43*** 0.36*** TAM
Figure 2.3 Results of final model with standardized coefficients
Note: Solid line represents a significant path; in contrast, dotted line stands for a non-significant path. Significance level: *p<0.05; **p<0.01; ***p<0.001
2.5.3 Comparing extended TAM with the original TAM
The extended TAM was compared with the original TAM. Both models explained 43% of the variance in behavioral intention. However, the original TAM accounted for only 68% of the attitudes variance (compared with 71% in the proposed model). In addition, the proposed model showed better fit to the data than TAM did, and the chi-square difference between these two models was significant As shown in Table 2.6 (χ2 = 197.66 for the proposed model and χ2 = 244.41 for TAM).
Chapter 3. Why do people use App? Exploring the antecedents of
satisfaction from usefulness, enjoyment and social image
To explore user’s satisfaction towards digital services, the current study used perceived usefulness, enjoyment and social image as the antecedents of satisfaction to investigate why do people use App. In this section, mobile application, represented as a kind of digital service, is first introduced. Theoretical background and hypotheses development is then elaborated in section 3.2. Following hypotheses, research methodology is presented in section 3.3. The empirical results are summarized in section 3.4.
3.1. Introduction
Evolutionary developments in mobile devices and wireless networking technology have changed the nature of digital contents and providing a useful accessibility to consumers. The term “App” has therefore become a popular issue in the emerging wireless and mobile applications, even been listed as “Word of the Year” by the American Dialect Society in 2010.
App services were available from various information and communications technology (ICT) providers, including Apple App Store, BlackBerry App World, and Google Play-formerly Android Market. Since 2009, the great demands for App users were dramatically shaped and developed. Competitors in the App market were all moving aggressively to increase the number of downloads from its application store
to boost revenue generated from value-added services. It was reported over 25 billion downloads in Apple App Store by 2012, and one billion downloads at BlackBerry App World. Furthermore, according to AppBrain survey, about 550,000 Apps were available, and 10 billion Apps were installed from Android users in by 2012. In total, more than one million Apps have been created and 21 billion Apps have been downloaded through three major ICT providers.
App was originally intended for utilitarian functions, such as email, GPS and location-based services, calendar and contact databases. However, the vary demands of public causes rapid expansion of App into other areas such as online music, games, shopping, and instant messaging. While some Apps are free for downloading, others need to pay for getting extra credits and advanced functions.
Despite of the substantial amounts downloaded of App globally, factors influencing consumers’ satisfaction toward the use of App are still unknown. So far, only a few researches have focused on this issue. For example, Arvanitis et al. (2011) adopted affective and motivational factors into the TAM to explain the acceptance of a mobile augmented reality system for science education. Kim (2012) invested the diffusion of mobile data services and applications by integrating existence behavioral intention models and focusing on the role of habit. The current study is one of the precursors dedicated on the studies of App by integrating renowned IS theories with other three perspectives, namely, utilitarian, hedonism and social views. We tried to answer the following questions: (1) what is the adequate model specific to App? (2) what are the factors determining consumers’ satisfaction and purchase intention of App?
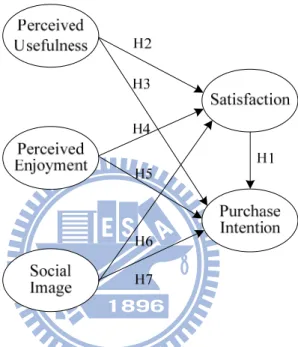
model (TAM) and expectation-confirmation theory (ECT) for IS continuance. Specifically, the antecedents of App satisfaction and purchase intention from three perspectives: utilitarian, hedonic, and social view will be investigated in the present study. Our research framework presented in Figure 3.1.
Figure 3.1 Research framework
3.2. Theoretical background
Oliver (1997) pointed out that to meet consumers’ satisfaction two perspectives were required: functional and psychological levels, i.e., utilitarian and hedonic purposes, especially for the Web usage (Batra and Ahtola, 1991; Mano and Oliver, 1993; Van der Heijden, 2004). However, in the study of online behaviors, such as on-line games or internet-based study, social aspects do exert some significance on the outcome of such internet usage studies (Lin and Bhattacherjee, 2010). The online
App offered millions of applications for everything from games, social networking (e.g., Instant Messaging) to financial planning and daily life management. Therefore, the nature of App services should serve for multipurpose including functional, hedonic, and social value dimensions. Accordingly, we try to identify antecedents of satisfaction and purchase intention of App usage by introducing three points of view, utilitarian, hedonic, and social perspectives as follows.
3.2.1 App satisfaction and purchase intention
Satisfaction along with continuance usage is viewed as the key to foster and retain a loyal relationship with consumers (Oliver, 1981). It is essentially important in the IS domain because the eventual success of an IS depends more on consumers’ satisfaction and continued usage (Bhattacherjee, 2001). In the current study, we defined satisfaction as the affective response and total consumption evaluation when using App (Palvia, 2009). Empirical evidence showed that users’ satisfaction with the system to lead to system usage (Baroudi et al., 1986). Many studies have indicated that satisfaction is the direct antecedents of post-behavioral intention, such as loyalty, continuance intention, or recommendation (Cronin et al., 2000; Zeithaml, et al., 1996).
Consumer satisfaction and post-purchase behavior have been widely discussed based on the expectation-confirmation theory (Oliver, 1981; Dabholkar et al., 2000). In ECT, users’ IS continuance intention is determined by two constructs: expectation of the IS and confirmation of expectation following actual use. Based on TAM and ECT, Bhattacherjee (2001) proposed “post-acceptance model of IS continuance”,
which seeks to explain an IS user’s intention and focuses only on post- acceptance variables as shown in Figure 3.2. In this model, perceived usefulness is an adequate expectation in the IS continuance context and users’ IS continuance intention is determined primarily by their satisfaction with prior IS use.
Figure 3.2 Expectation-confirmation theory (ECT)
Although ECT is widely used in the consumer behavior and service marketing literature, it has been criticized for ignoring the potential changes on subsequent cognitive process. That is, consumers’ post-purchase expectation may be different from their pre-purchase expectation. Furthermore, IS users’ continuance decision is similar to consumers’ repurchase decision because they all follow an initial (acceptance or purchase) decision (Bhattacherjee, 2001). Besides, Bhattacherjee (2001) argued that users with higher level of satisfaction tend to have stronger intention to use the online channel again in the context of online environment. The current studies of mobile services also supported this argument that customer satisfaction is positively related to post-purchase intention (Turel and Serenko, 2006; Wang et al., 2004). Based on Bhattacherjee’ (2001) post-confirmation for IS
continuance model, the following hypotheses, the satisfaction-continuance intention association, was derived.
Hypothesis 1: A consumer’s SA of App usage affects his/her App purchase intention.
3.2.2 Utilitarian influence
An important and long-standing research question for information system is how to accurately explain user acceptance on new information technology (DeLone and McLean, 1992). The dominant theory in this area of research is rooted in Davis’ technology acceptance model (TAM) (Davis, 1989; Davis et al., 1989), which is widely applicable to elucidate user acceptance of a new technology in the IS mainstreams of task-related systems, e-commerce systems, and hedonic systems (Hsiao and Yang, 2011).
The major strength of TAM is its’ parsimony along with predictive power while applying in different situations. However, the parsimony also limits TAM from generality while some information is needed to understand user acceptance for new systems (Mathieson, 1991). Oliver (1997) pointed out that to meet consumers’ satisfaction, two perspectives were required: functional and psychological levels. Specifically, both utilitarian and hedonic product evaluations are contributed to the judgments of satisfaction because users showed multipurpose while participating in online behaviors (Mano and Oliver, 1993; Holsapple and Wu, 2007). For example, some students seek hedonic Websites to satisfy their entertainment purposes, whereas
they search for utilitarian Websites to satisfy their course-related purpose (van der Heijden, 2004).
The consumer behavior literature has demonstrated that both utilitarian and hedonic value would influence consumers’ repurchase and use intention of products or services (Bauer et al., 2005). For example, users showed multipurpose while participating in virtual worlds because they contain both hedonic and utilitarian components (Holsapple and Wu, 2007). The purpose of a utilitarian information system is to increase the user’s task performance while encouraging efficiency. Babin et al. (1994) empirically showed a strong correlation of utilitarian value with satisfaction.
Based on a utilitarian view, perceived usefulness (PU) and perceived ease of use (PE) are viewed as key variables of influencing behavioral intention to use IS which are two major determinants of the TAM. While PU has consistently proven to be an important construct in longitudinal adoption to post-adoption behavior and in prior continuance studies, PE has not. As Bhattercherjee (2001) stated: “ease of use has an inconsistent effect. . . which seems to further subdivide and become non-significant in later stages’’. This has been confirmed in numerous other studies (Barnes, 2011).
In addition, PU has also been shown to be a predictor in new media contexts including the Internet, the Web and mobile commerce. Hence, we included only PU in our model. Based on aforementioned TAM and IS continuance model (Bhattacherjee, 2001), the following hypotheses are straightforwardly derived:
Hypothesis 2: A consumer’s PU of App usage affects his/her SA of App usage Hypothesis 3: A consumer’s PU of App affects his/her App purchase intention
3.2.3 Hedonic influence
The App serves as both utilitarian and hedonic purposes. While perceived enjoyment strongly influenced web use for entertainment purposes, perceived usefulness strongly influenced web use for course-related purposes. Different from traditional information technology, mobile commerce service is mostly for the entertainment purpose, for users will pay much attention to emotional experience in the popular entertainment service.
In addition to individual user or consumer level, the focus of this study, mobile App can be construed as having a hedonic element where users experience pleasure or fun when using the system. For example, “Angry Birds Space” showed its most dominant power worldwide among other App, even though it is a paid App. These may include socializing, romantic encounters, shopping for desirable personal items, playing games, fantasy, the creation of an alter-ego and other experiences that may contribute to building self-esteem.
Barnes (2011) treated PU and EY as the hedonic and utilitarian components, respectively, and suggested that the modern digital products and services should be construed as multipurpose IS because they contain both hedonic and utilitarian components. Individuals often seek sensations on multiple sensory channels, and mobile App can provide such experiences. This is a trait characteristic of hedonic IS in general – developers may employ animated images, colors, sounds, and esthetically appealing visual layouts to encourage prolonged use. Jones et al. (2006) indicated that hedonic value had a significant effect on satisfaction in the traditional retail context.
The value of a hedonic system reflects the degree to which the user experiences fun when using IS. The dominant objective is captured by perceived enjoyment (EY). Davis et al. (1992) introduced the concept of perceived enjoyment to TAM model as a crucial role in explaining consumer adoption of new technology. Perceived enjoyment has a stronger effect on users’ attitudes towards hedonic systems because the context of such systems is to maximize users’ enjoyment or entertainment while using certain technology (Childers et al., 2001). Moreover, the consumer behavior literature has determined strong support for repurchase and use intentions driven by both utilitarian and hedonic value in products or services (Bauer, et al., 2005).
As aforementioned, user satisfaction is conceptualized as the affective reactions of individuals towards the use of App. Enjoyment was introduced and placed parallel to the main belief constructs of TAM (usefulness or relative advantage and ease of use) as a cognitive response. User satisfaction construct is therefore perceived as parallel to the attitudes construct. Thus, the following hypotheses are straightforwardly derived from the extended TAM (Davis et al., 1992).
Hypothesis 4: A consumer’s EY of App usage affects his/her SA of App usage Hypothesis 5: A consumer’s EY of App affects his/her App purchase intention
3.2.4 Social influence
The TAM does not include social factors, which have been found to have a significant influence on IT usage behavior. Recent research has produced further evidence that the relevance of emotional, hedonic, and social aspects should not be
ignored (Koller et al., 2011). In some mobile applications of interpersonal interaction (e.g., text messaging service or online games), the social dimension is believed to affect people’s overall value assessment (Turel et al., 2007). These trendy and innovative technological applications can help to enhance the self-image around one’s social networking community, greatly altering the way users interact, communicate, and express values and opinions (Kim et al., 2011). To a certain extent, the social factors are a means of conveying symbolic information to an individual’s social community. Accordingly, we identified social image as the social influence in the current study.
Social image is defined as the extent to which users may obtain respect and admiration from their social network because of using new technology (Moore and Benbasat, 1991). Some social medial Apps allow people to upload their own images, see the ones that others have taken and uploaded right away, and thus could receive positive attention and admiration from others. For example, “WhatsApp Messenger” allows users instantly to get messages from friends, colleagues and family. By frequently receiving feedbacks from others, these high-level interactive media carrying certain meaning to enhance one’s social status can increase the effect of one’s social self-concept (Wang et al., 2004). Therefore, it is reasonable to assume that to enhance an individual’s social image would improve his or her attitude towards the technology, which in turn, would affect their future usage intention. Thus, we have the following hypotheses.
Hypothesis 6: A consumer’s SI of App usage affects his/her SA of App usage Hypothesis 7: A consumer’s SI of App affects his/her App purchase intention
3.3. Research methodology
Following theoretical development, research method is presented. For the purpose of this study, participants and procedure are first introduced. Next, descriptive statistics of the sample used in this study are presented. Other related issues in this section are measurement and instrument assessment. Finally, CFA was performed to validate the critical factors of perceived usefulness, enjoyment, social image, and satisfaction as well as purchase intention towards using App.
3.3.1 Participants and procedure
To investigate the antecedents and consequence of consumer satisfaction towards App usage, college students with smart phones from several universities in northern Taiwan were recruited to participate in the current study. This survey was administered by an experienced instructor during regular class time under the permission of the teachers and students. Extra credit was given to enhance the motives for participating.
In Taiwan, about two-thirds of smart phone owners have downloaded mobile App by 2012, showing an increasing penetration trend among potential mobile market. Besides, the Taiwan’s Networked Readiness Index3 (NRI) has ranked in the sixth
3 The World Economic Forum’s Networked Readiness Index (NRI) measures the propensity for countries to exploit the opportunities offered by information and communications technology. It is published annually. The NRI seeks to better comprehend the impact of ICT on the competitiveness of nations. The NRI is a composite of three components: the environment for ICT offered by a given country or community (Market, political and regulatory, infrastructure environment), the readiness of the community’s key stakeholders (individuals, businesses, and governments) to use ICT, and finally the usage of ICT amongst these stakeholders.
among the 138 economies by 2011 (FIND, 2011). The well-developed infrastructure suggested that Taiwanese have more experience with mobile applications compared with other countries and are qualified with the study of mobile App.
A total of 341 questionnaires were available for analysis after excluding 33 incomplete copies, resulting in an effective response rate of 91.2%. On average, the responding students were 23.77 years old (standard deviation is 4.99). Male and female students made up 36% and 64% of the sample, respectively. Most students’ smart phones were HTC (33%) and iPhone (30%), and paid a fixed online fee monthly to have unlimited online accessibility (73%) as shown in Table 3.1. Noted that there were 87 percent of the respondents have used paid App.
Table 3.1 Characteristics of the sample (N=341)
Characteristics Number Percentage (%)
Gender Male 121 35.8 Female 217 64.2 Age Below 20 32 9.5 Between 21 and 25 257 76.0 Over 25 49 14.5
Brands of Smart Phone
hTC 113 33.3
iPhone 101 29.8
Samsung 59 17.4
Sony Ericsson 35 10.3
Others 31 9.1
Online Access rates
Unlimited accessibility 250 73.7
limited accessibility 89 26.3
Paid for App
No 297 87.6
Yes 42 12.4
Note: Some missing data are not counted
3.3.2 Measurement
Following previous literature and their validated instruments, research items were drawn and modified to measure the constructs with the anchors ranging from “strongly disagree” to “strongly agree”. A backward translation technique (with items translated from original English scale into Chinese, and back into English) was used.
Therefore, the discrepancies of versions were compared and resolved (Singh, 1995). Both perceived usefulness (PU) and perceived enjoyment (EY) were drawn from Davis et al. (1992). Social image (SI) was adopted from Teo and Pok (2003). Finally, indicators for measuring satisfaction (SA) and purchase intention (PI) towards the use of App were modified from Vila and Kuster (2011) and Grewal et al. (1998) respectively. All of the items and their sources are listed in the Appendix –B.
3.3.3 Measurement assessment
To achieve reliability and validity for the measures, the authors considered a two-step approach SEM (Anderson and Gerbing, 1988). First, the measurement model was evaluated by using confirmatory factor analysis (CFA) accompanying with LISREL 8.51. Results from Table 3.2 showed a satisfactory fit to the data with Chi-square (χ2) of 243.33 (df = 94, p<0.001) and other goodness of fit indices: NFI = 0.97; NNFI = 0.98; CFI = 0.98; IFI = 0.99; GFI = 0.92; AGFI = 0.88; RMR = 0.036; RMSEA = 0.068. Additionally, the composite reliability, measuring how consistently individuals respond to the items within a scale, provided the evidences for the existence of internal reliability (ranging from 0.87 to 0.96). All the variables also demonstrated significant positive inter-correlations.
Table 3.2 Descriptive statistics, reliability, variance explained, and correlations. Means S.D. CR PU EN SI SA PI PU 4.75 1.22 0.87 0.84 - - - - EN 5.24 1.29 0.96 0.52* 0.94 - - - SI 4.31 1.24 0.89 0.53* 0.50* 0.82 - - SA 4.79 1.11 0.88 0.61* 0.67* 0.67* 0.84 - PI 3.54 1.56 0.91 0.38* 0.31* 0.40* 0.38* 0.87
* p<0.01; On-diagonals are square roots of AVE.
Convergent validity was statistically achieved by two ways. First, CR and AVE for each construct in Table 3.2 all exceeded 0.5, indicating that items explain more variance in the underlying construct than measurement error doses (Fornell and Larcker, 1981). Second, all factor loadings for indicators contained in the same construct were statistically significant with t-value ranging from 16.50 to 23.98.
Discriminant validity was measured by a technique of Chi-square difference test which conducting the simultaneous pair-wise comparisons between constrained and unconstrained measure models (Anderson and Gerbing, 1988). If the chi-square difference (with 1 df) was significant, meaning that the two constructs are viewed as distinct (but correlated) factors, then discriminant validity can be obtained. According to Bagozzi and Yi (1988), the critical value of the Chi-square difference test based on the Bonferroni method was used in the present paper. The threshold
under overall 0.01 levels with 1 df ( 2
10 / 01 . 0 , 1
) is 10.83. Since the Chi-square
discriminant validity is successfully accomplished.
Table 3.3 Chi-square difference tests
Unconstrained 2 94 = 243.33 Construct Pairs Constrained 2 95 2 1 difference (PU, EN) 604.90 361.57* (PU, SI) 598.21 354.88* (PU, SA) 518.56 275.23* (PU, PI) 820.45 577.12* (EN, SI) 926.62 683.29* (EN, SA) 517.12 273.79* (EN, PI) 787.03 543.70* (SI, SA) 446.48 203.15* (SI, PI) 777.94 534.61* (SA, PI) 672.63 429.30*
* p<0.01 by using the Bonferroni method.
3.4. Empirical results
3.4.1 Common method variance
To deal with the issues of CMV, previous research have provided some useful strategies and statistical remedies for evaluating the extent of the potential biases, including the Harmon’s one-factor test and the Chi-square difference test (Podsakoff
et al., 2003; Straub and Burton-Jones, 2007; Straub et al. 2004)
First, a Harmon’s one-factor test was conducted. This test involves an exploratory factor analysis of all items to “determine whether the majority of the variance can be accounted for by one general factor” (Podsakoff et al., 2003). If a common method variance exits, then all items constitute a single general factor which accounts for over 50% of the variance. In this study, the first emerging factor accounted for explaining 18.62% of the variance, and all five factors together accounted for explaining 82.61% of the variance. Results from this test suggested the presence the little chance of the possibility of common method bias.
A second analysis follows Straub et al. (1995), in which we compared Chi-square values of two models: the measurement model and the common-factor measurement model, in which all items have one underlying factor. According to the chi-square difference test, the result showed that the measurement model fits the data better than a single-factor model (p<0.0001), providing a support for the validity of constructs in the measurement model.
3.4.2 Results of structure model
With an adequate measurement model, the next step was to analyze the structure model for the hypotheses testing. Results showed a satisfactory fit to the data ( 2
94
= 243.33; NFI = 0.97; NNFI = 0.98; CFI = 0.98; IFI = 0.98; GFI = 0.92; AGFI = 0.88; RMR = 0.07; RMSEA = 0.068.). Next, by examining the standardized path coefficients, we found that all the paths are significant with the expected direction except for two paths from satisfaction and perceived enjoyment to purchase intention
(Hypotheses 1 and 5) as shown in figure 3.3. Perceived Usefulness Satisfaction (R2=0.75) Perceived Enjoyment Social Image 0.28** 0.05 0.19* 0.02 0.37*** 0.25*** 0.41*** Purchase Intention (R2=0.23)
Figure 3.3 Results of structural model with standardized coefficients
Note: Solid line represents a significant path; in contrast, dotted line stands for a non-significant path. Significance level: *p<0.05; **p<0.01; ***p<0.001.
Results of hypotheses from 2 to 4 as shown in Table 3.4 indicated that: the effects of perceived usefulness on both satisfaction (β = 0.25, p<0.001) and purchase intention (β = 0.19, p<0.05) were significant; the links between perceived enjoyment on satisfaction (β = 0.37, p<0.001) was significant. It was noteworthy that social image was a significant determinant of both satisfaction (β = 0.41, p<0.001) and purchase intention (β = 0.28, p<0.001).
In addition, the present study also found that the proposed model accounted for 23% of the variance explained in purchase intention, and 75% of variance in satisfaction toward the use of App.
Table 3.4 Path coefficients and t-values Hypothesis Path Standardized
coefficient t-value Results H1 SA → PI 0.05 0.41 n.s. H2 PU → SA 0.25*** 4.57 Supported H3 PU → PI 0.19* 2.30 Supported H4 EN → SA 0.37*** 7.22 Supported H5 EN → PI 0.02 0.29 n.s. H6 SI → SA 0.41*** 7.34 Supported H7 SI → PI 0.28** 3.01 Supported
Chapter 4. Managerial implications
Based on the results of statistical data analysis in the previous section, Theoretical and practical implications are derived and drawn here. Finally, limitation of the study and suggestions for future research and limitations are also provided.
4.1. Implications from the first study
This study is one of the few attempts to investigate student acceptance of e-textbooks. An intrinsic motivation, perceived enjoyment, was added to TAM to predict the adoption intention of e-textbooks. This model was found to have a very good fit to the data. All path coefficients were found statistically significant, except for the effect of perceived enjoyment on behavioral intention. Based on the empirical findings, we reached the following conclusions.
First, the TAM is suitable to predict and explain consumers’ adoption of e-textbooks. Both perception of ease and usefulness affect consumers’ attitudes towards e-textbooks, but the former has stronger influence on attitudes than the latter. It indicated that perceived ease of use played a pivotal role in the user acceptance of e-textbook. A practical implication aligned with the study of Nicholas et al. (2010), to enhance consumers’ attitudes towards e-textbooks, it is more useful to make the downloading process and usage of e-textbooks easily and conveniently than to emphasize the function and effectiveness of e-textbooks.
Next, perceived enjoyment demonstrates itself to be worthwhile as an important part of the extension of the TAM. In line with previous studies (van der Heijden,