Department of Business Administration
I-Shou University
Master thesis
Assessment on satisfaction of customers with
service quality in Vinpearl Land Nha Trang
Advisor: LIOU, JIN- PIN, Ph.D
Co-advisor: HO SY TAN, Ph.D
Graduate Student:
HO TUAN AN
Acknowledgement
In the implementation process of this subject, I have received supports from friends, teachers, other individuals and organizations.
At first, I would like to express my deep gratitude to the School Management Board of Ishou University, Hong Bang International University, Electric Power University and the teachers who have instructed all the knowledge and researching methods and have created favorable conditions for me during my master’s degree program.
I gratefully appreciate Doctor Liou, Jin-Pin and Doctor Ho Sy Tan, who are my scientific mentors. They instructed me to implement this research topic with the enthusiasm and full responsibility of the teacher.
Sincerely thank to teachers and heads of agencies that provided documents and gave valuable comments during my process of study.
Sincerely thank to all my classmateswho have stood by me and gave me valuable advices to well complete the course. In addition, I could not forget to thank to collaborators and friends who helped me to conduct interview, coding, data entry and data verification.
Sincerely thank to my family who always supported me during my research process. At last, sincerely thank to teachers in theThesis Defense Council who had highly valuable comments for this thesis.
Sincerely thank you!
Abstract
The service sector increasingly proves its important role in the development of a nation. Along with the process of integration and the structural transformation of the international economy, the value of the servicesector increasinglytakes the high proportion of the gross domestic product (GDP) of each country. In Vietnam, the service sector is constantly growing and it is showing the important role in the development of the general economy. It is reflected through the expansion of the service sector, especially in the context of integration and development of trade and economy. The research aims at assessing levels of customer satisfactionwith service quality at the amusement park. The results of research show that customer satisfaction with the recreation areas in Nha Trang is influenced by six factors: (1) service capacity (measured by 5 observed variables); (2) tangible facilities (measured in 4 observed variables); (3) the image (measured in 4 observed variables); (4) the reliability (measure in 3 observed variables); (5) the empathy (measured by 2 observed variables) and (6) the cost (measured by 2 observed variables).
Keywords: Vinpearl Land, service quality, customer’s satisfaction
TABLE OF CONTENTS
Acknowledgement ... i
Abstract ... ii
TABLE OF CONTENTS ... iii
LIST OF TABLES ... vi
CHAPTER 1 INTRODUCTION ... 1
1.1 REASON TO CHOOSE THE TOPIC ... 1
1.2 RESEARCH OBJECTIVES ... 1
1.3 RESEARCH METHODAND THE SCOPE OF RESEARCH ... 2
1.4 THE PRACTICAL SIGNIFICANCE OF THE RESEARCH ... 2
1.5 OVERVIEW OF VINPEARL LAND NHA TRANG ... 2
1.6 THE STRUCTURE OF THE RESEARCH... 5
CHAPTER 2 LITERATURE REVIEW ... 6
2.1 SERVICE QUALITY ... 6
2.1.1 DEFINITION ... 6
2.1.2 CHARACTERISTICS OF THE SERVICE ... 6
2.1.3 THE GAP IN THE PERCEPTION ABOUT THE SERVICE QUALITY ... 7
2.1.4 MEASUREMENT OF THE SERVICE QUALITY ... 9
2.2 THE SATISFACTION OF CUSTOMERS ... 10
2.3 THE SERVICE QUALITY AND THE CUSTOMER SATISFACTION ... 11
2.4 RELEVANT RESEARCHES ... 12
2.5 THE RESEARCH MODEL AND HYPOTHESES ... 13
CHAPTER 3 RESEARCH METHODOLOGY ... 16
3.1 RESEARCH DESIGN ... 16
3.2 THE SCALE ADJUSTMENT ... 18
3.2.1 THE SERVQUAL ... 18
3.2.2 MEASUREMENT OF CUSTOMER SATISFACTION ... 19
3.3 FORMAL RESEARCH ... 19
3.4 SUMMARY ... 20
CHAPTER 4 RESEARCH RESULTS ... 21
4.1 INTRODUCTION ... 21
4.2 SAMPLE DESCRIPTION ... 21
4.3 DATA CLEANING ... 22
4.4 PRELIMINARY ASSESSMENT ON SCALE ... 22
4.5 CRONBACH’S ALPHA RELIABILITY COEFFICIENT ... 23
4.5.1 Scale of factors that affect users ... 23
4.5.2 Scale of customer satisfaction ... 24
4.6 EXPLANATORY FACTOR ANALYSIS EFA ... 26
4.6.1 The scale of factors that impact the customer satisfaction ... 26
4.6.2The scale measuring thecustomer satisfaction ... 31
4.7 ADJUSTING THE RESEARCH MODEL... 31
4.8 PERFORMANCE OF SOME TESTS ... 33
4.8.1Correlation analysis and linear regression analysis ... 33
4.8.2 Kruskal – Wallis nonparametric test and Bonferroni test ... 39
4.9 SUMMARY ... 46
CHAPTER 5 CONCLUSIONS AND RECOMMENDATIONS ... 47
5.1 RESULTS OF RESEARCH ... 47
5.1.1 The measurement model... 47
5.1.2 Theoretical model ... 48
5.2 RECOMMENDATIONS ... 48
5.2.1 Group of solutions in terms of “tangible facilities” ... 48
5.2.2Group of solutions in terms of “service capacity" ... 49
5.2.3 Group of solutions in terms of “image” ... 49
5.2.4 Group of solution in terms of “costs” ... 50
5.2.5 Group of solution in terms of “reliability” ... 50
5.2.6 Group of solution in terms of “empathy” ... 50
5.3 LIMITATIONS OF THE RESEARCH AND SUBSEQUENT DIRECTIONS OF RESEARCH ... 51
REFERENCES ... 52
Appendix 1: Outline of group discussion in qualitative research ... 54
Appendix 2: Quantitative research questionnaire ... 54
LIST OF FIGURES
Figure 2.1 Model of the service quality and the customer satisfaction ... 12
Figure 2.2 Model of the service quality and the customer satisfaction in the outdoorrecreationarea in Ho Chi Minh City ... 13
Figure 2.3: Proposed research model ... 14
Figure 3.1 Research process ... 18
Figure 4.1 : The adjusted theoretical model ... 33
LIST OF TABLES
Table 2.1: Inheritance of factors in the proposed model ... 15
Table 3.1: Implementation progress of researches ... 16
Table 4.1: Table of distribution by gender ... 21
Table 4.2 Table of distribution by income of each family ... 21
Table 4.3 Statistics table of visitors from within the province or from outside the province ... 22
Table 4.4: The statistical table of Cronbach’s Alpha of each scale ... 25
Table 4.5: The final result of the EFA of the customer satisfaction ... 28
Table 4.6: Model Summary and ANOVA ... 36
Table 4.7: Standardized regression coefficient of equation ... 38
Table 4.8: Results of hypothesis testing ... 39
Table 4.9: Table of descriptive statistics of the “service capacity” scale ... 40
Table 4.10: Table of descriptive statistics of the “tangible facilities” scale ... 40
Table 4.11: Table of descriptive statistics of the “image” scale ... 41
Table 4.12: Table of descriptive statistics of the “reliability” scale ... 42
Table 4.13: Table of descriptive statistics of the scale of “empathy” ... 43
Table 4.14: Table of descriptive statistics of the “cost” scale ... 43
Table 4.15: Table of descriptive statistics of the scale of “satisfaction” ... 44
CHAPTER 1 INTRODUCTION
1.1 REASON TO CHOOSE THE TOPIC
The service sector increasingly proves its important role in the development of a nation. Along with the process of integration and the structural transformation of the international economy, the value of the servicesector increasinglytakes the high proportion of the gross domestic product (GDP) of each country.
In Vietnam, the service sector is constantly growing and it is showing the important role in the development of the general economy. It is reflected through the expansion of the service sector, especially in the context of integration and development of trade and economy. Apart from traditional services like transport, postal and insurance, new services such as finance, telecommunication, science and technology, advertising, investing consultancy, law, entertainment…have effectively made the service become an important economic sector in the general development of the country. In recent years,the sectors including tourism, entertainment, resorts and villa…are invested to expand, typically in some provinces and cities such as Ho Chi Minh City, Hanoi, Nha Trang, Da Nang, and Quang Ninh… This development shows that our country’s potential tourism is very great. However, the tourism of our country is falling into the situation that tourists only come once, never come back and select another country for travelling. It means that our service quality is an urgent issue, which needs to be solved by managers of service enterprises.
Nha Trang is an attractive destination for tourists. There are more than 10 areas of amusement and resorts and villa for tourists to choose. In addition, a destination that cannot be ignored is the Vinpearl Land amusement park. Itis the place to hold a variety of international and domestic events… Annually,there are a great deal of visitors come here,especially in the high season. Does the high number of visitors indicate that customers are satisfied with the service here? Which factors make customers satisfied with this area? Why do some customers only come once and never come back to Vietnam? What are things that make customers not be satisfied?
For above reasons, I decided to choose the topic: “Assessment on satisfaction of customers with service quality in Vinpearl Land Nha Trang” as my thesis topic.
1.2 RESEARCH OBJECTIVES
The research aims at discovering components of a service quality and measuring them in the Vinpearl Land, namely:
Assessing levels of customer satisfaction with service quality at the amusement park. Finding out the factors which affect the customer satisfaction with the service quality at the amusement park.
Recommending solutions to increase the service quality at the amusement park for the next time.
1.3 RESEARCH METHODAND THE SCOPE OF RESEARCH
This research topic only focuses on the factors, which affect the customer satisfaction at the amusement park.It is performed in two key steps:preliminary and final research. The preliminary research was performed by the qualitative method. The technique of focusing group discussion will be used for this method to find out the factors that affect customer satisfaction, and then add these factors into the theoretical measurement, thereby buildinganformal research model and giving the research hypotheses.
The formal research was carried out through the direct interview technique at the amusement park. Specifically, it was conducted in the Vinpearl Land with the scope of 180 domestic tourists. The survey lasted from April, 2015 to October, 2015. This research aimsat testing the measurementscale and theoretical model. The measurementscale was preliminarily inspected by the Cronbach alpha reliabilitycoefficient, exploratory factor analysisand the multiple linear regression through the SPSS Software to assess the measurementscale and test the research model.
1.4 THE PRACTICAL SIGNIFICANCE OF THE RESEARCH
In the context of the increasingly complicated and keen competition of the market, service marketers should always improve their service quality. To assess the level of customer satisfaction with the service quality and to define factors, which affect customer satisfaction at the amusement park, the researchresults will directly provide management units and service enterprises with factors that have influences on the customer satisfaction. Thereby, the enterprises will have a comprehensive view of the service quality, and they can focus better on plans to recover the service quality, to distribute human resources as well as to encourage employees.On that basis, the entertainment business units will gradually get the loyalty of customers that is a foundation of competitive advantage.
Finally, this research could be a reference material ontheory of the service quality and the customer satisfaction for students who major in marketing and management business.
1.5 OVERVIEW OF VINPEARL LAND NHA TRANG
Head to Nha Trang, you shall be lost into a fairyland. With typical tropical climate, Nha Trang brilliantly performs in blue ocean, white sand and bright sunshine. The beautiful
coastal city is named “The colorful fresh flower basket on the East Coast” or“The sunny deck”. It is not accident that over 100 years ago, Alexander Yersin, a genius scientist, decided to leave luxury Paris to stick with Nha Trang until the end of his life. Nha Trang Bay is rated as one of thirty most beautiful bays in the world. Many ocean currents, which flow through the Bay, blended and made the home for variety species of sea fauna. Nha Trang Bay not only has rich resources and wonderful landscape, but also the beauty of sea culture and unique attractions... Now, the story about Nha Trang will be continued by the nameof the Vinpearl Land and the Vinpearl Resort & Spa, which is a sparkling pearl beaded on the crown of the ocean queen.
Coming to Vinpearl Land, customers will have an opportunityto experience and relax at the Vinpearl Resort and Spa five star hotel. The hotel has 485 rooms of wonderful design that include 17 luxury suites and 02 presidential ones The resort can please even most fastidious customers by giving them comfort, privacy, convenience and impeccable service. The Vinpearl Resort and Spa has a 700-met natural beach, which is the best beach of Nha Trang and a modern outdoor swimming pool (the largest one of the Southeast Asia) with an area of 5,700 square meters, surrounded by coconut garden, grass and trees. Besides, there are the health and beauty care at Viet Spa as well as programs of recreation, travelling and sport for many ages. Diversesystem of restaurants here will meet all your culinary needs, which come from the typical flavor of Vietnam to other Asian and European styles.
At Vinpearl Land, many cultural and recreational events, especially great beauty contests of Vietnam and the world such as Miss Vietnam, Miss Vietnam World, Miss Earth, and Miss Universe... have been held. Therefore,aside from the name “Viet Pearl”, Vinpearl Land is known as “the island of beauty”, “paradise island”.
Vinpearl has the longest sea-crossing cable car in the world with 3,320meters in length. This cable system has the average height of 40meters and the highest height is 60meters. This system was designed with nine pillars that have the shape and structure like Eiffel tower, and laser lights them at night. Tourists see the Vinpearl cable car as a wonder of Nha Trang Tourism. Sitting in the cable car from an ideal height, passengers can take a look at the entire beautiful coastal city as well as the heaven landscape of Nha Trang Bay, one of 29 most beautiful and famous bays in the world. The Vinpearl cable car system has 60 cabins. Eachof which containseight people with transport capacity from 1,000 - 1,500 passengers per hour. The total time of the trip is about 12 minutes with the speed of 6m/s. It can safely operate under the condition of category 7 wind speed.
The amusement park is designed as an independent system. However, it is in harmony
with the Vinpearl Resort & Spa. The park is designed in an area of 200,000square meters with many modern and unique works. They include modern items to servethe needs of recreation, entertainment and discovery of customers. It is comparable with advanced amusement parks in the country and in Asia.
Vinpearl Water Park will bring customers who love water games an absolute satisfaction. This is the first water park by the beach and is the only one in Vietnam with the area of more than 60,000square meters. It provides customers with two worlds. Customers can enjoylively fun with thrilling sliding lanes, or take a rest on the 450-meterbeach of white sand. Customers can just relax on the beach, or can join exciting recreational activities in the water park. The game system is divided into areas such as the adventure game, family game and water park for children.
To meet the needs to explore the undersea world, visitors can visit the aquarium. With an area of over 3,400 square meters,the Vinpearl Aquarium is a miniature ocean that contains more than 300 beautiful, rare and exotic fishes coming from difference climate area in the world such as Northern Asia, Southern Asia, Amazon and Coastal... To visit the Vinpearl Aquarium, visitors will move by the escalator in an undersea tunnel that is designed elaborately for the mysterious and attractive feeling. In the exhibition space, there is variety of beautiful and rare fishes imported from other countries for the first time ever. The Vinpearl Aquarium is constructed in the modern technology, reaching the strict requirements of global technical standards. The entire campus of this Aquarium is a two-floor block, which is wrapped by fake cover. The Vinpearl Aquarium has a distinct advantage that is a close systemof technology culture with a modern and beautifully tunnel leading visitors to go around. Until now, the Vinpearl Aquarium is still holding the record as the largest aquarium in Vietnam.
A place that cannot be ignored is the water music stage. It has a capacity of over 5,000 seats and the movable stage for concerts, art events with excellent modern music and light. Every night, visitors can come to enjoy the show, which is supported by the unique laser. With the ideal location and the modern infrastructure, the Vinpearl Land has always been chosen as the venue for national and international great socio-cultural events, such as Miss Vietnam 2006, 16th Charming of Vietnam, the final round of Miss Vietnam World 2007, the contest “Queen of Vinpearl – Miss Universe 2008... and other major events.
In order to preserve memories of the holiday, visitors can buy beautiful souvenirs that feature the coastal region in the shopping street. Being inspired by peaceful and poetic Hoi An ancient town, the Vinpearl shopping street gives visitors the feeling of a traditional space
combined with modern features. With an entire area of over 6,000 square meters, the shopping street has many stalls in flexible area from 24 to 160 square meters. Main products are domestically and internationally popularjewelry, fashion clothes, luxury cosmetics, souvenir, decoration items and traditional specialties, which come from all villages and countryside of Vietnam.
1.6 THE STRUCTURE OF THE RESEARCH
The structure of the research includes five chapters: Chapter 1: Introduction
Chapter 2: Literature review Chapter 3: Research methods Chapter 4: Research results
Chapter 5: Conclusion & Recommendation
CHAPTER 2 LITERATURE REVIEW
2.1 SERVICE QUALITY 2.1.1 DEFINITION
The service quality is an issue, which is being concerned by managers in the context of recent business. A product of good quality is not really selected by customers if accompanying services are not rated highly.
Recently, there are some definitions of the service quality, but generally, the service quality is what the customer feels about. Each customer has his or her own perception and individual demand, so his or her feeling about the service quality is also different.
According to Juran (1988) “the quality is suitable with the demand”.
According to Feigenbaum (1991), “the quality is customer’s choice which is based on his or her experience of the service or the product, is measured based on customer’s demand. This demandcould be showed or not showed, could be a perception or a feeling, personal or professional.Moreover, they are always representative of a moving target in a competitive market.”
Russell (1999) defined that “the quality reflects the superiority of goods and service, especially, the level of quality can satisfy all the needs and customers.”
Lehtinen & Lehtinen (1982) suggested that the service quality must be assessed on two aspects, (1) the process of service delivery and (2) the results of the service. Grönroos (1984) also suggested two dimensions of the service quality, such as (1) the technical quality and (2) the functional quality. Technical quality refers to the outcome and the functional quality refers to the manner in which the service is delivered or how it is delivered.
However, perhaps Parasuraman & CTG (1985, 1988) were pioneers in studying the service quality in the marketing in a specific and detailed way. According to Parasuraman & CTG, the service quality is a comprehensive evaluation of attitudes towards the excellence of the service.
2.1.2 CHARACTERISTICS OF THE SERVICE
Service has some characteristics that help to distinguish it from other tangible goods. People recognize somecharacteristics of service as follows:
Intangibility: means the nature that cannot be touched or captured and there is no specific shape as a tangible product.
Heterogeneity: It refers to the difference in the level of service performance. It means
that servicecan be ranked from very poor level to excellent level. The essential issues and service quality may vary depending on the waiter, customer perception and serving time. The variability in service is also likely to occur and occur more frequently than the nonconformity of the tangible products because service has high level of human interaction.
Inseparability: This feature is about the difficulty in distinguishing between how to create the service and how to use it. A service cannot be separated into creating period and using period. They are both happened at the same time.
2.1.3 THE GAP IN THE PERCEPTION ABOUT THE SERVICE QUALITY
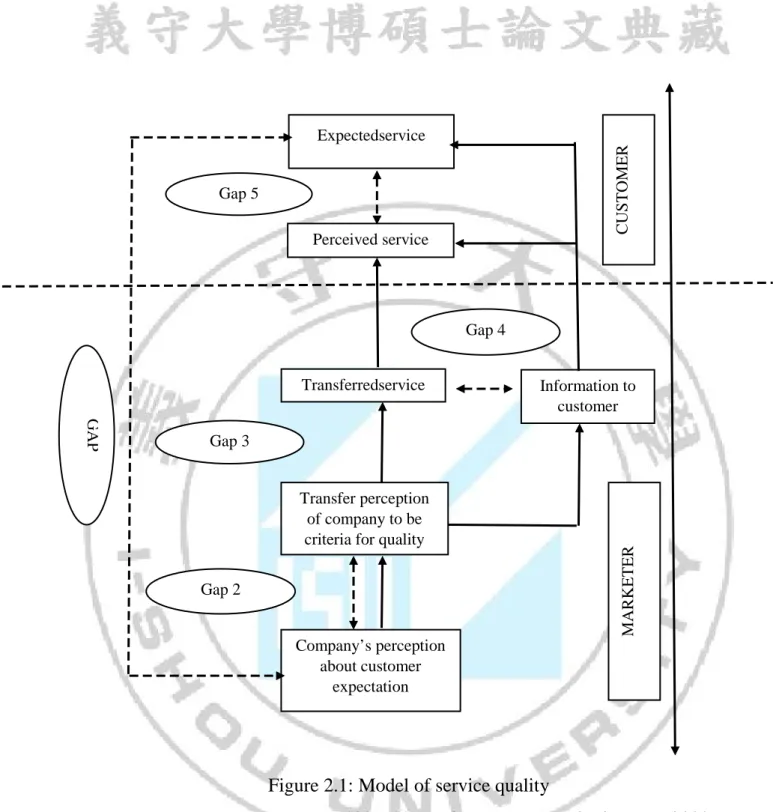
Perceived quality of customers has influence on the comparison between customer expectation of the service and their experience of the service they have received before. However,perhaps Parasuraman & ctg (1985, 1988) are persons who introduced thefive-gapmodelof the service quality, which are approved and applied widely.
Figure 2.1: Model of service quality
(Source: Parasuraman & ctg (1985:44, cited as Nguyen Dinh Thi & ctg 2003)
Gap 1 appears when there is a difference in the customer expectation of service quality and the service administrator perception about customer expectation. The service company does not understand all characteristics of its service quality as well as the transferring manner to customers to make them please. It is the basic of the difference.
Gap 2 shows up when the service company gets trouble to transfer its perception about
Expectedservice
Perceived service
Transferredservice
Transfer perception of company to be criteria for quality
Company’s perception about customer expectation Information to customer M AR KE T ER GAP Gap 5 Gap 3 Gap 2 Gap 4 C U STO M ER 8
customer expectation into characteristics of service quality. In some cases, the company can transfer customer expectation. However, the company does not always transfer these expectations into specific characteristics of servicein line with the expectation of customers. The main reason comes from the professional ability of staffs as well as too much change of the service demand. Sometimes, service demand is too high for the company to afford it.
Gap 3 occurs when service staff cannot transfer the service to customers as defined requirements. In the field of service, staffs can directly contact customers and have the very important role in the process of creating the quality. However, not all staffs can complete the tasks according to these requirements at all times.
For Gap 4, advertisements, media and information also affect the customer expectation of the service quality. All offers from promotion programs or advertisements could increase the expectation of customers, but could decrease the quality perceived by customers if the service is not as exact as what they are offered.
Gap 5 occurs when there is a difference between the expected quality and the perceived quality of customers. The service quality depends on the gap 5.Once customers see no difference between the expected quality and the perceived quality, it is a good service.
Parasuraman & ctg (1985) suggested that the service quality is a function of the gap 5. This gap isdependent on previous gaps (gap 1, 2, 3 and 4). Thus, to shorten the gap 5 or to increase the service quality, service administrations should do the best to make other gaps be shortened. According to researchers, the service quality model could be performed as below:
CLDV= F{KC_5= f (KC_1, KC_2, KC_3, KC_4)
In which, CLDV stands for service quality and KC_12345 is quality gaps 1,2,3,4 and5, respectively.
2.1.4 MEASUREMENT OF THE SERVICE QUALITY
Nowadays, there are many difference measurementscales to measure and value the service quality. These are appropriate for each serviceand all of themshare a common thing that is the expression of the satisfaction level of customers.
However,Parasuraman& ctg (1985) possibly defined factors of the service quality to design a measurement scale. These researchers showed that, in any kind of service, there are 10 factors expressing the service quality through the feeling of customers:
1. Reliability is an ability to implement a suitable and on-time service for the
first time.
2. Responsiveness is the desire and enthusiasm of staffs to provide the service for
customers.
3. Competence is the qualification to do the service. It is necessary for staff when
they directly contact customers, directly implement the service and update the relevant information.
4. Access is to facilitate every conditionfor customers to approach the service
such as making short of waiting time, providing convenient serving place and opening time.
5. Courtesy is friendly, respectful and warm attitude towards customers.
6. Communication refers to the communication, discussion and talking to
customers in a simple way and listening to them to explain the service, the fee and the question.
7. Credibility is an ability to get the trust from customers. This ability is
described through name and reputation of the company and personality of the service personnel who communicate directly with customers.
8. Security is an ability to ensure the safety of customers, which is expressed
through the physical, financial safety and information security.
9. Understanding/knowing the customer expresses the ability to understand the
demand of customers through finding out their requirements, caring and identifying each of individual customers.
10. Tangible isexpressed through looks, outfit of staffs and serving equipment.
This above 10 components model has an advantage that is to cover all features of a service. However, its disadvantage is thecomplicatednessin measuring. Moreover,this model is just theoretical; it can contain some components that do not get differential value. Thus, researchers have tested this model for many times and have concluded that it contains fivebasic components as below:
1. Reliability
2. Responsiveness
3. Competence
4. Empathy
5. Tangibles
2.2 THE SATISFACTION OF CUSTOMERS
The satisfaction is a level of feeling or status of a person, whichcomes from the comparison between the outcome of the service and his or her expectation of the service.
Expectation is the state of expecting of human. It stems from individual demands,
previous experiences and other information such as advertisements, information passes by word of mouthfrom friends, family.
Individual demand stems from human perception to satisfy something ascommunications needs or food needs….
Satisfaction is the reaction of the consumer in measuring the difference between the previous desire(or standards for the service) and the real expression of the product as an acceptance when it is used.
According to Bachelet (1995:81),the definition of customer satisfaction is an emotional reaction responding to their experience about the product or service.
Oliver (1997) referred that the satisfaction is the reaction of consumers to respond expectations. The definition means that the satisfaction is satisfied feeling of consumers for the consumption of a product or a service. It includes the upper and lower responding level of the expectation.
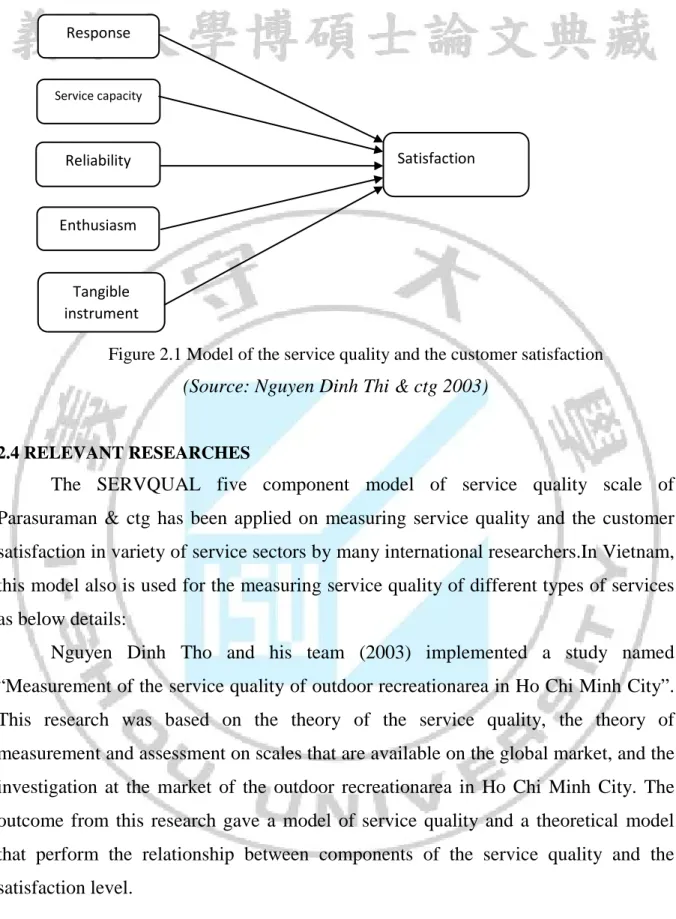
2.3 THE SERVICE QUALITY AND THE CUSTOMER SATISFACTION
There are many different opinions about the level of satisfaction of customers (Oliver 1997). Bachelet (1995:81) defined that the satisfaction of customers is their emotional reaction to their experience about a service or a product.
Servicebusinesspersonssuggest that the service quality is the level of satisfaction of customers. However, there are some researchers say that the service quality and the customer satisfaction are two differentiate definitions (Zeithaml & Bitner 2000). The satisfaction of customers is a comprehensive definition, whichrefers to customer’s pleasure when they have used the service. Otherwise, the service quality only focuses on detailed components of the service (Zeithaml & Bitner 2000). The service quality is relevant to process of service delivery, and the satisfaction only shows up after customers have experienced that service. Thus, when the customer has used the service and had good feeling of the quality, they will be satisfied with that service. On the contrary, bad feeling makes customer unsatisfied.
The theoretical model performed in the Figure 2.1 clearly shows the relationship between components of the service quality and theability to explain of each component for the customer satisfaction.
Figure 2.1 Model of the service quality and the customer satisfaction
(Source: Nguyen Dinh Thi & ctg 2003)
2.4 RELEVANT RESEARCHES
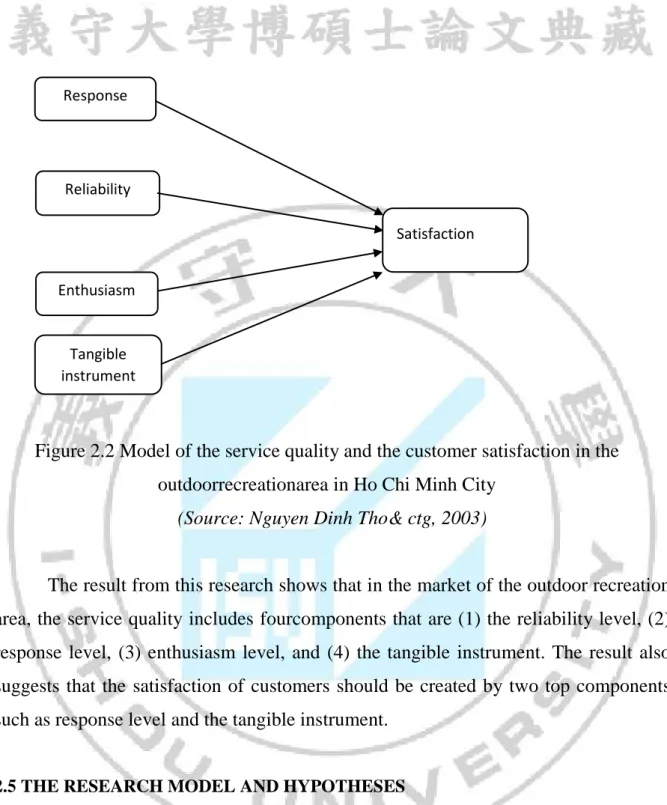
The SERVQUAL five component model of service quality scale of Parasuraman & ctg has been applied on measuring service quality and the customer satisfaction in variety of service sectors by many international researchers.In Vietnam, this model also is used for the measuring service quality of different types of services as below details:
Nguyen Dinh Tho and his team (2003) implemented a study named “Measurement of the service quality of outdoor recreationarea in Ho Chi Minh City”. This research was based on the theory of the service quality, the theory of measurement and assessment on scales that are available on the global market, and the investigation at the market of the outdoor recreationarea in Ho Chi Minh City. The outcome from this research gave a model of service quality and a theoretical model that perform the relationship between components of the service quality and the satisfaction level. Response Service capacity Reliability Enthusiasm Tangible instrument Satisfaction 12
Figure 2.2 Model of the service quality and the customer satisfaction in the outdoorrecreationarea in Ho Chi Minh City
(Source: Nguyen Dinh Tho& ctg, 2003)
The result from this research shows that in the market of the outdoor recreation area, the service quality includes fourcomponents that are (1) the reliability level, (2) response level, (3) enthusiasm level, and (4) the tangible instrument. The result also suggests that the satisfaction of customers should be created by two top components such as response level and the tangible instrument.
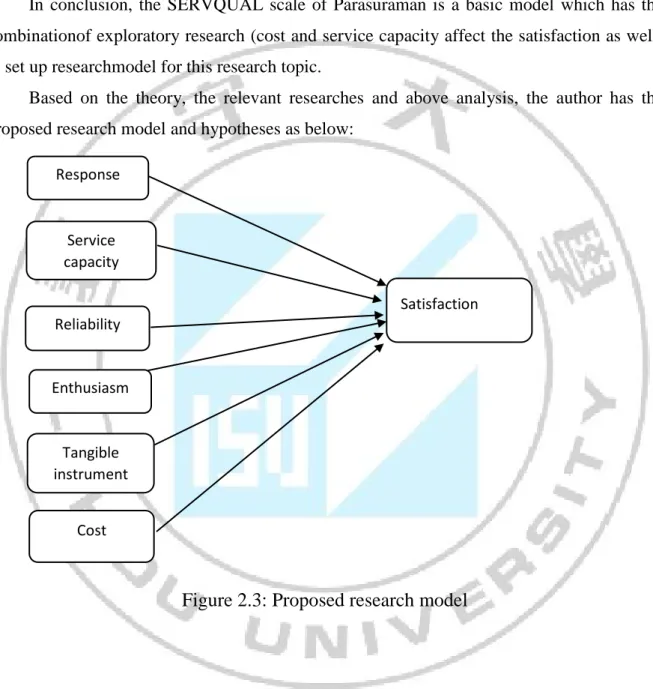
2.5 THE RESEARCH MODEL AND HYPOTHESES
In the service business,the service quality is a very important factor, which strongly affects the satisfaction of customer. One of measurementscales of the service quality approved most by many people is SERVQUAL, which was created in the 1980s by Parasuraman. This is a multidimensional measurement scale. Itcontains five components performed as above: reliability, response, service capacity, enthusiasm and tangible instrument.
This research focuses on testing the theoretical model and hypotheses about the relationship between components of the service quality and the satisfaction of customers
Response Reliability Enthusiasm Tangible instrument Satisfaction 13
when they use the service at the recreation area.
Aside from five basic components in the SERVQUAL scale, according to the exploratory research (through the technique of focus group discussion), the satisfaction of customers has an influence on service “cost”. Thus, this component also is listed in the researchmodel of this research topic.
In conclusion, the SERVQUAL scale of Parasuraman is a basic model which has the combinationof exploratory research (cost and service capacity affect the satisfaction as well) to set up researchmodel for this research topic.
Based on the theory, the relevant researches and above analysis, the author has the proposed research model and hypotheses as below:
Figure 2.3: Proposed research model
Response Service capacity Reliability Enthusiasm Tangible instrument Satisfaction Cost 14
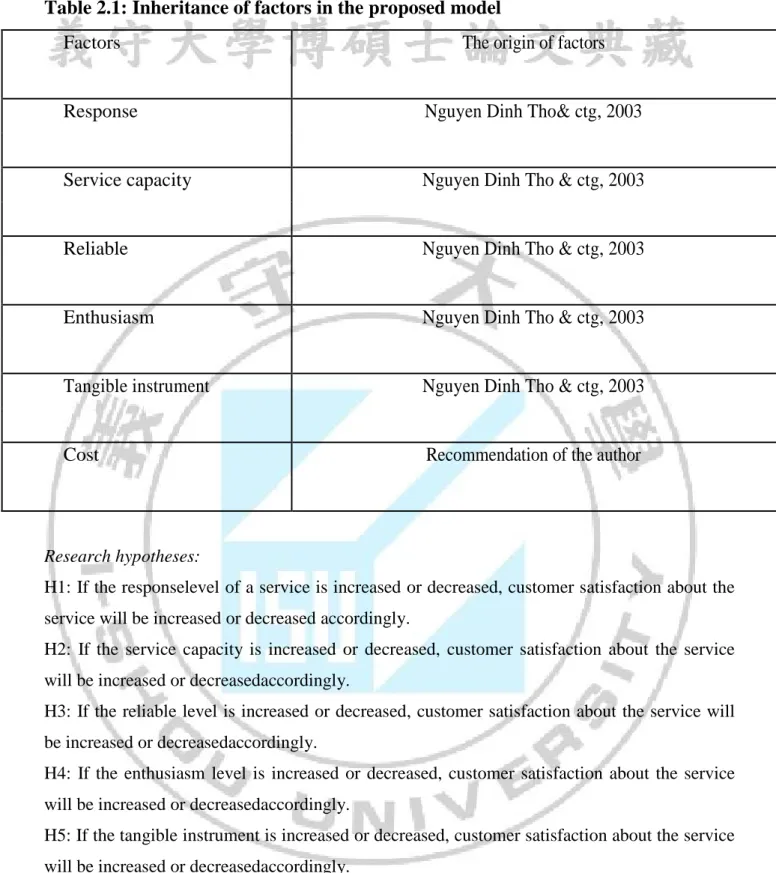
Table 2.1: Inheritance of factors in the proposed model
Factors The origin of factors Response Nguyen Dinh Tho& ctg, 2003 Service capacity Nguyen Dinh Tho & ctg, 2003 Reliable Nguyen Dinh Tho & ctg, 2003 Enthusiasm Nguyen Dinh Tho & ctg, 2003 Tangible instrument Nguyen Dinh Tho & ctg, 2003 Cost Recommendation of the author
Research hypotheses:
H1: If the responselevel of a service is increased or decreased, customer satisfaction about the service will be increased or decreased accordingly.
H2: If the service capacity is increased or decreased, customer satisfaction about the service will be increased or decreasedaccordingly.
H3: If the reliable level is increased or decreased, customer satisfaction about the service will be increased or decreasedaccordingly.
H4: If the enthusiasm level is increased or decreased, customer satisfaction about the service will be increased or decreasedaccordingly.
H5: If the tangible instrument is increased or decreased, customer satisfaction about the service will be increased or decreasedaccordingly.
H6: If the customer perception about the reasonableness of service cost is increased, customer satisfaction about the service will increase as well.
CHAPTER 3 RESEARCH METHODOLOGY
3.1 RESEARCH DESIGN
As mentioned in Chapter 1, this research is conducted through two main steps: (1) preliminary research, and (2) formal research.
Preliminary research is conducted through qualitative method using the technique of group discussion and plays a role as customers using this service. The purpose of qualitative research is to adjust and supplement the observed variables used to assess the concepts of research. Ten customers who use service in this entertainment park are selected for discussion. This deliberative process is conducted in August 2015 (Appendix 1).
Formal research is conducted though quantitative method.The method of quantitative research is conducted through the direct interview with clients and is used to test the measurement model, theoretical model and hypothesesin the model. This research is conducted in Nha Trang in September 2015.
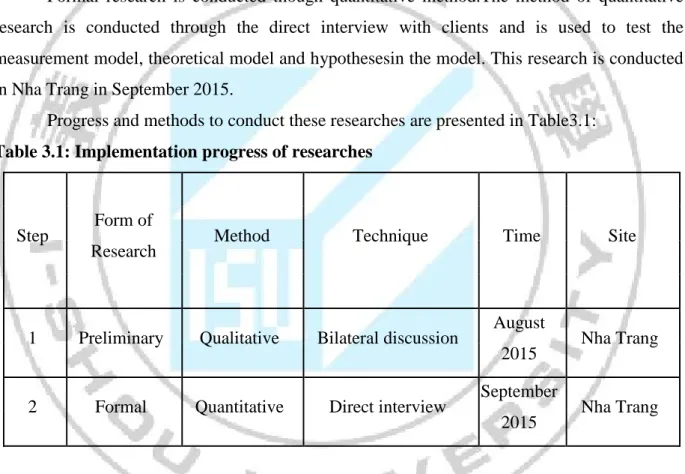
Progress and methods to conduct these researches are presented in Table3.1:
Table 3.1: Implementation progress of researches
Step Form of
Research Method Technique Time Site
1 Preliminary Qualitative Bilateral discussion August
2015 Nha Trang
2 Formal Quantitative Direct interview September
2015 Nha Trang
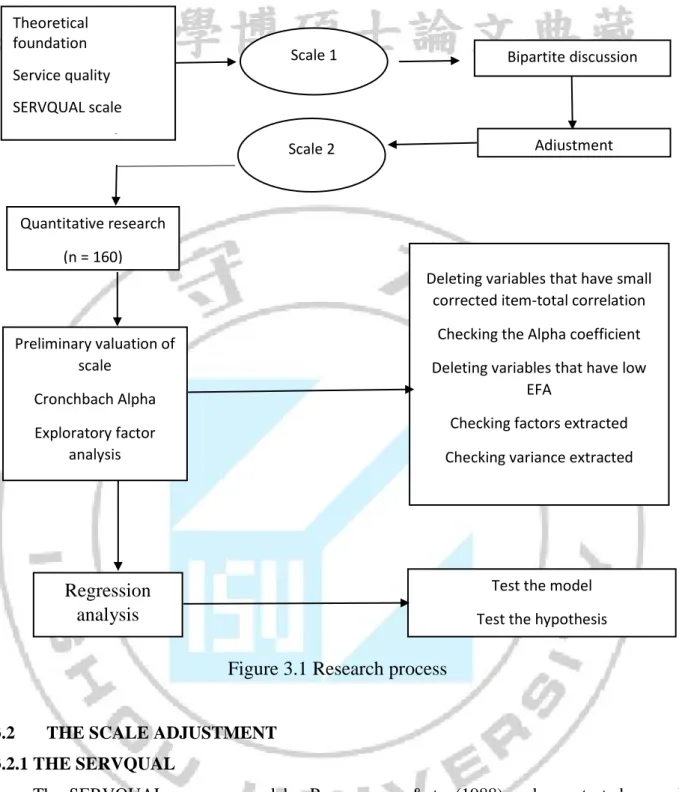
The process of research is presented in the figure below. This process consists of three main parts: (1) building scales, (2) assessing scales, (3) verifyingthe model of research.
The scales are based on the foundation of the theory on service quality, the theory of available scales, namely the SERVQUAL scale (Parasuraman & CTG. 1988) and the theory on customer satisfaction. However, due to the characteristics of each service sector and differences in culture and economic development of each region, the scale is not appropriate for the characteristics of entertainment service in Vietnam market. Therefore, it is necessary to conduct the qualitative research to adjust the scale accordingly.
To adjust the SERVQUAL scale, this research uses the qualitative method withthe technique of bilateral discussion for 10 customers who used service in this entertainment park to self-evaluate this service quality. Based on the research result of the scale 1 (SERVQUAL), it will be adjusted for the scale 2.
The scale 2 is used for formal research. Quantitative research is used for formal research with the technique of direct interview with customers. This official research is conducted to test the model of the scales and theoretical models. The scale is preliminarily evaluated by Cronbach alpha reliability coefficient and exploratoryfactor analysis EFA.
Figure 3.1 Research process
3.2 THE SCALE ADJUSTMENT 3.2.1 THE SERVQUAL
The SERVQUAL was proposed by Parasuraman &ctg (1988) and was tested several times by this author. It is widely used to measure service quality. After many times of testing, finally the SERVQUAL includes 21 observed variables used to measure fivecomponents of service quality, namely: (1) Reliability, (2) Responsiveness, (3) Competence, (4) Empathy, (5) Tangibles.
The SERVQUALscale quite completely covers all matters of a service. However, each particular service sector has its own characteristics. The entertainment service in Nha Trang
Quantitative research (n = 160) Preliminary valuation of scale Cronchbach Alpha Exploratory factor analysis Bipartite discussion Adjustment
Deleting variables that have small corrected item-total correlation
Checking the Alpha coefficient Deleting variables that have low
EFA
Checking factors extracted Checking variance extracted
Test the model Test the hypothesis Scale 1 Scale 2 Regression analysis Theoretical foundation Service quality SERVQUAL scale i f i 18
also has its own ones. Therefore, the scalemay not be appropriate for this market. Therefore, it is necessary to adjust and supplement appropriateobservations to Nha Trang market.
The scale was adjusted and supplemented according to the research by Nguyen Dinh Tho&ctg (2003: 23). The scale consists of 24 observed variables used to measure five components of service quality, namely: (1) Reliability, (2) Responsiveness, (3) Competence, (4) Empathy, (5) Tangibles.
During the investigation process of discovering new factors, the author found that cost variable also affected customer satisfaction, so this scale would be added two new observed variables to cost component, which were: “Price fittingservice quality”, and “Compared to
other amusement parks, cost at this amusement park is more reasonable”.
After the adjustment and supplement of new observations and adjustment of old observations, the service quality scale of Vinpearl Land amusement parks includes 26 observed variables that measures its six components. The reliability component is measured by four observed variables. The responsiveness component is measured by fourobserved variables. The
competence component is measured by fourobserved variables. The empathy component is
measured by twoobserved variables. The tangibles component is measured by 10 observed variables. Finally, the cost component is measured by twoobserved variables. They arepresented by six main contents (I, II, III, IV, V and VI) in the questionnaire of quantitative research (see Appendix 2).
3.2.2 MEASUREMENT OF CUSTOMER SATISFACTION
In Chapter 2, the author mentioned the service quality and customer satisfaction. For service business, these two concepts are often equated but to the researchers, they are two completely different concepts. Customer satisfaction is a general concept;it presents their satisfaction when they consume a service. Meanwhile, the service quality only focuses on specific components of service (Zeithaml & Bitner 2000). Therefore, in this research, customer satisfaction is measured by the overall satisfaction of customers to service.
The measurement scale of customer satisfaction used in this research is based on measurement scales of Hayes (1994), including three observed variables: interview clients for their overall satisfaction to the service, to the service manner and to the equipment of the amusement parks. It is presented by a main content (VII) in the questionnaire of quantitative research (see Appendix 2).
3.3 FORMAL RESEARCH
After being adjusted and supplemented through qualitative research, the scales would be further assessed through quantitative research (formal research) at Vinpearl Land.The target
research subject is customers who used serviceof this amusement park.
Sample was selected by method of convenience with size of 160. This research selected sample size as ratio of 5: 1 and in model of theory, there were 32 parameters needed to be estimated, so minimum size of sample was 32x5 = 160. To achieve that minimum sample, 170 questionnaires must be handed out.
During the investigation and strict control on questionnaires collected, there only 160 questionnaires were qualified, and remaining 10 questionnaires were excluded due to the blanks and loss. Finally, 160 completed questionnaires were used. Data was entered and screened through SPSS.
Among 160 qualified questionnaires, 83 respondentswere male (accounting for 51.9% of the sample size); the remaining 77 were female (accounting for 48.1% of sample size). Regarding income, 63 respondents had average monthly income per capita under three million VND, representing 39.4% sample size. Fifty-one customers had the monthly income per capita in the range of three million to five million VND, representing 31.9% of sample size. Income per capita in the range of five to seven million VND was 31 customers, representing 19.4% of sample size. The remaining 15 customers had income per capita of over seven million VND per month. Specifically, there were 88 out of 160 customers came from other provinces, accounting for 55% of the sample size. The remaining 77 customers was in the province, accounting for 45% of the sample size.
3.4 SUMMARY
This Chapter demonstrates the research method performed to evaluate the measurement scales of constructs and theoreticalmodel of service quality and customers satisfaction. Research method is performed through two steps that are preliminary research and formal research.
Preliminary research in this Chapter was performed through bilateral discussion with 10 customers who used services in this recreation area. Formal research is a quantitative research performed by direct interview technique through the quantitative research questionnaire with 160 customers. The scale of components of service quality is adjusted and supplemented. Finally, the scale comprises two measured variables of five components of service quality and three observed variables to measure the customer satisfaction. This Chapter concurrently describes information of sample of formal research. The next Chapter will illustrate the results of research including the scale verification and research model.
CHAPTER 4 RESEARCH RESULTS
4.1 INTRODUCTION
Chapter 3 has presented the method to perform the research. The objective of Chapter 4 demonstrates the testing results of the models of scale and the research model as well as the hypotheses in the model. There are three main parts in this Chapter: the preliminary results of the scale introduced at first, the results of re-confirmed reliability of the scale and the results of testing theoretical model.
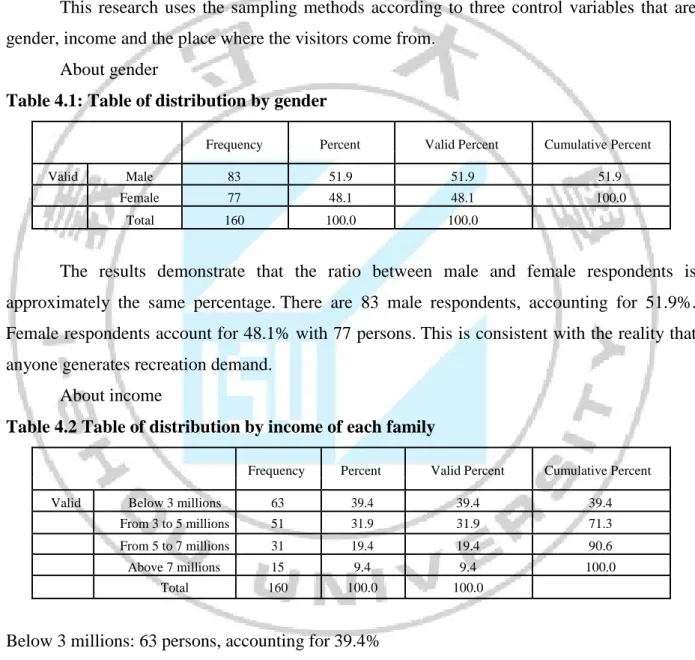
4.2 SAMPLE DESCRIPTION
This research uses the sampling methods according to three control variables that are gender, income and the place where the visitors come from.
About gender
Table 4.1: Table of distribution by gender
Frequency Percent Valid Percent Cumulative Percent Valid Male 83 51.9 51.9 51.9
Female 77 48.1 48.1 100.0 Total 160 100.0 100.0
The results demonstrate that the ratio between male and female respondents is approximately the same percentage. There are 83 male respondents, accounting for 51.9%. Female respondents account for 48.1% with 77 persons. This is consistent with the reality that anyone generates recreation demand.
About income
Table 4.2 Table of distribution by income of each family
Frequency Percent Valid Percent Cumulative Percent Valid Below 3 millions 63 39.4 39.4 39.4
From 3 to 5 millions 51 31.9 31.9 71.3 From 5 to 7 millions 31 19.4 19.4 90.6 Above 7 millions 15 9.4 9.4 100.0
Total 160 100.0 100.0
Below 3 millions: 63 persons, accounting for 39.4%
From 3 millions to 5 millions: 51 persons, accounting for 31.9% From 5 millions to 7 millions: 31 persons, accounting for 19.4% Above 7 millions: 15 persons, accounting for 9.4%
About whether the customers are in or outside the province
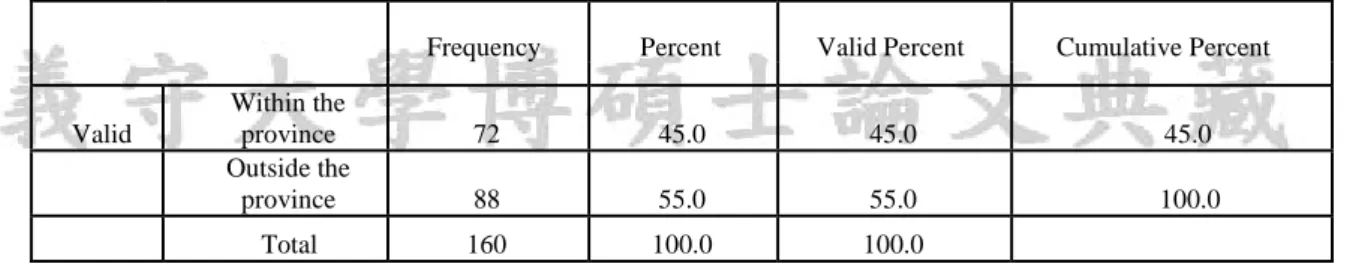
Table 4.3 Statistics table of visitors from within the province or from outside the province
Frequency Percent Valid Percent Cumulative Percent Valid Within the province 72 45.0 45.0 45.0 Outside the province 88 55.0 55.0 100.0 Total 160 100.0 100.0
We find that the number of visitors from outside the province is much more than that of local visitors. In the province, there are 72 people, accounting for 45%, while those from outside the province are 88 people, accounting for 55%. It is easy to understand because the visitors from outside the province often go by the delegation with the big number; thus, the discount is higher than that in the region.
4.3 DATA CLEANING
After collecting data, the author designs, encodes and inputs data via software SPSS (Statistical Package for the Social Sciences), then proceeding to clean it. The reason is that data is collected after removing many blank and invalid questionnaires. Then, the data was input primarily. In the process of implementing the survey, commonly, samples were different, flawed or not consistent. Some models have the wrong, omissions occurring in the process of data input. Therefore, it is needful to conduct data cleaning to ensure requirement and data put into analysis must be adequate and consistent. Accordingly, data analysis will help the author bring the correct information with the high reliability.
Methods: frequency table is used to review all the observed variables in order to discover the information bias or omissions by software SPSS.
The results: after using the method of frequency table, the results show the full data in all variables.
In the combination of review of all observed variables over the frequency table, the authordoes not find any variable of information bias; the data was cleaned to move to the step of scale testing.
4.4 PRELIMINARY ASSESSMENT ON SCALE
In the introduction of Chapter 3, the scale of customer satisfaction with the quality of services includes six major components: (1) the reliability, measured by four observed variables, denoted by v1 to v4; (2) the response, measured by four observed variables, denoted by v5 to v8; (3) service capacity, measured by four observed variables, denoted by v9 to v12; (4) the empathy, measured by two observed variables, denoted by v13 to v14; (5) the tangible facilities, measured by 10 observed variables, denoted by v15 to v24; (6) the cost, measured by two observed variables, denoted by v25 to v26. Scale of the general level of
satisfaction is measured by three observed variables, denoted by v27 to v29.
Scale used to assess the satisfaction of the customers is the 5 point Likert scale (level of satisfaction will increase from 1 to 5, from a strongly disagree to strongly agree).
Scales are preliminary evaluated through the two main tools that are the reliability of Cronbach’s alpha coefficient and exploratory factor analysis EFA. Cronbach’s alpha coefficient is used to remove the unwanted variables. The variables having item total correlation less than .30 will be removed and the standard to choose scale is that the alpha reliability is .60 or above (Burnstein 1994).
Next is the exploratory factor analysis EFA. Exploratory factor analysis is a quantitative analysis used to shorten a set consisting of multiple interdependent observed variables into a set of fewer variables (called factors) in order to make more significance. However, it still contains most of the information content of the original set of variables (Hair et al., 1998). The factor loading less than 0.40 in the EFA will be removed. The extraction methods used are the Principal component with Varimax rotation. When extracting the factors, the cut-point is the Eigenvalue = 1 (Anderson & Gerbing, 1988). Scales are only accepted when the total of variance extracted is greater than or equal to 50%, provided that KMO indicator >= 0.5. KMO indicator is used to consider the suitability of the EFA; if the KMO indicator is in the range of 0.5 ≤ KMO ≤ 1, the factor analysis is suitable.
According to Hair et al., (1998), the factor loading is to ensure the level of practical significance of EFA. Factor loading > 0.30 is considered the minimum level while the factor loading > 0.40 is considered important and the factor loading > 0.50 is considered the practical significance. Hair et al., (1998) also argued that if the factor loading > 0.30 is the standard selection, then the sample size ≥ 35. In case sample size is about 100, the factor loading > 0.50 should be selected. In case of sample size of about 50, then the factor loading must > 0.75.
Bartlett’s test examines the hypothesis Ho: the correlation between observed variables has no overall correlation. If this test has the statistical significance (Sig <.005), then theobserved variables are correlated with each other generally (Trong & Ngoc, 2005).
4.5 CRONBACH’S ALPHA RELIABILITY COEFFICIENT 4.5.1 Scale of factors that affect users
4.5.1.1 Evaluation of the scale of “reliability” component
The component of reliabilityhas Cronbach’s Alpha of 0.7786 (> 0.6). Corrected item-total correlation of variables measuring this component is all greater than standard of 0.3. Besides, alpha if item deleted of the variables are all less than the Cronbach’s alpha coefficient. Therefore, these variables are used in the EFA.
4.5.1.2 Evaluation of the scale of “response” component
The component of response has Cronbach’s Alpha of 0.7818 (> 0.6). Corrected Item-Total Correlation of the measurement components are in line with the standard (greater than the standard of 0.3). Besides, alpha if item deleted of the variables are all less than the Cronbach’s alpha coefficient. These variables are used in the EFA.
4.5.1.3 Evaluation of the scale of “service capacity” component
The component of service capacity has a Cronbach’s alpha of 0.8289 (> 0.6). Corrected Item-Total Correlation of the measurement components is greater than standard of 0.3). Besides, alpha if item deleted of the variables are all less than the Cronbach’s Alpha coefficient. Therefore, these variables are used in the EFA.
4.5.1.4 Evaluation of the scale of “empathy” component
The component of empathy has Cronbach’s alpha of 0.8051 (> 0.6). Corrected Item-Total Correlation of the measurement components is greater than standard of 0.3). Both variables have an equal corrected item-total correlationof 0.6750. Alpha if item deleted of the variables are all less than the Cronbach’s alpha coefficient. Thus, both variables are used in the EFA.
4.5.1.5 Evaluation of the scale of “tangible facilities” component
The component of tangible facilities has Cronbach’s Alpha of 0.8563 (> 0.6). We see that corrected item-total correlationof the components reach standard (greater than standard of 0.3). However, in variable v24, alpha if item deleted is 0.8590 that is greater than Cronbach’s alpha. Thus, we remove v24. It means that when we remove thisvariable, the reliability of the scale increases from 0.8563 to 0.8590. We perform the second scale testing.
Therefore, after removing the variable v24, the Cronbach’s Alpha of the tangible facilities component is 0.8590 (> 0.6). Corrected item-total correlation of the measurement components meet standard (greater than standard of 0.3). Alpha if item deleted of the variables are less than the Cronbach’s alpha coefficient. Thus, these variables are used in the EFA.
4.5.1.6 Evaluation of the scale of “cost” component
The component of cost has Cronbach’s alpha of 0.8203 (> 0.6). Corrected Item-Total Correlation of scales is equal to 0.6961 which reach the standard (greater than standard of 0.3). In addition, alpha if item deleted of the variables are all less than the Cronbach’s Alpha coefficient. Thus, the variables are used in the EFA.
4.5.2 Scale of customer satisfaction
Cranach coefficient of the scale of customer satisfaction is satisfied with 0.7827 (> 0.6). Furthermore, corrected item-total correlation of variables measuring the concept also reach the
standard that is greater than 0.30. Besides, alpha if item deleted of the variables are all less than the Cranach’s alpha coefficient. Therefore, these variables were used in the EFA.
In brief:
Through Cranach’s Alpha analysis of the scales of customer satisfaction with Impearl land, we have the following scale:
Regarding the reliability scale, it includes four observe red variables v1, v2, v3, v4 (Cronbach’s Alpha = 0.7786)
Regarding the response scale, it consists of four observed variables v5, v6, v7, v8 (Cronbach’s Alpha = 0.7818)
Regarding the service capacity scale, it includes four observedvariables v9, v10, v11, v12 (Cronbach’s Alpha = 0.8289)
Regarding the empathy scale, it includes two observed variables v13, v14 (Cronbach’s Alpha = 0.8051)
Regarding the scale of tangible facilities, it includes 10 observed variables v15, v16, v17, v18, v19, v20, v21, v22, v23 and v24 (Cronbach’s Alpha = 0.8590)
Regarding the scale of cost, it includes two observed variables v25 and v26 (Cronbach’s Alpha = 0.8203)
Regarding the satisfaction scale, it consists of three variables v27, v28, v29 (Cronbach’s Alpha = 0.7827)
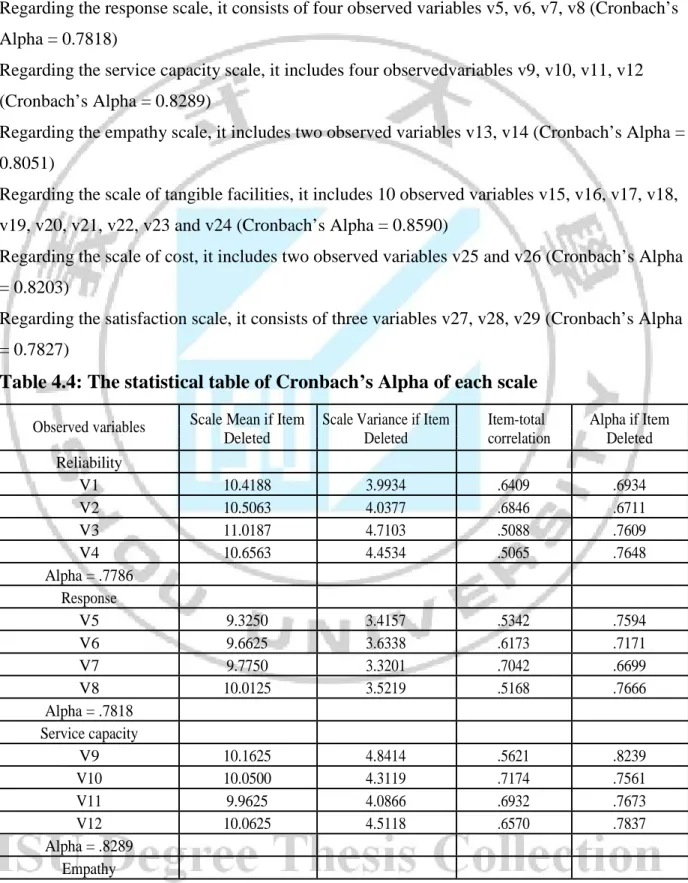
Table 4.4: The statistical table of Cronbach’s Alpha of each scale
Observed variables Scale Mean if Item Deleted
Scale Variance if Item Deleted Item-total correlation Alpha if Item Deleted Reliability V1 10.4188 3.9934 .6409 .6934 V2 10.5063 4.0377 .6846 .6711 V3 11.0187 4.7103 .5088 .7609 V4 10.6563 4.4534 .5065 .7648 Alpha = .7786 Response V5 9.3250 3.4157 .5342 .7594 V6 9.6625 3.6338 .6173 .7171 V7 9.7750 3.3201 .7042 .6699 V8 10.0125 3.5219 .5168 .7666 Alpha = .7818 Service capacity V9 10.1625 4.8414 .5621 .8239 V10 10.0500 4.3119 .7174 .7561 V11 9.9625 4.0866 .6932 .7673 V12 10.0625 4.5118 .6570 .7837 Alpha = .8289 Empathy 25
V13 2.9812 .5720 .6750 . V14 3.0562 .6446 .6750 . Alpha = .8051 Tangible facilities V15 29.5500 22.6013 .5901 .8439 V16 29.5625 21.3797 .7347 .8300 V17 29.8125 21.8640 .6168 .8408 V18 29.5625 22.9898 .5343 .8487 V19 29.8813 22.2814 .4924 .8541 V20 29.7500 22.0252 .6407 .8389 V21 29.9500 21.9849 .5953 .8429 V22 29.6438 21.7402 .5592 .8471 V23 29.5875 29.5875 .5339 .8497 Alpha = .8590 Costs V25 3.1000 1.1597 .6961 . V26 3.1750 1.0509 ,6961 . Alpha = ,8203
4.6 EXPLANATORY FACTOR ANALYSIS EFA
The variables which are acceptable in the analysis of Cronbach’s alpha have been used in the EFA. The KMO indicator (Kaiser - Meyer - Olkin Measure of Sampling Adequacy) is used to analyze the appropriateness of the factor analysis. The analysis is only used when the KMO has the value greater than 0.5.
4.6.1 The scale of factors that impact the customer satisfaction
The results of EFA for the first time show that there are seven factors extracted in Eigenvalue of 1.012 and the variance extracted is 69.365% with the KMO of 0.859. Therefore, the factor analysis is appropriate. However, the largest factor loading of two observed variables v21 and v4 are less than 0.50. Thus, these variables do not satisfy the above criteria. We should individually remove the two variables instead of removing observed variable at the same time (Nguyen Trong Hoai et al., 2008). Any variable with the largest factor loading but not reaching the highest value will be eliminated firstly. The largest factor loading of v4 is 0.45 and v21 is 0.473. We remove the variable v4 firstly.
The results of EFA for the second time demosntrate that after removing the variable v4, the EFA extracted seven factors in Eigenvalue of 1.004 and variance extracted as 70.405% with KMO indicator of 0.858. Thus, the factor analysis is appropriate and the variance extracted satisfies the requirement (> 50%). However, the largest factor loading ofobserved variable v21 is less than 0.50. The largest factor loading of v21 is 0.473. We remove V21 and conduct the third analysis.
The results of the EFA analysis for the third time: after removing the variables v21, the EFA extracted six factors in Eigenvalue of 1.039 and variance extracted as 67.211% with KMO indicator of 0.851. Thus, the factor analysis is appropriate and the variance extracted reaches the requirement (> 50%). However, the largest factor loading of observed variable v19 is less than 0.50. The largest factor loading of v19 is 0.461. We continue to remove v19 and conduct the analysis for the forth time.
The results of the EFA for the forth time: after removing the variable v19, EFA extracted six factors in Eigenvalue of 1.028 and the variance extractedas 68.281% with KMO indicator of 0.843. Therefore, the analysis of factors is appropriate and the extracted variance reaches the requirement (> 50%). However, the largest factor loading of three observed variables v3, v6, v8 are less than 0.50. The largest factor loading of v3 is 0.444; less than the two remaining factors. We prefer removing the variable v3.
The results of the EFA for the fifth time: after removing the variable v3, the EFA extracted six factors in Eigenvalue of 1.028 and the extracted variance as 69.864% with KMO indicator of 0.842. Thus, the factor analysis is appropriate and the extracted variance reaches the requirement (> 50%).However, the largest factor loading of v8 is less than 0.50. The largest factor loading of v8 is 0.491. We continue to remove v8 and conduct the analysis for the sixth time.
The results of the EFA for the sixth time: after removing the variable v8, then EFA extracted six factors in Eigenvalue of 1.028 and the extracted variance as 70.893% with KMO indicator of 0.834. Thus, the factor analysis is appropriate and the extracted variance reaches the requirement (> 50%). The largest loading factor of observed variables is greater than 0.50. The EFA is completed because it achieves statistically reliability. (See Appendix 3)
Table 4.5: The final result of the EFA of the customer satisfaction
Observed variables Factors
Symbol Content 1 2 3 4 5 6
v12 Staffs in the recreation area have
considerate attitude towards you .745
v11
Guidances of staffs help you feel secure .728
v10 Service manner of staffs in the recreation
area makes you feel reliable .698
v9 Staffs in the recreation area have thorough
knowledge to answer your questions .692
v7 Staffs in the recreation area serves you
extremely enthusiastically .521
v17
The recreation area has appealing equipment
.824
v16
The recreation area has modern equipment
.816
The architectural structures in the
recreation area are attractive .723 v20
v18
The recreation area has many fascinating games
.722
v23
The recreation area is very clean
.763
Guidance board about recreation area is so
clear .745
v22
v15 Service personnel on recreation area have
courteous costume .725
Staffs of the recreation area are willing to help you
v5 .500
The recreation area provides service on
time as promised .829
v2
v1 The recreation area exactly executes the
programs as introduced .813
v6 Staffs of the recreation area serves you .510 quickly
v13 The recreation area understands your
demands .855
v14 The recreation area is always interested in
all of your demands .850
v25 The prices is suitable to the service quality .886
v26 Compared with other recreation area. the .827
cost in this recreation is more reasonable
Eigenvalues 7.371 1.902 1.338 1.309 1.231 1.028
Variance 36.857 9.509 6.689 6.543 6.157 5.138
Cronbach Alpha .8438 .8396 .7802 .7550 .8051 .8203
Calculating Cronbach’s Alpha coefficients for new extracted factors:
Despite previously testing scale, several variables have been removed in the EFA. Therefore, the recalculation of Cronbach’s Alpha is essential. Analyzing results are as follows:
Cronbach Alpha factor 1:
This scale has a Cronbach’s Alpha coefficient = 0.8438 (> 0.60), the corrected item-total correlationof variables measuring this component are high (> 0.30). Thus, the scale is reliable to be used for subsequent analysis.
Cronbach Alpha factor 2:
This scale has a Cronbach’s Alpha coefficient = 0.8396 (> 0.60), the corrected item-total correlationof variables measuring this component are high (> 0.30). Thus, the scale is reliable to be used for subsequent analysis.
Cronbach Alpha-factor 3:
This scale has a Cronbach’s Alpha coefficient = 0.7802 (> 0.60), the corrected item-total correlationof variables measuring this component are high (> 0.30). Thus, the scale is reliable to be used for subsequent analysis.
Cronbach Alpha factor 4:
This scale has a Cronbach Alpha coefficient = 0.7550 (> 0.60), the corrected item-total correlationof variables measuring this components are high (> 0.30). Thus, the scale is reliable to be used for subsequent analysis.
Cronbach Alpha factor 5:
This scale has Cronbach’s alpha coefficient = 0.8051 (> 0.60), the corrected item-total correlationof variables measuring this component are high (> 0.30). Thus, this scale is reliable to be used for subsequent analysis.
Cronbach Alpha factor 6:
This scale has Cronbach’s alpha coefficient = 0.8203 (> 0.60), the corrected item- total correlationof variables measuring components are high (> 0.30). Thus, this scale is reliable to be used for subsequent analysis.
Explaining factors after analyzing EFA:
The first factor consists of4 observed variables
V12 Staffs in the recreation area have considerate attitude towards you V11 Guidances of staffs help you feel secure
V10 Service manner of staffs in the recreation area makes you feel reliable
V9 Staffs in the recreation area have thorough knowledge to answer your questions V7 Staffs in the recreation area serves you extremely enthusiastically
The above variables mostly belong to the factor of the service capacity. They are related to the attitude and service manner of the staffs of the recreation area. We still call this first factor “service capacity” because it reflects quite clearly the observed variables.
The second factor consists of 4 observed variables
V17 The recreation area has appealing equipment V16 The recreation area has modern equipment
V20 The architectural structures in recreation area is attractive V18 The recreation area has many fascinating games.
The observed variables belong to the factor of tangible facilities. These variations are related to the physical equipment in the recreation area. We call this second factor “tangible
facilities” because it reflects clearly the information of these variables. The third factor consists of 4 observed variables
V23 The recreation area is very clean
V22 Guidance board about recreation area is so clear
V15 Service personnel on recreation area have courteous costume V5 Staffs of the recreation area are willing to help you
These variables belong to the factors of tangible facilities and response. They are related to the image of the area, so we call this factor “image”, because it reflects fairly the full information of the observations.
The fourth factor consists of 3 observed variables
V2 The recreation area provides service on time as promised
V1 The recreation area exactly executes the programs as introduced V6 Staffs of the recreation area serves you quickly
The observed variables belong to the factor of reliability. It is related to the commitment to implementing the programs of entertainment for their customers and the reliability of customers with this recreation area. We call this factor “reliability” because it reflects quite clearly this observation.
The fifth factor includes two observed variables
V13 The recreation area understands your demands
V14 The recreation area is always interested in all of your demands
These variables belong to the factor of empathy. It is related to the level of interest of customers in the area. We still call this factor “reliability” because it reflects quite clearly this observed variables.
The sixth factor consists of 2 observed variables:
V25 The price is suitable to the service quality
V26 Compared with other recreation area. the cost in this recreation is more reasonable Two factors belong to the factor of cost. It reflects the cost that customers must pay when coming this recreation area. This factor is called “cost’".
4.6.2The scale measuring thecustomer satisfaction
After the analysis EFA of the satisfaction scale, we extract one factor at Eigenvalues of 2.103.
Through analysis, we found only one factor extracted, the variables have factor loading greater than 0.5; thus, the variables are important in the factor of the customersatisfaction.
KMO indicator = 0.628, the significance level of Bartlett’s test is .000. The extracted variance is 70.08%. Therefore, the EFA is suitable. These variables are satisfactory and they are used in the subsequent analysis.
4.7 ADJUSTING THE RESEARCH MODEL
According to the results of the EFA, we discover that there are six factors drawn from 20 statements rearranged in Table 15. The factors are renamed as follows: (1) Service Capacity (ATS), (2) Tangible Facilities (TM); (3) Image (I); (4) Reliability (R); (5) Empathy (E); (6) Costs (C); (7) Customer satisfaction (CS). Therefore, the theoretical modelmust be adjusted for
the performance of the next tests. Research model is adjusted as in Figure 4 and the research hypotheses also change according to the adjusted model. Particularly:
Adjusted research hypotheses:
H1: When service capacity of staffs in recreation area is evaluated highly or lowly by customers, their level of satisfaction with that service is also increased or decreased accordingly.
H2: When tangible facilities of one service is evaluated highly or lowly by customers, their satisfaction level for that service is also increased or decreased accordingly. H3: When the image of recreation area is evaluated highly or lowly by customers, their satisfaction level is also increased or decreased accordingly.
H4: When reliability level of customers for one service is evaluated highly or lowly, their satisfaction level is also increased or decreased accordingly.
H5: When the empathy of customers for one service is evaluated highly or lowly, their satisfaction level is also increased or decreased accordingly.
H6: The higher perception of customer about the appropriateness of the service price is, the more higher their satisfaction with service is.
Figure 4.1 : The adjusted theoretical model Generalized regression equation is constructed as follows:
SHL = β0+ β1*PTHH + β2*KNPV + β3*HA + β4*CP * + β5*TCAY + β6* DCAM
Of which:
SHL: customer satisfaction (dependent variable) KNPV: service capacity(independent variable) PTHH: tangible facilities (independent variable) HA: image (independent variable)
TCAY: reliability (independent variable) DCAM: empathy (independent variable) CP: cost (independent variable)
4.8 PERFORMANCE OF SOME TESTS
4.8.1Correlation analysis and linear regression analysis 4.8.1.1 Considering the correlation coefficient matrix (r)
Statistical results showed that there is not the linear correlation between scales of the customer satisfaction within research model (Appendix 6). Thus, there is not
Service Capacity Tangible Facilities