掌指關節軸向受力時之關節內負壓對關節穩定度的貢獻
78
0
0
全文
(2) II.
(3) 中文摘要 關節內負壓在關節內提供關節被動穩定度。但相對於大關節,掌指關節的 關節內壓至今沒有完整被研究。在手持式產品日益增加下,手部關節內壓相關 研究的重要性也隨之增加。關節體積受限效應(limited joint volume effect)是通 常用來描述關節內壓提供滑液囊關節穩定度的現象。但是目前關節內壓與關節 體積變化的相關性還沒被量化。本研究的目的為探討關節內負壓在掌指關節受 到軸向力時關節內負壓對關節穩定度的貢獻。此外也要量化掌指關節受到牽張 力時關節內壓與關節體積改變的相關性。. 本研究的樣本為新鮮的掌指關節。發展出一個可裝置於微電腦斷層掃描儀 的自製負載裝置去量測在掌指關節受軸向牽張力時的位移,與經由斷層掃描影 像量測關節體積的改變。然後每個樣本在關節囊完整(intact)與通氣(vented)時, 也在材料試驗機上施與負載。最大的牽張負載力為 16 公斤。此外負載、位移、 牽張力負載關節內壓等資料由材料試驗機與壓力感測器獲得。關節內壓與負載、 位移、關節總體積改變(total volume)、頸縮體積(necking volume)等參數進行相 關性分析。根據實驗建立一個有限元素模型,探討關節內壓的存在與否對掌指 關節的影響。模擬後關節囊變形的結果再與實驗中相同牽張力下微電腦斷層掃 描影像中關節囊形變進行比較。. 將 掌 指 關 節 受到 牽 張 力 的負 載 與 位移 的 曲 線 分成 三 個 區 域: 趾區 (toe-region) , 過 度 區 (transition region)( 以 交 點 (cross-point)表 示 ), 與 終 端 區 (terminal region)。結果顯示關節囊完整與通氣的情況下,在交點的位移量與 16 公斤的位移量兩者均有顯著差異。在關節囊完整與通氣的情況下,交點的位移 量分別為 3.44 ± 0.82 mm 與 4.01 ± 0.81 mm (p < 0.001)。在關節囊完整與通氣. I.
(4) 的情況下,在最大負載 16 公斤時的位移量分別為 4.60 ± 0.80 mm 與 5.22 ± 0.97 mm (p < 0.001)。但在關節囊完整與通氣的情況下,最大 16 公斤時與交點時的 位移差分別為 1.16 ± 0.26 mm 與 1.20 ± 0.33 mm 並無統計上顯著差異(p = 0.112)。且在關節囊完整與通氣的情況下,在終端區的勁度分別為 12.59 ± 2.53 kg/mm 與 12.28 ± 2.70 kg/mm 也沒有統計上的差異(p = 0.124)。此外,在交點 前,關節內壓下降了總量的 45% ~ 80%,此時掌指關節指承受了最大 16 公斤 負載中的前 1-2 公斤。這些結果建議關節內壓在掌指關節受到牽張力時的關節 穩定度貢獻大概在交點前的初始階段。. 關節內壓與關節總體積改變(r = -0.982 ± 0.015)、頸縮體積 (r = -0.951 ± 0.025)、位移(r = -0.963 ± 0.029)均呈現高度(負)線性相關。而關節內壓與負載(r = -0.792 ± 0.151)呈現中度線性相關。此線性相關反映出關節內壓與關節體積受 限效應的關係。在有限元素模擬方面,掌指關節在施與 16 公斤軸向力與關節 內負壓時的軸向位移量,相似於實驗中獲得的軸向位移量。然而,在關節囊的 徑向變形量(頸縮效果),模擬結果(1.88mm)與實驗結果(5mm)卻有很大不同。 這或許是由於模擬中構成關節囊材料與實驗真實軟組織材料不同所致。. 本研究獲得下列幾項結論:關節內壓對掌指關節穩定度貢獻大部分在交點 之前,大概是總 16 公斤牽張力中的前 1-2 公斤。因此在掌指關節受到牽張力 時關節內壓提供初始階段的穩定度,關節囊提供受力後期的穩定度。關節內壓 與關節總體積改變和頸縮體積皆呈現高度線性負相關。因此以受限體積效應來 解釋關節內壓對關節穩定度的貢獻是合乎邏輯的。. 關鍵詞:關節內負壓、微電腦斷層掃描儀、掌指關節、穩定度、自製負載裝置. II.
(5) Abstract Negative intra-articular pressure (IAP) is a passive stabilizer during joint movement.. In contrast. to. that. of. large. joints, the. IAP. within. the. metacarpophalangeal (MCP) joint has not been well studied. The IAP in hand joints would become more important as the increasing demand of hand held devices. The limited joint volume effect is often used to describe the phenomenon of IAP on the stability the synovial joint. But the relation of the IAP and joint volume change has never been quantified. The objective of this study was to evaluate the biomechanical effects of the IAP of MCP joint in terms of load-displacement relation under long-axis distraction. Moreover, the quantitative relationship between IAP and joint volume change under joint distraction was also studied.. Fresh MCP joints specimens were used in this study. A custom-made loading device compatible with micro computed tomography (CT) was developed to measure the displacement and joint volume change, through CT images, under distraction load. Each specimen was also loaded using the material testing machine under intact and vented conditions of the joint capsule. The maximum distraction load for all specimens was 16kg. In addition to load-displacement data, the IAP under distraction load, thru material testing machine, was obtained with a pressure transducer. The correlation of the IAP with the load, displacement, volume change, and necking volume was analyzed. A finite element model, based on the experimental loading, was established to simulate the effect of IAP on MCP joint. The simulated deformation of the capsule was compared to the corresponding experimental outcomes including deformation from micro CT images.. III.
(6) The result shown that a typical load-displacement curve of a MCP joint under distraction force can be divided into three regions: toe-region, transition region (represented by the cross-point), and terminal region. Significant difference was found in the displacement at the cross-point (p < 0.001) and at the maximum load (16 kg) (p < 0.001) between intact and vented conditions. The displacements at cross-point were 3.44 ± 0.82 mm and 4.01 ± 0.81 mm for the intact and vented conditions, respectively. The displacements at maximum load were 4.60 ± 0.80 mm and 5.22 ± 0.97 mm for the intact and vented conditions, respectively. The displacement differences at the cross-point and 16 kg load were similar between the intact (1.16 ± 0.26 mm) and vented (1.20 ± 0.33 mm) conditions (p = 0.112). The stiffness values at the terminal range were not different between the intact (12.59 ± 2.53 kg/mm) and vented (12.28 ± 2.70 kg/mm) conditions (p = 0.124). Moreover, most of the IAP drops, range from 45% to 80%, occurred before the cross-point which bears only 1 to 2 kg of the total 16 kg distraction load. All these results suggested that the effect of axial distraction on IAP is expressed mostly at the initial stage, i.e. before the cross-point of the load-displacement relation.. Highly significant negative linear correlations were found between IAP and total volume change (r = -0.982 ± 0.015), necking volume (r = -0.951 ± 0.025), and displacement (r = -0.963 ± 0.029) for individual specimens. Intermediate linear correlations were found between the IAP and load (r = -0.792 ± 0.151). These results appear to reflect a relation between IAP and limited joint volume effect. For the finite element simulation, the axial displacement matched the corresponding experiment under the 16 kg axial loading when the negative IAP was applied. However, large difference was observed on the radial deformation of the. IV.
(7) joint capsule, necking effect, between the simulation (1.88 mm) and experiment (5 mm) outcomes. This might due to the constituting material model employed for the joint capsule.. In conclusion, the contribution of IAP to the stability of the MCP joint was demonstrated mostly before the cross-point, in the initial 1 to 2 kg of the total 16 kg distraction load. The IAP provides the stability at the initial stage while the joint capsule provides the stability in the late stage for MCP joint under distraction load. Highly negative linear correlation was found between IAP and total volume change as well as necking volume. The concept of the “limited joint volume effect” might be a logical rationale for the role of IAP in joint stabilization.. Keywords: negative intra-articular. pressure, micro computed tomography,. metacarpophalangeal joint, stability, custom-made loading device. V.
(8) 誌謝 這些年博士班的日子,令我學習到的許多。曾經對於很多事情我都沒有很 細心地觀察,經過了這幾年我也慢慢地體會。 在醫工所這幾年裡,我要感謝一直指導我的張志涵老師以及徐阿田老師, 沒有你們耐心地指導我沒有辦法完成這所有的研究。 徐老師有這篇研究的原創想法,加上張老師提供了醫工所微電腦斷層掃描 儀,才能完成這篇論文最精華的部分。 謝謝所有來的口試委員成大醫工系蘇芳慶老師與葉明龍老師,陽明醫工系 林峻立老師,臺中教育大學特教系吳柱龍老師給予指導,使我的研究論文更加 完美。 也要特別感謝的是義守大學醫工系的林惠婷老師,如果沒有你一直地替我 打氣,也幫我修改期刊稿件的內容,教導我統計分析,也不會有今天的論文。 劉澄醫師與其指導的醫師教導並協助我解剖大體老師手部的組織,使我的 實驗更加順利正確地完成。 這些年來實驗中使用了不少大體老師,對於大體老師一直保持著敬畏的心 情。感謝大體老師們的犧牲才有這篇論文的呈現。研究中如果有不尊敬的地方 也乞求大體老師們體諒。 在醫工所這幾年,我深深的體會到健康的可貴。曾經幫我寫博士入學推薦 函的張冠諒老師與鍾高基老師由於先後罹患癌症不敵病魔都離開了醫工所。對 於鍾老師臨走前每次遇到都會關心我的論文進度,更感受到老師的關愛。很抱 歉在老師臨走前沒有完成論文,令老師失望了。 另外還要感謝這些年來指導過我的學長姐們守義學長、鼎勝學長、保興學 長、瑞廷學長、恆立學長、莊淑芬醫師、文杰學長,還有感謝一起努力過的博 班同學們與學弟妹們世偉、郁仁、國彰、佳文、世永、國誌、耕任、聖洋、川 揚、致軒、裕文、志偉、奕宏、彥年、耀德、錦昇、閎智。另外妙俶、學惠、 偉勳、江諭、崇德、伊芳、雙蘊、奕芩、嘉穗、文傑,是我在在管理實驗室期 間的學弟妹們,如果有過嚴的情形請多包涵。另外接下來培安、宇興、子玄、 炳惠、華偉、惠如、閔鳳、宋政、一賢、雨宏,雖然有段時間我在二樓與你們 分隔兩個空間,但是還是很謝謝你們的協助與上來陪我聊天。琳晶、可軒、書 瑋、紹棻、柏毅、建堯、俊翔,你們這兩屆的活動很多,其實我也真的很想加 入,但是由於研究與論文過度忙碌,所以沒辦法參與,如果以後還有機會再一 起去玩吧。依寧、韋澐、昶達、惠慈、東賢、旻信很高興能夠跟你們一起畢業, 以後在社會上如果有遇到也要相互扶持哦。最後亭瑋、銘川、輝文、冠傑還有 小學妹嘉容,以後實驗室就靠你們了,要聽閎智的話哦!管理實驗室是很辛苦 的。還有要謝謝實驗室的助理俶萍、旻芝與雅雯,由於你們的協助,讓我研究 及研究以外的事都能順利完成。另外俊智機械的程老闆夫婦與其助理嘉敏,謝. VI.
(9) 謝你們協助製作研究中的負載裝置,也祝福程太太的身體早日康復。如果有疏 漏的人,還請見諒。 我摯愛的祖母、父母與姐姐,謝謝你們對我如此的包容,讓我念了如此多 年的書,之前媽媽與奶奶生病先後住院讓我明白長輩們年紀大了,需要相當努 力來回報父母的養育之恩,以後我會更加努力,不會讓長輩們失望的。也感謝 六舅推薦我進博士班念書,還對我時時關心。 最後我要感謝諸佛菩薩,多謝你們的保佑,給我身體心靈的寄託,讓我遇 到困難時更加勇敢地面對。請您在往後的日子裡繼續保佑我們全家身體健康、 萬事如意。阿彌陀佛。. VII.
(10) Contents 中文摘要 ............................................................................................................................... I Abstract............................................................................................................................... III 誌謝..................................................................................................................................... VI Contents ............................................................................................................................VIII List of Tables ..................................................................................................................... XI List of Figures ...................................................................................................................XII CHAPTER 1 ........................................................................................................................ 1 Introduction .......................................................................................................................... 1 1.1 Background.................................................................................................................... 1 1.2 Literature review ........................................................................................................... 5 1.2.1 The measurement of IAP .......................................................................................... 5 1.2.2 The effect of negative IAP on joint stability .......................................................... 7 1.2.3 The relationship of the pathologic joints and IAP................................................. 9 1.2.4 The volume measurement of the joint cavity .......................................................13 1.3 Motivation and Objectives.........................................................................................14 1.3.1 Motivation ................................................................................................................14 1.3.2 Objective and Specific aims ...................................................................................15 CHAPTER 2 ......................................................................................................................16 Materials and Methods .....................................................................................................16 2.1 Specimen preparation .................................................................................................16 2.2 Instrumentation ...........................................................................................................17 2.3 Experimental procedures ...........................................................................................22 VIII.
(11) 2.3.1 Procedures of loading device .................................................................................22 2.3.2 Procedures of MTS..................................................................................................24 2.4 Data Analysis ..............................................................................................................25 2.4.1 Joint volume from Micro CT .................................................................................25 2.4.2 Data collected from the procedures of loading device and MTS ......................26 2.4.3 Data analysis from the procedures of loading device and MTS ........................26 2.5 Finite element model of the MCP joint....................................................................29 CHAPTER 3 ......................................................................................................................32 Results.................................................................................................................................32 3.1 Loading-displacement curves with distracted MCP joint......................................32 3.1.1 Comparison of the load-displacement curved from the loading device and MTS ....................................................................................................................................32 3.1.2 Load-displacement data from MTS.......................................................................36 3.2 Joint volume changes and IAP ..................................................................................38 3.3 Load, displacement and IAP......................................................................................39 3.4 Finite element analysis ...............................................................................................43 CHAPTER 4 ......................................................................................................................47 Discussion ..........................................................................................................................47 4.1 The measurement of displacement data from the loading device.........................47 4.2 Load-displacement data from the loading device and MTS..................................50 4.3 Load-displacement curve in intact and vented conditions.....................................51 4.4 The correlation of IAP and load, displacement and necking volume ..................51 4.5 Finite element analysis ...............................................................................................54 4.6 Activities of daily living with MCP joint distraction .............................................54. IX.
(12) 4.7 Limitations ...................................................................................................................55 CHAPTER 5 ......................................................................................................................57 Conclusions ........................................................................................................................57 References ..........................................................................................................................58. X.
(13) List of Tables Table 1.1 Joint pressures of the hip in patients with transient synovitis and Perthes’ disease (a) Eight patients with transient synovitis (b) Four patients with Perthes’ disease (Vegter, 1987) ......................................................................................................11 Table 2.1 Scanning parameters of the radiographic mode ...........................................23 Table 2.2 Scanning parameters of the CT mode ...........................................................24 Table 2.3 Material properties used in finite element model ........................................31 Table 3.1. Displacement and stiffness for MCP joint measured under distraction load by the loading device and MTS (n=4)....................................................................35 Table3.2 Displacement and stiffness for MCP joint of middle, ring, little, and all fingers before and after vented ........................................................................................37. XI.
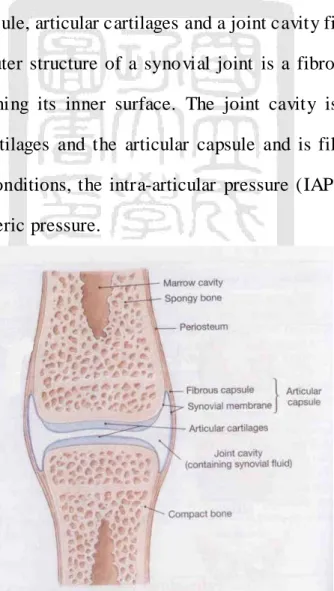
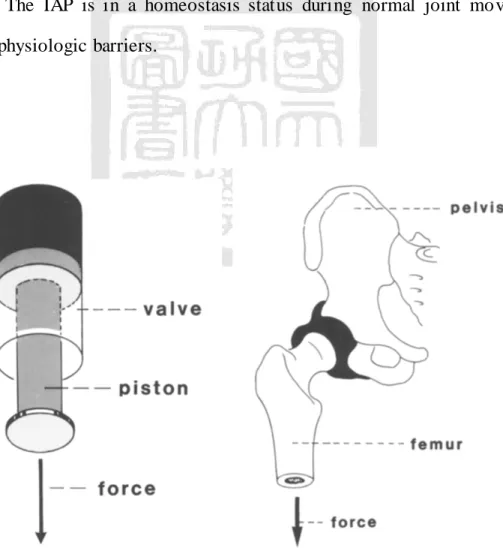
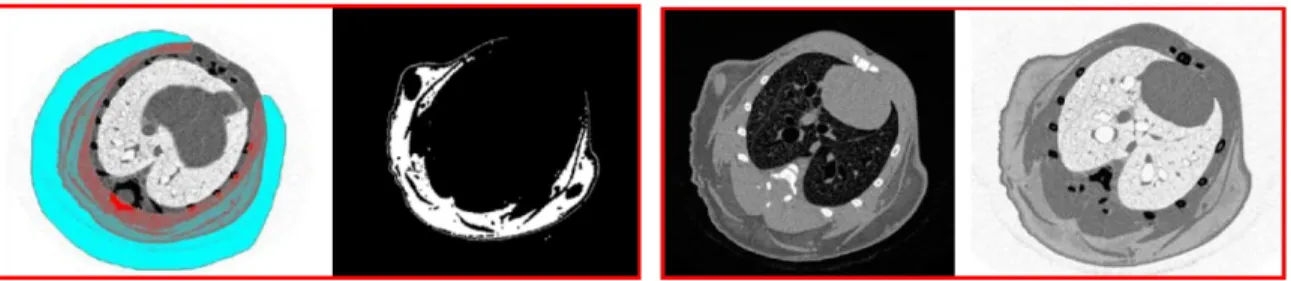
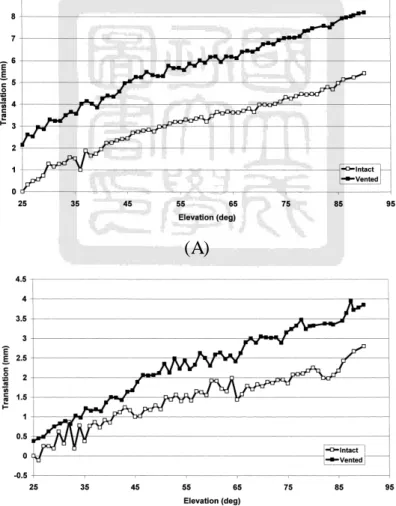
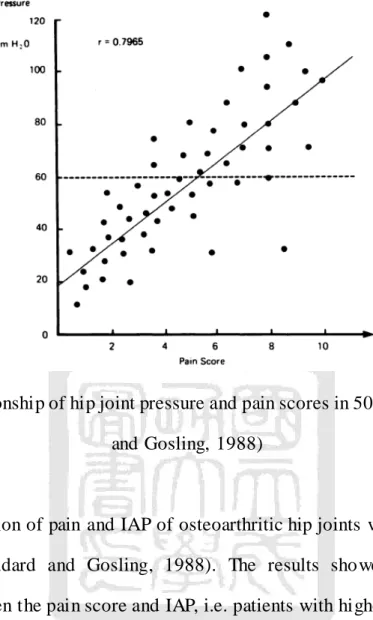
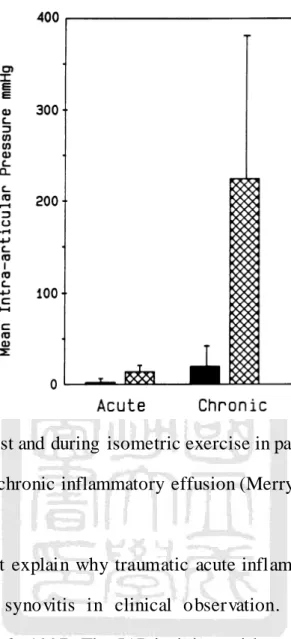
(14) List of Figures Fig 1.1 Structure of a synovial joint (Martini and Timmons, 1995)............................. 1 Fig 1.2 Piston-and-valve model of a synovial joint (Habermeyer et al., 1992) .......... 2 Fig 1.3 Micro CT images (a) Adipose tissue of a mouse (b) Lung tissue of a mouse (Phil, 2007)........................................................................................................................... 4 Fig 1.4 Measurement IAP using simple water manometer (A) knee joint (Jayson and Dixon, 1970a, b, c) (B) shoulder joint (Itoi et al., 1993) ........................................ 6 Fig. 1.5. Compartment. Pressure. Monitor. System. (Stryker,. UK). (http://www.stryker.com/en-us/products/OREquipmentConnectivity/GeneralMultiS pecialtyEquipment/PressureMonitors/IntraCompartmentalPressureMonitor/index.ht m)........................................................................................................................................... 6 Fig 1.6 Translations during elevation of the humerus (A) Superior-Inferior translation (B) Anterior-Posterior translation (Hurschler et al., 2000)......................... 8 Fig 1.7 IAP during no, 0.5 and 1.0 kg axial distraction (Yamamoto et al., 2006)...... 9 Fig 1.8 IAP in different postures in seven patients’ hip joints (Soto-Hall et al., 1964) .............................................................................................................................................10 Fig 1.9 The relationship of hip joint pressure and pain scores in 50 patients (Goddard and Gosling, 1988) ..........................................................................................12 Fig 1.10 Mean IAP at rest and during isometric exercise in patient groups with acute traumatic and chronic inflammatory effusion (Merry et al., 1991) ..................13 Fig 2.1 Mounted fresh cadaveric MCP joint specimen of the middle finger.............17. XII.
(15) Fig 2.2 Manual CM loading device (A) uniaxial load cell (B) micrometer (C) distal plate (D) axial slide (E) stainless-steel clamp................................................................19 Fig 2.3 Pneumatic loading device (A) uniaxial load cell (B) pneumatic cylinder (C) distal plate (D) axial slide (E) stainless-steel clamp (F) cable displacement transducer ...........................................................................................................................19 Fig 2.4. Thomas. AIR-PAC Model. T-617HDN Electric Air. Compressor. (http://cfpwarehouse.com/shopsite_sc/store/html/T617HDN.html)...........................19 Fig 2.5 E Speed controller (http://www.oetsindia.com/espeedc.htm) ........................20 Fig 2.6 MCP joint fixed on the loading device. The plastic film was wrapped on the joint capsule to prevent it from drying out before the experiment..............................20 Fig 2.7 instruNet data acquisition system ......................................................................20 Fig 2.8 Loading device on the Micro CT Skyscan1076 ...............................................21 Fig 2.9 The experimental setup for MCP joint distraction: MTS, specimen and X-Y table. ....................................................................................................................................22 Fig 2.10 a needle, connecting tube and pressure transducer are used to measure IAP. .............................................................................................................................................22 Fig 2.11 Load and displacement curves. (A) The cross-point was defined by the regression line for the neutral zone and terminal linear region (B) Load and displacement curves in the intact MCP joint (-) and after vented of the MCP joint (--) .............................................................................................................................................28 Fig 2.12 The base MCP joint (A) X-ray image (B) Solid volume model ..................29 Fig 2.13 Loading and boundary conditions of the FEA model (A) Fixed support (B) distraction loading: 0-16 kg (C) and (D) Negative IAP ...............................................30. XIII.
(16) Fig 2.14 The mesh model of the MCP joint...................................................................31 Fig 3.1 The load and displacement curves from the loading device for the cable displacement transducer measurement and radiographic images. ..............................33 Fig 3.2 Load-displacement curve (A) Neutral zone, toe region and terminal linear region regression lines on one specimen (B) Loading device(-) and MTS(--) load and displacement curves. A similar trend can be seen in the figure, but the stiffness at the neutral zone and toe region are different between the results from the loading device and MTS.................................................................................................................34 Fig 3.3 The radiographic images for one distracted MCP joint. .................................35 Fig 3.4 (A) Total volume and (B) Necking volume are linear between the displacement and volume. (n=4) .....................................................................................39 Fig 3.5 Load versus IAP with the cross-point marked. Highly non-linear curves are presented in the IAP load plots (r = -0.792 ± 0.151). The IAP decreased rapidly before the cross-point, during 5% to 10% total distraction of load. The IAP then slowly decreased with increasing load. (n=5)................................................................40 Fig 3.6 Displacement versus IAP. The curve presented a more linear pattern than that of the IAP - load curve (r = -0.963 ± 0.029). (n=5)...............................................41 Fig 3.7 The necking volume versus IAP. The correlation between the necking volume and IAP in all specimens is highly linear in a negative relation (r= -0.882). (n=4)....................................................................................................................................42 Fig 3.8 The total volume versus IAP. The correlation coefficient between the total volume and IAP in all specimens was not highly correlation (r = -0.762). However,. XIV.
(17) the correlation between the necking volume and IAP in each specimens is highly linear in a negative relation (range: -0.960 to -0.994) (n=4) .......................................42 Fig 3.9 The axial displacement (A) Negative pressure and 16 kg axial loading is applied. (B) Only 16 kg is applied ..................................................................................44 Fig 3.10 The radial deformation (A) Negative pressure and 16 kg axial loading is applied. (B) Only 16 kg is applied ..................................................................................45 Fig 3.11 The cross-section image of MCP joint capsule in FE model and CT image (A) Initial condition (B) under axial distraction load ...................................................46 Fig 4.1 To determine the error, the changes in the distance between the pneumatic cylinder and load cell as well as the distance between the slider and the load cell in the loading device were measured. .................................................................................49 Fig 4.2 A 16 kg load was applied by the MTS. The deformation of the loading frame was 0.14 mm at 16 kg of load...............................................................................49 Fig 4.3 The position of the cable displacement transducer in the loading device was modified in order to improve the displacement error. ..................................................50. XV.
(18) CHAPTER 1 Introduction. 1.1 Background The synovial joints (or diarthroses) allow movements to occur in the human body. There are various types of synovial joints with a wide range of movements; the shoulder, knee, elbow, wrist, ankle and interphalangeals are all examples of synovial joints. The basic structures of the synovial joint consists of two or more bones, an articular capsule, articular cartilages and a joint cavity filled with synovial fluid (Fig 1.1). The outer structure of a synovial joint is a fibrous capsule with a synovial membrane lining its inner surface. The joint cavity is enclosed by the constituting bones, cartilages and the articular capsule and is filled with synovial fluid. Under normal conditions, the intra-articular pressure (IAP) is maintained at below or near atmospheric pressure.. Fig 1.1 Structure of a synovial joint (Martini and Timmons, 1995). 1.
(19) According to a previous study (Habermeyer et al., 1992), the IAP was described by Weber et al. (1839) as functioning like a piston-and-valve model (Fig 1.2). In this sense, the acetabular labrum of the hip joint is regarded as a valve to seal the joint. The pressure inside the valve is described by the equation: pressure (p) = force (F) / area (a). Negative IAP is a well-recognized passive stabilizer of the synovial joint. When a joint moves, the configuration and the volume of the joint cavity is changed. As the joint is compressed, the articular cartilages approximate, and the synovial fluid flows to the periphery and lubricates the joint in the process. In contrast, during distraction, the synovial fluid flows into the central region of the joint cavity. The IAP is in a homeostasis status during normal joint movements bounded by physiologic barriers.. Fig 1.2 Piston-and-valve model of a synovial joint (Habermeyer et al., 1992). 2.
(20) IAP increases in the synovial joint are often found in the joints of patients with osteoarthritis, rheumatoid arthritis or other inflammatory conditions involving the joints. In these cases, abnormality of the homeostasis status leads to both increases in the amount of synovial fluid and expansion of the articular cavity, and the IAP may increase above atmospheric pressure. A correlation between pain and increased IAP has been proven in previous studies (Goddard and Gosling, 1988; Soto-Hall et al., 1964). Another factor affecting the magnitude of IAP is the joint volume. Because the joint cavity is sealed by the capsule, the distance between adjoining articular surfaces increases when the joint is under a distraction force. A relatively negative pressure is thus developed in the joint cavity. This is the concept of a “limited joint volume effect”, which has been identified in both the shoulder and hip joints (Gibb et al., 1991; Habermeyer et al., 1992). This negative IAP is a passive stabilizer as it tends to hold the joint together (Hurschler et al., 2000). The effects of volume changes on IAP have not been measured in previous studies. High resolution X-ray tomography technology was developed in the 1980’s for research applications. Recently, micro computed tomography (Micro CT) hardware and software technology has reached a mature enough level to allow the evaluation of the inner structure of specimens/animals. The adipose tissue and lung tissue of the mice has been evaluated using Micro CT (Fig 1.3). Therefore, it is possible to evaluate joint volume with the use of Micro CT.. 3.
(21) (a). (b). Fig 1.3 Micro CT images (a) Adipose tissue of a mouse (b) Lung tissue of a mouse (Phil, 2007). The finite element method (FEM) is a versatile useful tool to simulate the behavior of physical systems governable by partial differential equations. Micro CT, on the other hand, is also a good tool for structural analyses such as measurement of changes in the joint capsule, and therefore, Micro CT is capable of not only providing the detailed geometry necessary for construction of the finite element model, but also can provide the structure analysis measurements for the validation of the FEA method in order to elucidate the underlying mechanisms subserving the joint stabilizing function of negative IAP. In contrast to large joints, IAP within small synovial joints has not been well studied. With the increasing current demand inherent in the use of hand held devices, a better understanding of the biomechanical behavior of the hand joint has become increasingly more important. After a search of the relevant literature, only one study focused on the IAP at resting position for various metacarpophalangeal (MCP) joint conditions was found (Gaffney et al., 1995). The inspiration for using the MCP joint in the current study was derived from this previous study (Gaffney et al., 1995), which suggested that dramatic increases in both resting IAP and IAP after exercise might be a key marker of chronic MCP joint inflammation in patients. In addition,. 4.
(22) in face that the size of the MCP joint allows it to be scanned by a Micro CT unit also facilitated the selection of the MCP joint for investigation in this study.. 1.2 Literature review. 1.2.1 The measurement of IAP In the literature, several methods have been used to measure IAP. The simple water manometer and pressure transducer (Fig. 1.4) was the first method employed for measuring IAP (Jayson and Dixon, 1970a, b, c; Merry et al., 1991; Nitzan, 1994; Resnik et al., 1984; Soto-Hall et al., 1964; Vegter, 1987) in reference to atmospheric pressure. If the measured pressure is higher than the atmospheric pressure, the pressure is defined as positive. Otherwise, the pressure is regarded as negative. A tube filled with saline solution containing no air bubble is used in this measurement. The tube is attached to a needle on one end and to an enclosed saline reservoir on the other. Under arthroscopic or ultrasonic guidance, the needle is inserted into the synovial joint. A 3-way stopcock tube is connected to a pressure sensor device for recording the water pressure within the tube. This kind of device has been employed on the hip, knee, shoulder and temporomandibular joints in-vivo or cadervic specimens.. (A) 5.
(23) (B) Fig 1.4 Measurement IAP using simple water manometer (A) knee joint (Jayson and Dixon, 1970a, b, c) (B) shoulder joint (Itoi et al., 1993). Fig 1.5 Compartment Pressure Monitor System (Stryker, UK) (http://www.stryker.com/en-us/products/OREquipmentConnectivity/GeneralMultiS pecialtyEquipment/PressureMonitors/IntraCompartmentalPressureMonitor/index.ht m). A new commercial instrument has been developed to measure IAP. The Compartment Pressure Monitor System (Stryker, UK) (Fig 1.5) has been used in the MCP, wrist, ankle, elbow and knee joints (Gaffney et al., 1995; Jawed et al., 1997). The theory on which this instrument is based is similar to that of the simple manometer system. There are two major components in this pressure monitor system. The solid pressure monitor system incorporates a pressure transducer. 6.
(24) system, a power supply, an auto zero mechanism and a pressure monitor display. These two methods have been used in-vivo in previous research. Although the IAP was measured, some disadvantages were found. The simple manometer has often been used in pathologic joints, but no data was available for comparison of the IAP measured from a normal joint with that of the pathologic one. The Stryker system has been used in normal joint, and the values of the IAP were found to be lower than those of the pathologic joints. No negative pressure and decimal points were shown in this monitoring system. Cadaveric shoulders have also been used to investigate IAP using both manometers and pressure transducers (Habermeyer et al., 1992; Itoi et al., 1993; Kumar and Balasubramaniam, 1985; Yamamoto et al., 2006). Their results of these studies indicated that negative pressure (-3.09mmHg~-8.52mmHg) was present on the intact shoulder at the neutral position (Itoi et al., 1993; Kumar and Balasubramaniam, 1985; Yamamoto et al., 2006). When the shoulder joint was distracted by a 1.0 kg weight, the IAP was significantly decreased to -21~-34.42 mmHg (Itoi et al., 1993; Yamamoto et al., 2006). In another study, the IAP was different range on the shoulder joint in neutral position (-25mmHg~-42mmHg). When the shoulder joint was abducted, the IAP also decreased to -111~-114mmHg (Habermeyer et al., 1992). Similar results were found on hip joints in previous studies (Goddard and Gosling, 1988; Soto-Hall et al., 1964; Vegter, 1987). The position and extra loads on the joints influenced the IAP of these joints.. 1.2.2 The effect of negative IAP on joint stability The effect of negative IAP has been investigated in previous studies. The amount of joint translation has also been used to evaluate the IAP of the synovial. 7.
(25) joint. According to current research, negative IAP has been proposed as a passive stabilizer in the shoulder joint (Chang et al., 2004; Gibb et al., 1991; Habermeyer et al., 1992; Hurschler et al., 2000). The existence of negative IAP requires an intact articular capsule. When the articular capsule is punctured or vented, the air flows into the joint cavity, and the negative IAP will no longer be there. As a result, the translation of the joint is increased, and the joint becomes more unstable. After vented the joints, the translations are increased at the same position of elevation, as shown in Fig 1.6.. (A). (B) Fig 1.6 Translations during elevation of the humerus (A) Superior-Inferior translation (B) Anterior-Posterior translation (Hurschler et al., 2000). 8.
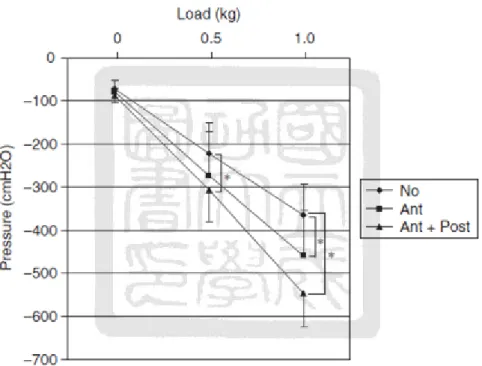
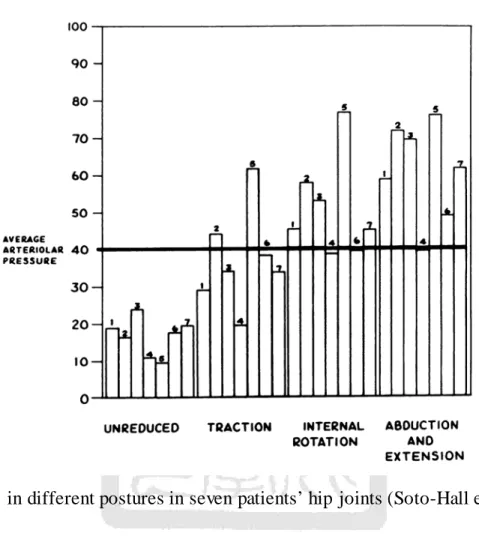
(26) Negative IAP has also been used to evaluate shoulder joint stability. Both anterior and posterior capsular shifts were performed on shoulder joints in a previous study (Yamamoto et al., 2006). The results showed the IAP to decrease after the anterior capsular shift. The greatest reduction in IAP was found in shoulders that had undergone both an anterior and posterior capsular shift (Fig 1.7). The stability of the shoulder was improved using this surgical technique.. Fig 1.7 IAP during no, 0.5 and 1.0 kg axial distraction (Yamamoto et al., 2006). 1.2.3 The relationship of the pathologic joints and IAP The correlation of the IAP and pathologic hip joints was been investigated by Soto-Hall et al. (Soto-Hall et al., 1964). Their results showed the IAP in a pathologic high joint to different from that of a normal hip joint. While the IAP was a positive in joints with pathology, when a traction force was applied to the joint or when the hip was internally rotated or was abducted and extended, the IAP. 9.
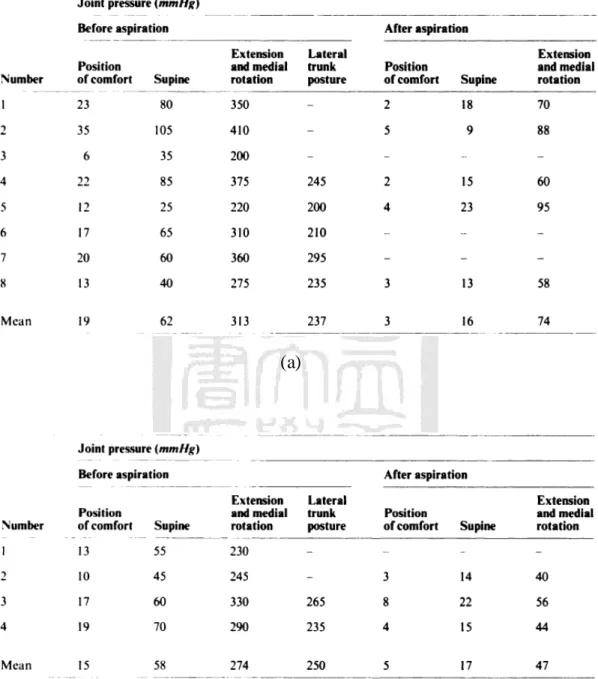
(27) significantly increased. (Fig 1.8). Fig 1.8 IAP in different postures in seven patients’ hip joints (Soto-Hall et al., 1964). Another similar study was published in patients with Perthes’ disease and transient synovitis (Vegter, 1987). The IAP of a hip was shown to be positive in the position of comfort. (Table 1.1) The IAP of a hip joint in the position of comfort was compared in three postures in this study. If the patient was moved to the supine, extension and medial rotation or lateral trunk posture, the IAP of the hip joint dramatically increased. After aspiration, the IAP decreased to close zero in a position of comfort. The pressure also decreased in other postures. (Table 1.1). 10.
(28) Table 1.1 Joint pressures of the hip in patients with transient synovitis and Perthes’ disease (a) Eight patients with transient synovitis (b) Four patients with Perthes’ disease (Vegter, 1987). (a). (b). 11.
(29) Fig 1.9 The relationship of hip joint pressure and pain scores in 50 patients (Goddard and Gosling, 1988). The association of pain and IAP of osteoarthritic hip joints was investigated in 50 patients (Goddard and Gosling, 1988). The results showed a good linear correlation between the pain score and IAP, i.e. patients with higher resting pressure experienced more pain (Fig 1.9). In previous studies, IAP was also measured in the knee joints of patients with chronic inflammatory effusion (Gaffney et al., 1995; Jawed et al., 1997; Merry et al., 1991). These studies found positive IAP due to fluid increase in the joint cavity. The IAP in the knee joints of patients with acute traumatic effusion was found to be lower than those with chronic inflammatory effusion (Merry et al., 1991) (Fig 1.10). Clinical implications of such difference in regard to the generation of IAP between these two groups of patients may lead to mitigation of hypoxic-reperfusion injury in joints with acute traumatic inflammation.. 12.
(30) Fig 1.10 Mean IAP at rest and during isometric exercise in patient groups with acute traumatic and chronic inflammatory effusion (Merry et al., 1991). These results might explain why traumatic acute inflammatory effusion rarely develops into chronic synovitis in clinical observation. A similar result was published by Jawed et al., 1997. The IAP in joints with acute traumatic effusions was shown to be lower than in joints with rheumatoid arthritis and osteoarthritis.. 1.2.4 The volume measurement of the joint cavity The concept of a “limited joint volume effect” can also be used to describe the negative IAP in a joint (Gibb et al., 1991; Hurschler et al., 2000). The concept of the “limited joint volume effect” is similar to the piston-and-valve mechanism discussed earlier. When a distraction load is applied to a joint, the volume of the joint cavity is increased. The joint capsule is compressed as a result of atmospheric. 13.
(31) pressure. The incompressible nature of the fluid within the joint cavity causes resistance to the change in joint volume caused by the distracting load. The joint tends to hold together as a result of the negative IAP, and thus IAP becomes an important passive stabilizer of synovial joints. In previous studies, joint volume was investigated to evaluate joint stability (Karas et al., 2004; Lubowitz et al., 1996). However, these studies were focused only on joint laxity. The relationship between IAP and joint volume has not been investigated in previous studies on this topic, even though the “limited joint volume effect” has been mentioned since 1991(Gibb et al., 1991).. 1.3 Motivation and Objectives. 1.3.1 Motivation In previous studies, IAP was measured using manometer system and pressure transducer. In contrast to large joints, IAP within small synovial joints has not been well studied. Only one study was identified, which focused on the IAP at resting position for various MCP joint conditions (Gaffney et al., 1995). In this study, it was suggested that dramatic increases in both resting IAP and IAP after exercise might be a key marker of chronic MCP joint inflammation in patients. The concepts of “limited joint volume effects” and “piston and valve” were the major theories used to describe IAP. Up to the present, the relationship between the IAP and joint volume has not been studied. The size of the MCP joint is suitable for Micro CT. The volume is measured using Micro CT during the application of long-axis distraction. The finite element method is also a good tool to analyze the all kinds of mechanism of physical problem. It is suggested herein that a comparison of the. 14.
(32) results of the finite element model and structural analysis from Micro CT data is a better method by which to validate and understand the effects of negative IAP.. 1.3.2 Objective and Specific aims The objective of this study is to investigate the effect of negative IAP in an MCP joint under conditions involving long axis distraction. The specific aims include: (1) The relation of IAP and changes in joint volume: Micro CT images were used to calculate the volume of a joint during joint distraction. The joint volume changes were compared IAP in the same bone separation of MCP joint. (2) The role of IAP in an MCP joint under conditions involving long axis distraction: To evaluate the displacement and stiffness of an MCP joint with and without negative IAP during distraction. The traditional pressure transducer was used in this procedure. Then, the relation of the IAP and load, displacement and changes in joint volume were compared, and the relationships found in these results were analyzed. (3) The effect of the IAP on the joint capsule was analyzed by a 3D finite element model: A finite element model of an MCP joint was developed and validated with the experiment results. The bones and capsule were included in this model. The result from the IAP data was applied on the inner structure of the joint capsule under the same distraction load. Then, the change in the capsule was compared to the Micro CT images.. 15.
(33) CHAPTER 2 Materials and Methods. Three major phases of the biomechanical effect of the negative IAP on the MCP joint were executed in this study. (1) Uniaxial distraction loads were applied to an MCP joint inside a Micro CT. The volume changes within the joint capsule were calculated. (2) The MCP joint was applied with the uniaxial load on a material testing machine to measure its displacement and stiffness. The IAP was measured using a pressure transducer. The correlation of IAP and joint volume changes from Micro CT images was analyzed. (3) A three dimensional finite element model of the MCP joint was established. The IAP and uniaxial distraction load were applied on the finite element model. The changes in the joint capsule were compared to the images from the Micro CT. The simulated outcomes were validated using the experimental result. The details materials and methods are described in the following sections:. 2.1 Specimen preparation Five fresh cadervic hand specimens were procured and stored in a -20℃ freezer until the day before testing. The specimens were thawed overnight at the room temperature (25℃). The middle, ring and little fingers were harvested for the experiments. The Micro CT Skyscan 1076 was used to screen the MCP joint of each finger. Specimens with pathologies involving the MCP joint were excluded. The tissues, including the middle phalangeal, distal phalangeal and carpal bones and the. 16.
(34) attached soft tissue, were removed before testing. The soft tissues were taken carefully to prevent the capsule of the MCP joint from sustaining any damage (Accessory collateral ligament, true collateral ligament and palmar ligament). Two paired screws were drilled perpendicularly into the base of the metacarpal and the head of the proximal phalanx. Each end was then fixed in a custom-made stainless mold (25mm in diameter and 20mm in height) with resin (Red Mount 911, Yu-Der industrial corp., Tainan, Taiwan). The mold was removed when the resin was fully hardened (Fig 2.1). Saline spray was applied on the specimen periodically to prevent drying out during the experiment.. Fig 2.1 Mounted fresh cadaveric MCP joint specimen of the middle finger. 2.2 Instrumentation A Micro CT compatible custom-made loading device was developed to measure changes in joint volume at different distraction distances. Fig 2.2 and Fig 2.3 depict the custom-made loading device. Manual displacement control (Fig 2.2) or pneumatic force control (Fig 2.3) modes were employed to provide the axial loads. A micrometer (151-224, Mitutoyo, Japan, Fig 2.2 (B)) was used to apply a displacement load on the manual loading device. A pneumatic cylinder (CQ2B32-15DZ-XB6, SMC,Japan, Fig 2.3 (A)) coupled with an air compressor. 17.
(35) (T-617HDN A, ULTRA-PAC, USA, Fig 2.4) provided the continuous load for the pneumatic loading device. Six speed controllers (ESC6-PT1/8-O-TR, NITTA, Japan, Fig 2.5) were attached on the air tube to control the air flow and speed of the pneumatic cylinder. A uniaxial load cell (MDB-50, Transducer Technique, U.S.A, Fig 2.2 (A) and Fig 2.3 (A)) was attached either to the micrometer or the pneumatic cylinder on one end and the axial slide on the other using a screw and a stainless-steel assembly. A cable displacement transducer (Celesco, Celesco Transducer Products, CA, Fig 2.3 (F)) was attached to the side of the pneumatic cylinder for the purpose of monitoring the displacement. The force and displacement data were recorded using the instruNet data acquisition system, which consisted of a USB i2x0 instruNet DSP card (GW Instruments, USA), a data acquisition system box (instruNet i100, GW instruNet Inc., USA), a power supply, instruNet data acquisition software and a notebook computer (Fig 2.7). High resolution computed tomography (Skyscan1076, Bruker, Belgium, Fig 2.8) was used to evaluate the capsule deformation when the MCP joint was distracted. The raw radiographic images were used to record the capsule deformation in pneumatic force control mode. The CT images were reconstructed using the software (Nrecon) from the Skyscan Company in the manual displacement control mode. The volume of the MCP joint was calculated using the software (CT-An) from the Skyscan Company. Fig 2.8 shows the custom-made loading device mounted on the Micro CT scanner.. 18.
(36) (C). (E). (D). (A). (B). Fig 2.2 Manual CM loading device (A) uniaxial load cell (B) micrometer (C) distal plate (D) axial slide (E) stainless-steel clamp. (B) (C). (E). (D). (A) (F). Fig 2.3 Pneumatic loading device (A) uniaxial load cell (B) pneumatic cylinder (C) distal plate (D) axial slide (E) stainless-steel clamp (F) cable displacement transducer. Fig 2.4 Thomas AIR-PAC Model T-617HDN Electric Air Compressor (http://cfpwarehouse.com/shopsite_sc/store/html/T617HDN.html). 19.
(37) Fig 2.5 E Speed controller (http://www.oetsindia.com/espeedc.htm). Fig 2.6 MCP joint fixed on the loading device. The plastic film was wrapped on the joint capsule to prevent it from drying out before the experiment.. Fig 2.7 instruNet data acquisition system. 20.
(38) Fig 2.8 Loading device on the Micro CT Skyscan1076. A uniaxial material testing system (MTS) (AG-I, Shimadzu, Japan) equipped with an X-Y table was used to apply tensile load to the MCP joint (Fig 2.9). A pressure transducer (89A-001D-9212, Sensormate Enterprise Co., Taiwan) attached to a tube and a standard 26-gauge needle was inserted into the joint cavity to measure the IAP (Fig. 2.10). An i430 card cage (GW Instruments, USA) and a USB i2x0 instruNet DSP card (GW Instruments, USA) were used to record the pressure data with a sampling rate of 50Hz. The specimen was mounted on the base plate of the MTS such that the metacarpal base block was on the bottom side, and the proximal phalangeal head block was on the upper side.. 21.
(39) Fig 2.9 The experimental setup for MCP joint distraction: MTS, specimen and X-Y table.. Fig 2.10 a needle, connecting tube and pressure transducer are used to measure IAP.. 2.3 Experimental procedures 2.3.1 Procedures of loading device The specimen was placed on the extended position (Fig 2.6). The metacarpal base block was fixed on the stainless clamp of the distal plate, and the phalangeal head block was fixed on stainless clamp on the axial slide (Fig 2.2 (D)(E) or Fig 2.3. 22.
(40) (D)(E)). The dorsal side of MCP joint was facing superiorly, and the palmer side was facing inferiorly. The longitudinal axis of the MCP joint was aligned parallel to the axis of the load cell. A preload of 5 N compressive force was applied to the MCP joint via the proximal phalangeal head block. A pneumatic system (Fig 2.3) was employed to apply distraction forces up to 16kg of load. As soon as the air pressure was released, the slide (translator) returned to the initial position. The radiographic mode of the Micro CT scanner was used to detect the separation of the MCP joint when the distraction loading was applied by a pneumatic cylinder on the loading device. Radiographic images were taken during the distraction tests. The resolution of the images was 35um pixel size. The filter was Al 0.5mm in order to enhance the radiation strength and to obtain more clear images. The voltage was 70kV, and the current was 130μA. The exposure time was set to 158ms, but the actual interval time for each picture was 650ms when taken the operation time of the source-detector machine was taken into consideration. The parameters for the radiographic mode are shown in Table 2.1. Each test was repeated 3 times.. Table 2.1 Scanning parameters of the radiographic mode Parameters Resolution(μm) Filter Exposure times (ms) Voltage (kV) Current (μA) Rotation Step (degree). X-ray mode 35 Al 0.5mm 158 70 130 0. Next, the loading device was switched to the manual displacement mode (Fig 2.2). The initial condition was also set to a compression preload of 5N, and this. 23.
(41) position was defined as 0 mm. The CT mode was used to evaluate changes in joint volume. The micrometer was adjusted in successive 1mm increments until 16kg of load was registered from the loading device. The resolution was also set to 35um, and the filter was also Al 0.5mm. The voltage was 50kV, and the current was 200μA. The exposure time was set at 316ms. The radiographic image was taken at each one degree of rotation angle. The parameters for the CT-mode are shown in Table 2.2.. Table 2.2 Scanning parameters of the CT mode Parameters Resolution(μm) Filter Exposure times (ms) Voltage (kV) Current (μA) Rotation Step (degree). CT mode 35 Al 0.5mm 316 50 200 1. 2.3.2 Procedures of MTS The experiments were performed under three conditions: (A) intact condition, (B) combined pressure testing and (C) vented condition. In all three conditions, tensile loading was applied to the MCP joint at a velocity of 0.2 mm/s until a 16-kg load was reached. Ten trials were conducted for each condition. Initial biomechanical tensile loading of the intact MCP joint was performed before the pressure testing. The specimen was mounted on the base plate of the MTS such that the metacarpal base block was on the bottom side, and the proximal phalangeal head block was on the upper side. The pressure transducer was then placed near the MCP joint. A standard 26-gauge needle was attached to the tube connected to the pressure transducer.. 24.
(42) Saline was poured through the tube to the needle. This was to ensure that no air remained within the needle or tube. The needle was inserted into the joint cavity of the MCP joint through the dorsal side of the capsule. (Fig 2.10) The IAP was recorded throughout the procedure. After the pressure was recorded, the pressure transducer was disconnected with the needle still inserted within the cavity of the MCP joint. Under this condition, air was flow into the cavity of the MCP joint. IAP and atmospheric pressure equilibrium was finally reached, and then the load and displacement were recorded under the vented condition.. 2.4 Data Analysis 2.4.1 Joint volume from Micro CT In order to evaluate the relationship between IAP and changes in joint volume, the CT images were reconstructed and any changes in joint volume were then computed: (1) total volume, (2) virtual vented volume, and (3) necking volume. The virtual vented volume was defined as the volume enclosed between the maximal circumference of the head of the metacarpal and that of the base of the proximal phalanx. The virtual vented volume was assumed to be the volume record under the vented condition. Under this condition, air could flow into and out of the cavity of the MCP joint until equilibrium between the IAP and the atmospheric pressure was finally reached. The volume difference between the virtual vented volume and the real volume at each distance was calculated first. The necking volume was defined as this volume different minus the volume difference obtained when the distraction distance was 0mm. Correlations among the necking volume and IAP measured from. 25.
(43) pressure transducer during the MTS procedure were calculated using the Pearson correlation coefficient.. 2.4.2 Data collected from the procedures of loading device and MTS The load and displacement data was collected from the both loading device and MTS procedures. The IAP data was only collected in the MTS procedure by the pressure transducer. The space allowed within the Micro CT scanner is too small to measure the IAP. Therefore, the pressure was measured in the MTS procedure. The correlation in the change of IAP and joint volume for the same amount of increments was investigated.. 2.4.3 Data analysis from the procedures of loading device and MTS The resulting load-displacement curve was a nonlinear curve, as shown in Fig 2.11. Three phases were identified from this curve: the initial neutral zone, the toe region and the terminal linear region (Wu, 2008). Two linear line segments were fitted to the neutral zone and the terminal linear region, respectively, for each load-displacement curve. An iteration procedure was used to determine the cross point, as well as the three phases. Firstly, a reasonable point to represent the starting point of the toe region was manually selected. A regression line was determined by fitting the data points before this selected starting point. The average and standard deviation of the perpendicular distances between the fitted data points and the regression line were calculated. The starting point of the toe region was then redefined as the first point that had a distance over the average distance plus double standard deviations. The regression line was regenerated based on the data points before this redefined starting point of the toe region. Due to the fact that the. 26.
(44) difference between these two regression lines was limited, no further iteration was executed. A similar procedure was used to define the terminal linear region regression line. The intersection point of these two line segments was defined as the cross-point, as shown in Fig 2.11 (A). Four parameters were computed for the purpose of statistical analysis: (1) the displacement value at the cross-point, (2) the displacement value at a load of 16 kg, (3) the difference in displacements corresponding to the load of 16 kg and that of the cross-point and (4) the stiffness at the terminal range, i.e., the slope of the second fitted line segment. A Wilcoxon signed-ranks test, in a pair fashion, was employed to execute a statistical evaluation on each parameter of the intact and vented conditions with the significance set at 0.01. Four parameters from the loading device were also compared to the MTS measurement from the same sample: (1) displacement value at the load of 16 kg, (2) stiffness of the neutral zone, (3) stiffness at the toe region, and (4) stiffness at the terminal linear region. A Wilcoxon signed-ranks test was also employed to execute a statistical evaluation on each parameter of the loading device and MTS units, with the significance set at 0.05. SPSS (IBM Corporation, USA) for Windows (version 17) was used for statistical analyses. The measured IAP was used to plot against displacement and load respectively, in order to identify the factor driving the IAP change.. 27.
(45) (A). (B) Fig 2.11 Load and displacement curves. (A) The cross-point was defined by the regression line for the neutral zone and terminal linear region (B) Load and displacement curves in the intact MCP joint (-) and after vented of the MCP joint (--). 28.
(46) 2.5 Finite element model of the MCP joint The three-dimensional finite element model was based on the MCP joint of the middle finger with soft tissue, and the capsule MCP joint was preserved at 1mm of distraction using a custom-made loading device for the Micro CT skyscan1076. The reconstructed image pixel size was set to 35μm. As the voxel concepts, the slice interval was also set 35μm. The CT image data were exported to the Avizo software (version 6.2, VSG. USA). The profiles of the intact bones and the MCP joint capsule were obtained from Avizo. The surface model was established from the Micro CT images. The surface model was imported into computationally aided design software. Then, the surface model was converted to the solid model. The solid model was input to the preprocessor system of the ANSYS workbench (version 13.0., Swanson Analysis Inc., Huston, PA, USA). (A). (B) Fig 2.12 The base MCP joint (A) X-ray image (B) Solid volume model. 29.
(47) The element was created using 10 node tetrahedral elements on the bones, cartilages and capsule. The bone was assumed to be a solid body, and no holes were inside the bone. The capsule is surrounding the bone. Surface to surface contact elements were used where the bones and capsule made contact. A fixed support was assigned at the metacarpal base. An axial loading was applied from the head of the proximal phalanx. The loading forces were applied from 0 to 16kg at increments using the result from the MTS testing procedure in the velocity 0.2mm/s loading rate. Negative IAP corresponding to the applied load during the MTS test was applied on the inner surface of the capsule and articular cartilages (Fig 2.13). The frictional coefficient was set 0.001. The deformation of the capsule was compared with that obtained from the Micro CT images at the same distraction distance. The material properties refer to previous studies (Butz et al., 2012; Guo et al., 2009). As there was no published material property for the MCP joint capsule, the material property of the capsule was modified from the adjacent ligament surrounding the MCP joint. All the material properties were assumed homogeneous and isotropic in the present study. The Young’s modulus and Poisson’s ratio are shown in the Table2.3. The entire model consisted of 27,394 elements and 47,654 nodes, as shown in Fig 2.14.. Fig 2.13 Loading and boundary conditions of the FEA model (A) Fixed support (B) distraction loading: 0-16 kg (C) and (D) Negative IAP. 30.
(48) Table 2.3 Material properties used in finite element model Young’s modulus (MPa). Poisson’s ratio. Bone. 15500. 0.3. Cartilage. 100. 0.43. Capsule. 2. 0.47. Fig 2.14 The mesh model of the MCP joint. 31.
(49) CHAPTER 3 Results. Three of the 12 MCP joints were fractured during axis distraction. Therefore, only nine fingers (two little, three ring, and four middle fingers) from four cadaveric hand specimens were used for analyses.. 3.1 Loading-displacement curves with distracted MCP joint 3.1.1 Comparison of the load-displacement curved from the loading device and MTS The loading device was available later than the MTS measurements. Therefore, two hand specimens were used on the pneumatic loading device unit. Only four MCP joints from two hands were used in loading device unit measurement because one little finger was fractured during the longitudinal distraction, and data from the Micro CT was lost for one middle finger. Therefore, only four fingers (one little, two ring, and one middle fingers) were used for further analyses. A large difference was found between the results for distracted distance measured from the loading device between the radiographic image and cable displacement transducer measurements (Fig 3.1). The results in displacement from the micrometer and the cable displacement transducer were greater than the actual displacement taken from the radiographic images. Therefore, the displacement data was obtained from the radiographic images for the load-displacement parameters and volume analyses. The results were compared with those obtained from the MTS measurements. The. 32.
(50) load and displacement curves obtained from the pneumatic loading device in one of the MCP specimens is shown in Fig 3.2 (A). The neutral zone, toe region, and terminal linear region regression lines are also shown in Fig 3.2 (A).. Fig 3.1 The load and displacement curves from the loading device for the cable displacement transducer measurement and radiographic images.. (A). 33.
(51) (B) Fig 3.2 Load-displacement curve (A) Neutral zone, toe region and terminal linear region regression lines on one specimen (B) Loading device(-) and MTS(--) load and displacement curves. A similar trend can be seen in the figure, but the stiffness at the neutral zone and toe region are different between the results from the loading device and MTS. Fig 3.2 (B) shows the load-displacement curves constructed from one of the MCP joint specimens from the pneumatic loading device and the MTS. Table 3.1 lists the averaged values and standard deviations of the four evaluated parameters. No significant differences were observed in all parameters because the number of specimens was too small. Between values obtained with the pneumatic loading device and the MTS, no significant differences were observed in the magnitude of displacement at the 16 kg load (p = 0.593) or in the stiffness at the terminal linear region (p = 0.465). Although no significant differences were observed for the stiffness at the neutral zone (p = 0.068) and the stiffness at the toe region (p=0.273) between the pneumatic loading device and the MTS measurement, the values from the loading device were almost always larger than those from the MTS.. 34.
(52) Table 3.1. Displacement and stiffness for MCP joint measured under distraction load by the loading device and MTS (n=4). Displacement (mm) value at a 16 kg load Stiffness (kg/mm) at neutral zone Stiffness (kg/mm) at toe region Stiffness (kg/mm) at terminal linear region. Loading device. MTS. Asymp. Sig.. 4.49 ± 0.93. 4.47 ± 0.92. 0.593. 0.27 ± 0.12. 0.15 ± 0.06. 0.068. 2.17 ± 1.18. 1.35 ± 0.45. 0.273. 16.77 ± 3.61. 15.61 ± 1.49. 0.465. Values are means ±SD, * Significance level < 0.05 between the loading device and MTS measured results for all MCP joints.. The radiographic images of a distracted MCP joint are shown in Fig 3.3. The displacement data were collected from these images. The bone distraction distance was calculated using the software (Nrecon) from the Skyscan Company.. Fig 3.3 The radiographic images for one distracted MCP joint.. 35.
(53) 3.1.2 Load-displacement data from MTS Table 3.2 lists the averaged values and standard deviations of the four parameters evaluated: the displacements at the 16 kg of load and at the cross-point, the difference in displacement corresponding to the 16 kg of load and that of the cross-point, and the stiffness at the terminal linear region. The displacements at the cross-point in the intact MCP joint and those after vented were 3.44 ± 0.82mm and 4.01 ± 0.81 mm, respectively. A significant difference was observed between the two conditions, with a p-value less than 0.001. The displacements at 16 kg of load for the intact MCP joint and those after vented were 4.60 ± 0.80mm and 5.22 ± 0.97 mm, respectively. A significant difference was also detected, with a p-value less than 0.001. However, no significant difference was observed (p = 0.112) for the displacement differences between the 16 kg of load and the cross-point of the intact MCP joint and those after vented. The displacement differences were 1.16 ± 0.26mm and 1.2 ± 0.33mm for the intact and vented groups, respectively. The values of stiffness at the terminal range in the intact MCP joint and those after vented were 12.59 ± 2.53 kg/mm and 12.28 ± 2.70 kg/mm, respectively. No significant differences in the stiffness at the terminal range were found (p = 0.124).. 36.
(54) Table3.2 Displacement and stiffness for MCP joint of middle, ring, little, and all fingers before and after vented Middle fingers(n=4). Ring fingers(n=3). Little fingers(n=2). All fingers(n=9). Before. After. Before. After. Before. After. Before. After. Asymp. Sig.. 4.97(0.68). 5.81(0.79). 3.80(0.20). 4.12(0.35). 5.06(0.68). 5.67 (0.31). 4.60(0.80). 5.22(0.97). 0.000*. 3.75(0.83). 4.52(0.62). 2.76(0.18). 3.08(0.20). 3.84(0.83). 4.16(0.68). 3.44(0.82). 4.01(0.81). 0.000*. 1.23(0.25). 1.30(0.35). 1.03(0.31). 1.03(0.35). 1.22(0.15). 1.51(0.39). 1.16(0.26). 1.20(0.33). 0.112. 11.54(1.62). 11.30(1.61). 14.56(3.20). 14.48(3.33). 11.71(0.75). 10.95(1.09). 12.59(2.53). 12.28(2.70). 0.124. Displacement (mm) value at a 16 kg load. Displacement (mm) value at the cross-point. Difference in displacement corresponding to the load of 16 kg and that of the cross-point (mm). Stiffness (kg/mm) at terminal linear region. Values are means (SD), *Significance level: p < 0.01 between intact and vented conditions for all MCP joints. 37.
(55) 3.2 Joint volume changes and IAP According to the limited joint volume effect, a relative negative pressure was induced in the changes in joint volume using a joint distraction load. The manual loading device applied a fixed axial distracted displacement on the MCP joint specimen. Therefore, the joint volume changes were observed using the Micro CT images, and the joint volume was also calculated using the software CTAn from the Micro CT company. Fig 3.4 (A) shows a plot for the displacement versus total volume. The results indicate that the total volume was linearly related to the amount of displacement. The total volume in the middle finger was larger than the total volume in both the ring and the little finger due to anatomic morphology. Because the necking volume was the difference between the virtual vented volume and total volume, the necking volume was also linearly related to the amount of displacement (Fig 3.4 (B)).. (A). 38.
(56) (B) Fig 3.4 (A) Total volume and (B) Necking volume are linear between the displacement and volume. (n=4). 3.3 Load, displacement and IAP Four out of the nine measured IAPs from the MCP specimens were abandoned due to significant increases as compared with the intact condition of the displacement at the cross-point. This was presumably due to possible leakage resulting from pressure measurement. As a result, only five IAP measurements of MCP joints (one little finger, two middle, and two ring fingers) were obtained. The initial IAP value, without load, for each specimen was nearly 0mmHg relative to the atmospheric pressure. The maximum decreases in the IAP, when loaded under conditions of 16 kg of load, ranged from 11.59mmHg to 42.20mmHg. The IAP values against the load and displacement of these five specimens are plotted in Fig 3.5 and Fig 3.6, respectively. The IAP values at the cross-point of each specimen are also marked in the figures. The correlation coefficient between the IAP and load was -0.531 to -0.899 (r = -0.792 ± 0.151). The correlation coefficient between the. 39.
(57) IAP and displacement was -0.942 to -0.993 (r = -0.963 ± 0.029). From Fig 3.5, it can easily be seen that the drop in IAP occurred mostly before the cross-point; there was a 45% to 80% decrease in the IAP before the cross-point. Highly non-linear curves are presented in the IAP load plots, as shown in Fig 3.5, while more linear segments can be observed in the IAP displacement plots shown in Fig 3.6.. Fig 3.5 Load versus IAP with the cross-point marked. Highly non-linear curves are presented in the IAP load plots (r = -0.792 ± 0.151). The IAP decreased rapidly before the cross-point, during 5% to 10% total distraction of load. The IAP then slowly decreased with increasing load. (n=5). 40.
(58) Fig 3.6 Displacement versus IAP. The curve presented a more linear pattern than that of the IAP - load curve (r = -0.963 ± 0.029). (n=5). The data from the pneumatic loading device was not collected on one middle finger due to a malfunction in the Micro CT scanner. Therefore, only data for four fingers (one little, two ring, and one middle fingers) were used for further changes in the joint volume analyses. The necking volume and IAP plot was shown in the Fig 3.7. Correlation among the all necking volume and IAP is highly linear in a negative relation (r= -0.882). The correlation coefficient between the necking volume and IAP in each specimen was range -0.920 to -0.982 (r = -0.951 ± 0.025). The total volume and IAP plot is shown in the Fig 3.8. The correlation coefficient between the total volume and IAP (r = -0.762) was not high such as was observed in the relation between the necking volume and IAP (r = -0.882) or in the relation between the displacement and IAP (r = -0.838) in all specimens. However, the correlation between the necking volume and IAP in each specimens is highly linear in a negative relation (range: -0.960 to -0.994, r = 0.982 ± 0.015).. 41.
(59) Fig 3.7 The necking volume versus IAP. The correlation between the necking volume and IAP in all specimens is highly linear in a negative relation (r= -0.882). (n=4). Fig 3.8 The total volume versus IAP. The correlation coefficient between the total volume and IAP in all specimens was not highly correlation (r = -0.762). However, the correlation between the necking volume and IAP in each specimens is highly linear in a negative relation (range: -0.960 to -0.994) (n=4). 42.
(60) 3.4 Finite element analysis In the preliminary finite element (FE) study, the material properties are assumed to be homogenous, linearly isotropic. The axial displacement is 5.01 mm under a 16 kg axial loading with corresponding values of negative IAP applied. (Fig 3.9 (A)) The axial displacement increased to 5.26 mm when a 16 kg axial loading was applied without the negative IAP (Fig 3.9 (B)). The displacement data are similar the experimental results. The radial deformation of the capsule in the situation when both negative pressure and a 16kg distraction load were applied was 1.88 mm. This value was 1.72 mm when only 16 kg load was applied. The radial deformation ranged from 5 mm in Micro CT measurements. The pattern of capsule deformation was different between these two conditions. Major deformation was observed on the dorsal side and palmar side of the capsule when both the negative pressure and the 16 kg load were applied (Fig 3.10 (A)). The circular deformation on the center of the capsule was observed when only the 16 kg load was applied (Fig 3.10 (B)).. (A). 43.
(61) (B) Fig 3.9 The axial displacement (A) Negative pressure and 16 kg axial loading is applied. (B) Only 16 kg is applied. (A). 44.
(62) (B) Fig 3.10 The radial deformation (A) Negative pressure and 16 kg axial loading is applied. (B) Only 16 kg is applied. The original cross-section images of the joint capsule in initial condition from the results of FE model and the CT image are shown in Fig 3.11 (A). The cross-section images of the joint capsule with axial load distraction from the results of FE model and the CT image are shown in Fig 3.11 (B). A large different was found in the radial deformation of the joint capsule between the finite element model and the CT image with axial load distraction. The geometry and material of the joint capsule is different between the FEM model and specimen.. 45.
(63) (A). (B) Fig 3.11 The cross-section image of MCP joint capsule in FE model and CT image (A) Initial condition (B) under axial distraction load. 46.
(64) CHAPTER 4 Discussion. In the present study, the IAP was measured in the MCP joint under a distraction load. A Micro CT compatible loading device was developed to measure the changes in joint volume. The relation of the IAP and the changes in joint volume was investigated in this study. The effect of IAP on an MCP joint under a distraction load in intact and vented conditions was also investigated. In the present study, the displacement value under 16 kg of load was 4.60 ± 0.80mm for the intact MCP joint. These values are similar to those reported in the literature as measured by radiography during a distraction load of 14-16 kg.. 4.1 The measurement of displacement data from the loading device A custom-made Micro CT compatible loading device was developed in this study. Although a commercially available micro CT compatible loading device exists, the specimen dimensions allowed (18-23mm length and 20mm object diameter) are too small, and therefore, it is not suitable for detecting the volume change in an MCP joint (Object stages for in situ examination: MATERIAL TESTING STAGE http://www.skyscan.be/products/stages.htm) (Evans et al., 2012). The custom-made loading device provided a larger space for the specimen (30-40mm in length and 40mm in object diameter) for purpose of Micro CT scanning. Although the accuracy in displacement measured by a cable displacement. 47.
數據
+7
相關文件
本書總共分成六個章節: 〈第一章、擁有自信〉 ; 〈第二章、設定願景〉 ; 〈第三章、掌握行動力〉 ; 〈第四 章、建立人際關係〉 ;
認知 3-3-1 學生 藉由閱讀及與夥 伴學校討論了解 日本美食節的文 化及相關比賽或 活動內容。. ▲
第三節 研究方法 第四節 研究範圍 第五節 電影院簡介 第二章 文獻探討 第一節 電影片映演業 第二節 服務品質 第三節 服務行銷組合 第四節 顧客滿意度 第五節 顧客忠誠度
檢核表中的相關項度包含:主動工作、準時上下 班、不任意請假、工作專注、遵循操作程序、承 受壓力、接受工作變異等 7 項。對照職重系統來 看,主動工作可由表
第一節 中國和朝鮮的數學交流 第二節
在培養學生語文能力時,要適當引導學生了解聽、說、讀、寫的
紅色框內部份須 由協作學校校長 或負責老師核實 活動實際的開辦 組數、每組節數 及每節時數。.
時值/節奏 力度 速度 音色 織體 和聲 調性
