網路書店使用店配服務消費者之顧客忠誠度
90
0
0
全文
(2) 01234536789:;<=>?@A Customer Loyalty of On-line Bookstores for Consumers of Retailing Delivery Service! ) * OFPQR. Student FYi-Shan Yeh. BCDEFGHI [LMN [-. AdvisorFDr. Cheng-Min Feng Dr. Yu-Kai Huang. !"#$%& #$'()*+ ,-./. A Thesis Submitted to Institute of Traffic and Transportation College of Management National Chiao Tung University in partial Fulfillment of the Requirements for the Degree of Master of Engineering in Traffic and Transportation June 2009 Taipei, Taiwan, Republic of China. STI!UVWXYZ.
(3) 01234536789:;<=>?@A! ! &OFPQR!!!!!!!!!!!!!!!!!!!!!!!!!!!!!!!!!!!!!!!!!!!!!!!!!!!!BCDEFGHI!DE! !!!!!!!!!!!!!!!!!!!!!!!!!!!!!!!!!!!!!!!!!!!!!!!!!!!!!!!!!!!!!!!!!!!!!!!!!!!!!!!!!!!!!LMN!DE! !!! !"#$%&#$'()*+,-\!. ! ]^! _`abc8defg[>h0123ijkklXmnopqqrstugve fwxlsygz{|}0123dmno~•€tugefwxqkkyg•‚ƒ 0„2…†ep‡ˆ‰Š‹Œd•Ž•3678•‘9:;‡ˆ’“d”•– —g˜™š–›45œ678d9:;z•g•Vž–›dg%Ÿ ¡ky¢ƒ d9:;ƒ0„2£¤¥¦453678g•‚ƒ0„§g¨c”••©ª0 123«¬^d§-®—•! !¯)*45°±²³´®—hµH0¶78·¸¢¹36§-78·¸º»g ¢4®—¼½¾d6¿AÀÁg‚ÂÃÄ©ª¬^0123g[>h¼{|} 0123<0¶78·¸r36§-78·¸rÅÆÇÈr78ɉr=>ÊŒArË Ìe¯¼=>?@A<ÍdÎÏgÐzÑÒÓÔÕ0123d1Ö×Ø!•! )*×ØÙÚg[>hi0¶78·¸¢¹§-78·¸˜=>?@Ad ÛÜšÝ`gz{|}~•ËÌe¯˜™=>?@AdÛÜšÝ`gÓÞd× ØBßgàá[>h¼{|}âp0123gãäåiæ¸ƒç• è%dé ê•«£gë˜)*ÙÚgp0123•ß‡ìíïäåd78·¸g Ðzðñ•òw•!! ! Îóôõ!abc8ö!0123ö!36ö!78·¸ö! °÷øùúö!×û–ü®—.
(4) CUSTOMER LOYALTY OF ON-LINE BOOKSTORES FOR CONSUMERS OF RETAILING DELIVERY SERVICE. StudentFYi-Shan Yeh. AdvisorsFDr. Cheng-Min Feng Dr. Yu-Kai Huang. Institute of Traffic and Transportation National Chiao Tung University. ABSTRACT Since electronic commerce has observed considerable growth, the growth rate of BOOKS.com was 65% in 2006 and the amount of business volume was NT $1.15 billion. In addition, the amount of business volume of KingStone on-line bookstore was 0.7 billion with 100% increase. Ordering books on the Internet is obviously becoming a significant market. Retailing delivery (RD) service provides consumers with a self pick-up approach, so it is popular for those who cannot conveniently use home delivery service. Therefore, shopping on the Internet and picking-up at convenience stores is the major logistics model for on-line bookstores in Taiwan. This study used Rasch Model to refine the questionnaire to let the model fit the data well. It also investigates the relationships among e-service quality, logistics service quality, perceived sacrifice, service value, customer satisfaction, switching costs, and customer loyalty of the two major on-line bookstores in Taiwan, BOOKS.com and KingStone. And compare results of these on-line bookstores to find out the differences between them. The empirical results demonstrated that the effects of e-service quality and logistics service quality to customer loyalty of BOOKS.com sample and the effect of switching costs to customer loyalty of KingStone sample are not significant. These results reveal the distinguishing characteristic of these two on-line bookstores. Finally, provide some suggestions to the managers of on-line bookstores to increase the market share.. Keywords: E-commerce, On-line bookstores, Retailing Delivery, Service quality, Rasch Model, SEM.
(5) ý!!þ! )*+ÓÔXgšÿi&!ƒç•"#$%ƒg˜&z•'()À*•+ þ,*"iÓÔXdDC¢¹-.g/&d,-./Š¢012eg3/&d )*+O45ŠVž67•! 89g+þGHIJK¢¹LMNJKdDCg+þGJKiÓÔXgš ÿi&!ƒd:Eg;•<"%=d>Ag'?@&,*oA¢¹BCg+þ LJKi./–D¢¹½¾oEd%FGHgIdBC4Š&d./J¢01 2e•K;g+þ#$%&#$'()*+dLMJKiÓÔXdDCg/& iÓÔXŠN,*ÅO•3+þPQRJK¢¹STUJKi./VW5üS dBC¼XYg/&d,-./J¢Z[2\•! +þ#)+â&åd]^g_ådÎ`¢¹a÷bcddeg/&J¢iÓ ÔXcf.ghg‡ißhjg‡ikWlg‡imnog‡ipqgÓì$ %drrssg˜&z•g'•OtSd«uvdwx•+þ©y%&z{| dâ&g}4~o•g€š•‚dÎ`¢¹XYg3•&f.ghdƒF•þ þ„[N&fi&^…†‚d‡Cg3þþ+ ˆ‰?@&dŠ‹¹+ƒg/ &ÓÔXi"#$%ƒ è%dŒ••! «£þþ&dÕ"¢¹ŽÕd-.gþþ&d•••‘&‡ˆ‘’d“ ”g/&J¢‘£=<•–&—g3þþ˜˜™ššd]^g›œ•h&ž‡ Ÿ•_åd ¡!•! ! PQR! ¢ý! !"#$%&#$'()*+! I!UVWXYZ.
(6) TABLE OF CONTENTS CHAPTER 1 INTRODUCTION ......................................................................1 1.1 RESEARCH BACKGROUND AND MOTIVATION.........................................1 1.2 RESEARCH OBJECTIVE ..................................................................................2 1.3 RESEARCH SCOPE...........................................................................................3 1.4 RESEARCH PROCEDURE................................................................................4 CHAPTER 2 LITERATURE REVIEW .........................................................6 2.1 RETAILING DELIVERY ...................................................................................6 2.2 ON-LINE BOOKSTORE WITH RD...................................................................8 2.3 SERVICE QUALITY..........................................................................................9 2.3.1 TRADITIONAL SERVICE QUALITY............................................................9 2.3.2 E-SERVICE QUALITY .................................................................................10 2.3.3 LOGISTICS SERVICE QUALITY ................................................................14 2.4 PERCEIVED SACRIFICE ................................................................................16 2.5 SERVICE VALUE............................................................................................16 2.6 CUSTOMER SATISFACTION.........................................................................17 2.7 SWITCHING COSTS .......................................................................................18 2.8 CUSTOMER LOYALTY..................................................................................19 CHAPTER 3 RESEARCH DESIGN AND METHODOLOGY ................................... 23 3.1 CONCEPTUAL FRAMEWORK ......................................................................23 3.2 RESEARCH HYPOTHESES ............................................................................24 3.3 CONSTRUCT MEASUREMENT.....................................................................25 3.3.1 E-SERVICE QUALITY .................................................................................25 3.3.2 LOGISTICS SERVICE QUALITY ................................................................26 3.3.3 PERCEIVED SACRIFICE .............................................................................26 3.3.4 SERVICE VALUE.........................................................................................26 3.3.5 CUSTOMER SATISFACTION......................................................................27 3.3.6 SWITCHING COSTS ....................................................................................27 I.
(7) 3.3.7 CUSTOMER LOYALTY...............................................................................27 3.4 QUESTIONNAIRE DESIGN............................................................................27 3.5 SAMPLING PLAN ...........................................................................................30 3.6 DATA ANALYSIS PROCEDURE AND METHODS ......................................30 3.6.1 RASCH MODEL ...........................................................................................30 3.6.2 STRUCTURAL EQUATION MODEL ..........................................................32 CHAPTER 4 RESEARCH ANALYSIS AND RESULTS ................................................35 4.1 DESCRIPTIVE ANALYSIS .............................................................................35 4.1.1 DATA COLLECTION ...................................................................................35 4.1.2 CHARACTERISTICS OF RESPONDENTS..................................................35 4.1.3 MEASUREMENT RESULTS OF RESEARCH VARIABLES.......................38 4.1.4 CHARACTERISTICS OF THE TWO SAMPLE............................................41 4.2 QUESTIONNAIRE REDUCTION....................................................................42 4.3 RELIABILITY AND VALIDITY ANALYSES ...............................................45 4.3.1 RELIABILITY TEST.....................................................................................45 4.3.2 VALIDITY ASSESSMENT ...........................................................................48 4.4 STRUCTURAL EQUATION MODELING ......................................................53 4.4.1 MODEL TEST ...............................................................................................53 4.4.2 PATH RESULTS ...........................................................................................57 4.4.3 EFFECTS ANALYSIS....................................................................................59 4.5 IMPORTANCE-PERFORMANCE ANALYSIS ...............................................61 CHAPTER 5 CONCLUSIONS AND SUGGESTIONS .....................................64 5.1 RESEARCH CONCLUSIONS..........................................................................64 5.2 MANAGERIAL IMPLICATIONS....................................................................66 5.3 RESEARCH LIMITATIONS AND SUGGESTIONS ........................................68 REFERENCES.......................................................................................................69 APPENDIX.............................................................................................................73. II.
(8) LIST OF FIGURES FIGURE 1.1 RESEARCH SCOPE ........................................................................................................................3 FIGURE 1.2 RESEARCH PROCEDURE ............................................................................................................... 4 FIGURE 2.1 RELATIONSHIP OF DISTRIBUTION CENTRE OF RD...................................................................... 6 FIGURE 2.2 DETAILS ABOUT THE GOODS FLOW AND INFORMATION FLOW OF RD..................................... 7 FIGURE 2.3 SWITCHING COSTS TYPOLOGY .................................................................................................. 19 FIGURE 2.4 FOUR COMPETING MODELS ........................................................................................................ 21 FIGURE 2.5 FOUR SERVICE EVALUATION MODELS .....................................................................................21 FIGURE 3.1 CONCEPTUAL FRAMEWORK....................................................................................................... 24 FIGURE 3.2 A GRAPHICAL EXAMPLE OF SEM.............................................................................................34 FIGURE 4.1 CONFIRMATORY FACTOR ANALYSIS OF E-SERVICE QUALITY ................................................49 FIGURE 4.2 CONFIRMATORY FACTOR ANALYSIS OF LOGISTICS SERVICE QUALITY.................................. 51 FIGURE 4.3 PATH RESULTS OF RESEARCH MODEL FOR BOOKS.COM SAMPLE ........................................ 58 FIGURE 4.4 PATH RESULTS OF RESEARCH MODEL FOR KINFSTONE SAMPLE ............................................59 FIGURE 4.5 IMPORTANCE-PERFORMANCE MAP OF E-SERVICE QUALITY FOR BOOKS.COM SAMPLE ..... 62 FIGURE 4.6 IMPORTANCE-PERFORMANCE MAP OF LOGISTICS SERVICE QUALITY FOR BOOKS.COM SAMPLE ................................................................................................................................................62 FIGURE 4.7 IMPORTANCE-PERFORMANCE MAP OF E-SERVICE QUALITY FOR KINGSTONE SAMPLE ........ 63 FIGURE 4.8 IMPORTANCE-PERFORMANCE MAP OF LOGISTICS SERVICE QUALITY FOR KINGSTONE SAMPLE ................................................................................................................................................63. III.
(9) LIST OF TABLES TABLE 2.1 REFINED PZB MODEL.................................................................................................................10 TABLE 2.2 PRACTITIONER DIMENSIONS OF E-SERVICE QUALITY ..............................................................12 TABLE 2.3 A CADEMIC D IMENSIONS OF E-SERVICE Q UALITY..................................................................... 13 TABLE 2.4 D EFINITIONS OF THE NINE CONCEPTS A BOUT LSQ .................................................................. 15 TABLE 2.5 D EFINITION OF THE THREE TYPES OF SWITCHING COST ...........................................................19 TABLE 3.1 MEASUREMENTS OF RESEARCH CONSTRUCTS ..........................................................................28 TABLE 3.2 GOODNESS-OF-FIT MEASURES FOR OVERALL MODEL FIT .......................................................34 TABLE 4.1 PROFILES OF THE SAMPLE (PART I)............................................................................................36 TABLE 4.2 PROFILES OF THE SAMPLE (PART II) ..........................................................................................37 TABLE 4.3 D ESCRIPTIVE ANALYSIS OF RESEARCH VARIABLES ................................................................. 39 TABLE 4.4 PROFILES OF THE TWO SAMPLES ................................................................................................41 TABLE 4.5 ITEM LOCATION AND FIT FOR E-SERVICE QUALITY .................................................................. 43 TABLE 4.6 ITEM LOCATION AND FIT FOR LOGISTICS SERVICE QUALITY ....................................................45 TABLE 4.7 RESULTS OF RELIABILITY TESTS ................................................................................................46 TABLE 4.8 CONFIRMATORY FACTOR ANALYSIS OF E-SERVICE QUALITY .................................................49 TABLE 4.9 CONFIRMATORY FACTOR ANALYSIS OF LOGISTICS SERVICE QUALITY ................................... 51 TABLE 4.10 CONFIRMATORY FACTOR ANALYSIS OF O THER CONSTRUCTS ...............................................52 TABLE 4.11 OVERALL MODEL FIT OF RESEARCH MODEL FOR BOOKS.COM SAMPLE AND KINGSTONE SAMPLE ................................................................................................................................................54 TABLE 4.12 FIT OF INTERNAL STRUCTURE OF RESEARCH MODEL FOR BOOKS.COM SAMPLE................55 TABLE 4.13 FIT OF INTERNAL STRUCTURE OF RESEARCH MODEL FOR KINGSTONE SAMPLE ..................56 TABLE 4.14 PATH RESULTS OF RESEARCH MODEL FOR BOOKS.COM SAMPLE AND KINGSTONE SAMPLE ................................................................................................................................................58 TABLE 4.15 PATH EFFECTS OF RESEARCH CONSTRUCTS FOR BOOKS.COM SAMPLE AND KINGSTONE SAMPLE ................................................................................................................................................60 TABLE 5.1 SUMMARY OF HYPOTHESES TESTING.........................................................................................64. IV.
(10) CHAPTER 1 INTRODUCTION 1.1 Research Background and Motivation After decades of technological development, the Internet is now rapidly reshaping industries and changing business models (Zwick, 2002). With increased usage of the World Wide Web (WWW), on-line shopping is becoming a new trading mode and preferred by consumers. Consumers just need to surf on the Internet, browse some information, and then compare the prices of different merchandise and retailers. Compared to brick-and-mortar environments, the Internet retailers have lower operation cost, and they also offer a more flexible and convenient way for consumers to shop. On-line shopping is now established as a major trend for suppliers and consumers. With this growth in electronic commerce (e-commerce), there are more and more consumers ordering books from on-line bookstores in Taiwan. In contrast to traditional physical bookstores, many of which have gone bankrupt, the average growth rate of on-line bookstores is 80%. For example, the growth rate of BOOKS.com was 65% in 2006 and the amount of business volume was NT $1.15 billion, while business volume of the KingStone on-line bookstore was 0.7 billion, an increased 100%. Because of the more convenient and cheaper shopping channels, ordering books on the Internet is clearly becoming a significant market. The Internet has changed people’s consumption habits (Hsu, 2007). As more and more consumers use Web channels, companies must focus on their e-services, including all cues and encounters that occur before, during, and after transaction (Parasuraman, Zeithaml and Malhotra, 2005). Managers of companies with a Web presence are recognizing the issue of service quality as strategically important (Slywotzky and Morrison, 2001). To deliver superior service quality, managers of companies with a Web presence must first understand how consumers perceive and evaluate online customer service (Parasuraman et al., 2005). The retailing delivery (RD) system provides an easy on-line shopping process, safe payment method and quick delivery service for e-retailing (Feng and Huang, 2006). The RD service also provides consumers with a self pick-up approach for delivery of merchandise, so it is popular for those who cannot conveniently use home 1.
(11) delivery service. Therefore, shopping on the Internet and picking-up at convenience stores is the major logistics model for on-line bookstores in Taiwan, and more than 90% of the customers who order books from on-line bookstores will choose the RD service for their logistics way. However, the BOOKS.com provides only 7-11.com service, and the KingStone on-line bookstore provides CVS.com service which includes three families of convenience stores (Family.com, Hi-Life.com, and OKcvs.com). The retailing delivery (RD) service is very important for on-line bookstores, but these two major on-line bookstores have different RD systems. For this reason, to find out the relationship between logistics service quality and customer loyalty is an important issue for managers of on-line bookstores. Recently, many researchers thought that the existence of switching costs may cause customers to be not loyal who are satisfied with the service, and the loyal customers may be not satisfied with the service. This study aims to use SEM to understand the relationship between website service quality, logistics service quality, switching cost and customer loyalty. It is important to understand the crucial factors in a choice of on-line bookstores for customers since this can help managers to develop strategies to increase their market share.. 1.2 Research Objective Based on the research background mentioned above, there are several objectives of this study: 1. Develop the website service quality and retailing delivery logistics service quality scales for on-line bookstores, and use Rasch model to refine the scales. 2. Use structure equation model (SEM) to investigate the relationship among e-service quality, logistics service quality, perceived sacrifice, service value, customer satisfaction, switching costs and customer loyalty. 3. Confirm the relationships among the research constructs of BOOKS.com and KingStone, and find out the differences between them. 4.. Use Importance-Performance Analysis (IPA) to discuss the relations of level of customers’ expected service quality (importance) and level of customers’ perceived service quality (performance).. 5. Provide suggestions on developing strategies for the managers of on-line bookstores to increase their market share. 2.
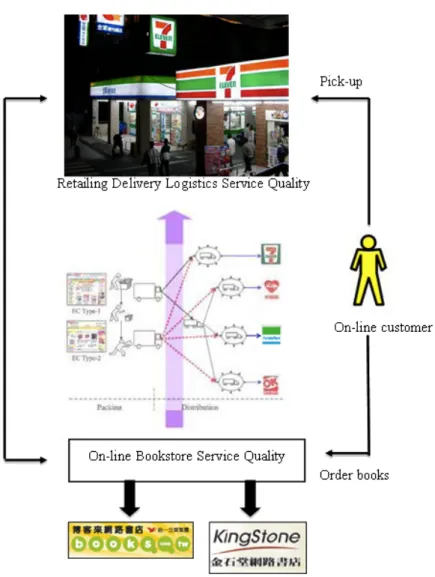
(12) 1.3 Research Scope This study is focus on Business to Customer (B2C) business model. And the purpose is to find out the crucial factors that will influence customer loyalty from customers’ viewpoint. The major research subjects of this study are the main on-line bookstores in Taiwan, BOOKS.com and KingStone on-line bookstore. To understand the opinion of customers, an on-line survey will be administered to the customers of on-line bookstores. The research scope of this study is shown in Figure 1.1.. Figure 1.1 Research Scope. 3.
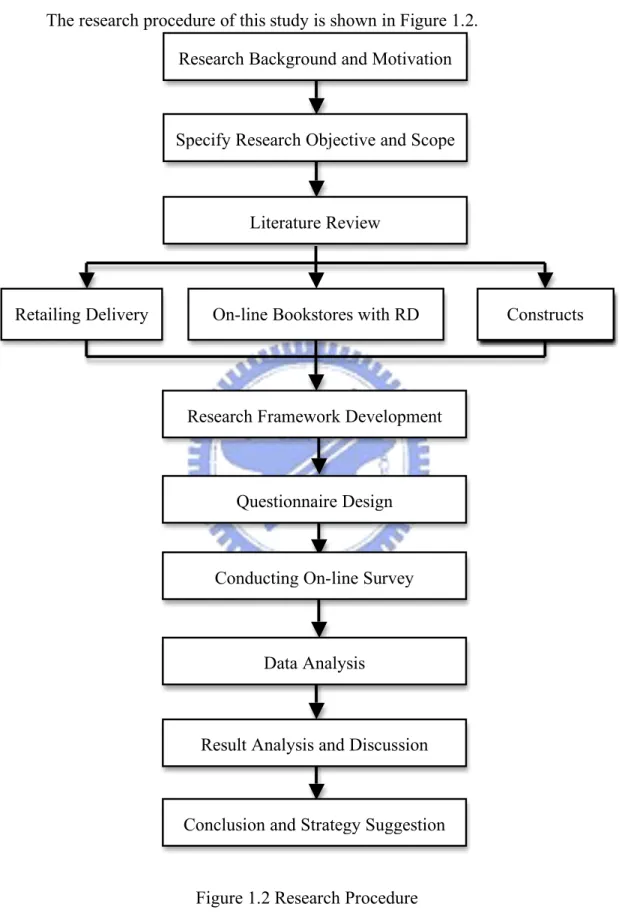
(13) 1.4 Research Procedure The research procedure of this study is shown in Figure 1.2. Research Background and Motivation. Specify Research Objective and Scope. Literature Review. Retailing Delivery. On-line Bookstores with RD. Research Framework Development. Questionnaire Design. Conducting On-line Survey. Data Analysis. Result Analysis and Discussion. Conclusion and Strategy Suggestion. Figure 1.2 Research Procedure !. 4. Constructs.
(14) Chapter1 outlines the research background, motivations, objectives and scope. The remaining of this study is organized as follows: Chapter2 describes some background about on-line bookstore and retailing delivery (RD), in addition, it also introduces the previous literature related to service quality, service value, customer satisfaction, switching costs, customer loyalty. Chapter3 presents the research framework and introduces the research methodology. Chapter4 includes the descriptive results of measurement variables and the results of data analysis. Chapter 5 is a summary of the crucial findings and contributions of this study, moreover it also discusses some limitations of this research. ! ! ! ! ! ! ! ! ! ! ! ! ! ! ! ! ! !. 5.
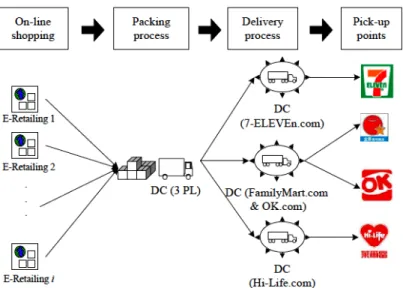
(15) CHAPTER 2 LITERATURE REVIEW 2.1 Retailing Delivery Feng and Huang (2006) described that in the B2C environment, reliable and timely delivery are fundamental objectives for on-line shoppers. In Taiwan, there are many convenience stores, and the retailing delivery (RD) services form a new retail delivery model: “Shopping on the Internet and picking up the merchandise at convenience stores.” The retailing delivery services have made many remarkable successes. In Taiwan, RD has been combined with e-commerce for about eight years, and it is operated by 3PL. The 3PL providers have had to improve the flow of information both internally and externally and integrate their logistics services into the retail delivery provided by convenience stores. CVS.com (a joint venture by three families of convenience stores including Family.com, Hi-Life.com, and Okcvs.com) is an RD provider that began service in the beginning of 1999, and 7-11.com joined this market at the end of 2000. Because of its safe payment method and quick delivery, RD services by convenience stores have played an important role of the e-commerce logistics in Taiwan. The relationship of distribution centre of retailing delivery is shown in Figure 2.1.. Figure 2.1 Relationship of Distribution Centre of RD Source: Feng and Huang (2006) 6.
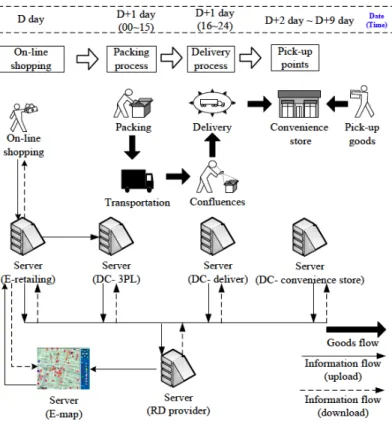
(16) The RD system provides an easy on-line shopping process, a safe payment method, convenient pick-up points and quick delivery service for E-retailing. The RD system has two specific characteristics: consumers can shop on-line even without a credit card, and it provides consumers with a self pick-up approach through convenience stores. Figure 2.2 show the details about the goods flow and information flow of retailing delivery.. Figure 2.2 Details About the Goods Flow and Information Flow of RD Source: Feng and Huang (2006) Step 1 (D day): An on-line shopper chooses a convenience store to pay the money and pick-up the merchandise via the e-map website. Step 2 (D+1 day): The E-retailer uploads the order information to 3PL. Then 3PL must finish the packing process of all orders by 3:00 pm of the D+1 day and transport the orders to the delivery centre before 4:00 pm of the D+1 day. Step 3 (D+1 day): The delivery centre collects the orders from different eretailers and transports the orders to the different convenience stores before 12:00 noon on the afternoon of the D+2 day. Step 4 (D+2 day): According to the information uploaded from the convenience store delivery centre, the E-retailer will notify the customer by e-mail or cell phone about pick-up.. 7.
(17) Step 5 (D+2 day~D+9 day): If on-line shopper picks up the goods from the convenience store, the e-retailer can download the data from the server of RD provider. If not, the RD provider will return the goods to the e-retailer after the D+9 day.. 2.2 On-line Bookstore with RD Most on-line bookstores in Taiwan provide both home delivery and retailing delivery service. Compared to home delivery, retailing delivery service provides consumers a safe payment way, and consumers can pick up their goods whenever they are free within seven days. Therefore, “ordering books on the Internet and picking-up at convenience stores” is the major logistics model of on-line bookstores in Taiwan. There are two RD providers in Taiwan, and on-line bookstores such as BOOKS.com and Yuan-Liou provide 7-11.com service, and others such as KingStone, ESLITE, San-Min, and Silkbook provide CSV.com service. BOOKS.com was the first on-line bookstore in Taiwan and it also was the first to provide retailing delivery service, beginning in 2000. KingStone online bookstore was set up in 1997, and it began to provide retailing delivery service later. The procedure that combines on-line bookstores (E-Retailing) with RD system is illustrated below: 1. On-line shopping After making an on-line purchase, customers must choose a delivery method to receive their orders. Some sites decide the delivery method (home delivery and retailing delivery) according to the typed of goods, while others allow consumers to decide the delivery method. The major on-line bookstores in Taiwan let customers choose between home delivery and retailing delivery service. In general, most customers of on-line bookstores will choose RD service to get their books. 2. Select the pick-up point When customers choose to use retailing delivery system, the 7-11.com or the CVS.com will appear, and customers should select the pick-up point on the e-map provided by RD system. 3. Packing process After the on-line bookstore confirms the orders, it turns over the order for goods to 3PL, and 3PL should help finish the packing process and transport the orders to the delivery centre for the convenience store which is chosen. 8.
(18) 4. Delivery process The delivery centre will collect the orders and transport them to different convenience stores, which are the pick-up points, and then it will report the finished order information to the on-line bookstore. 5. Pick-up goods According to the information replied from delivery centre, the on-line bookstores will notify the customer by e-mail or cell phone message to pick-up their orders. Generally speaking, consumers order goods on D day, and on the D+1 day 3PL will proceed to pack, and consumers can pick up their orders from the convenience store on the afternoon of the D+2 day.. 2.3 Service Quality 2.3.1 Traditional Service Quality A service is an activity or series of activities of more or less intangible nature that normally, but not necessarily, take place in interactions between the customer and the service employee and / or physical resources or goods and / or systems of the service provider, which are provided as solutions to customers problems (Gronroos, 1990). According to Parasuraman, Zeitithaml and Berry (1985), there are four distinguishing characteristics of service: intangibility, inseparability, perish ability, and heterogeneity (variability): Intangibility: Services are performances rather than objects, they cannot be seen, tested, felt, heard, or smelled before purchase. Inseparability: Services cannot be separated from their providers. Perish Ability: Services cannot be stored and carried forward to a future time period. Heterogeneity: Quality of services often vary from producer to producer, from customer to customer, and from day to day. Parasuraman, Zeitithaml and Berry (1985) proposed that service quality is a function of the difference between consumer expectations and actual service performance. They developed a model for service quality by an exploratory investigation of quality in four service businesses. This model is based on the gaps 9.
(19) between consumers and marketers, and it is widely called “PZB model” or “GAP model”. In this study, ten dimensions about service quality were introduced, and then refined into five key dimensions names SERVQUAL in 1988 for measuring customers’ subjective perception of service quality (Table 2.1 ). Original PZB Model (1985). Table 2.1 Refined PZB Model Refined Definition PZB Model (1988). Tangibles. Tangibles. Appearance of physical facilities, equipment, personnel, and communication materials.. Reliability. Reliability. Ability to perform the promised service dependably and accurately.. Responsiveness Communication. Responsiveness. Willingness to help customers and provide prompt service.. Credibility Security Competence. Assurance. Knowledge and courtesy of employees and their ability to convey trust and confidence.. Empathy. The firm provides care and individualized attention to its customers.. Courtesy Understanding Access. The SERVQUAL model has been criticized by some researchers because of the difficulty in replicating its dimensions. In addition, Cronin and Taylor (1992) suggested that expectations were not necessary in the measurement of service quality, thus conceptualizing their own model, called SERVPERF. There are more and more researches start to show more and more support for the exclusion of expectations in measuring service quality (Brady and Cronin, 2001; Dabholkar, Shepherd, and Thorpe, 2000; Mentzer, Flint, and Hult, 2001). The theoretical background of service quality is moving from expectancy disconfirmation to the theory of reasoned action (Collier and Bienstock, 2006). The theory of reasoned action states that individuals’ behavior can be predicted from their attitudes about the behavior and subjective norms (Ajzen and Fishbein, 1980).. 2.3.2 E-Service Quality As the Internet has remained a crucial channel for selling most types of merchandise and services, the issue of understanding electronic services has recently 10.
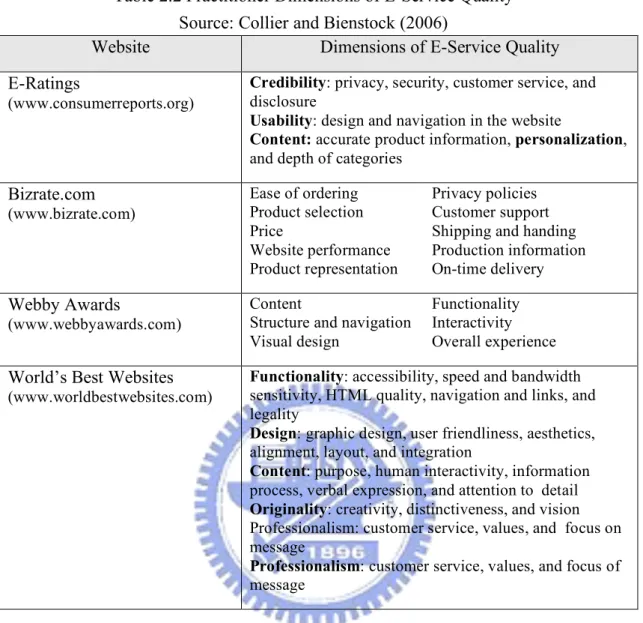
(20) received considerable attention in academic research. Rust and Lemon (2001) described Electronic service (E-Service) as “providing a superior experience to consumers with respect to the interactive flow of information”. Accordingly, on-line service can be divided into a functional dimension (what is delivered in term of service outcome) and a technical dimension (how is it delivered in term of service process), Grönroos et al. (2000) provided a definition of NetOffer model. Many researchers thought that the definition of e-service should include all cues and encounters that occur before, during and after the electronic service delivery (Zeithaml et al., 2002; Parasuraman et al., 2005). E-Ratings, a section of a well-known magazine for rating the quality of products and services, Consumer Reports evaluates the quality of service provided on a website. There are three criteria that E-Ratings use to evaluate a website: credibility, usability and content. Similarly, BizRate.com creates a measurement based on ten dimensions to evaluate e-service quality. The “Webby Awards” from the International Academy of Digital Arts and Science also has their own criteria for evaluating the quality of a website. Final, the award for website quality given by Worldbestwebsites.com evaluates quality by five criteria. The details are shown in Table 2.2. The five dimensions in SERVQUAL and SERVPERF models can measure service quality well in off-line environments, however, on-line services have unique characteristics that should be contained, for example, connectivity and server problems (Collier and Bienstock, 2006). There are more and more researches focus on e-service quality recently. The first definition of e-service quality is that service quality on the Internet is the extent to which a website facilitates efficient and effective shopping, purchasing, and delivery of products and services (Zeithaml, Parasuraman, and Malhotra, 2000). Loiacono, Watson, and Goodhue (2000) developed WebQual, a scale with 12 dimensions to improve the service quality of websites. However, this study generated information for website designers, rather than measuring service quality, so WebQual may be insufficient. Yoo and Donthu (2001) developed a scale called SITEQUAL to measure site quality on four dimensions. Since the data for developing and testing SITEQUAL were gathered from students who did not have to complete the purchasing process, it does not constitute a comprehensive assessment of a site’s service quality. By using an on-line survey, Wolfinbarger and Gilly (2003) developed a scale called eTailQ. This scale of e-service quality has four dimensions: Website design, reliability/fulfillment, privacy/security, and customer service. 11.
(21) Table 2.2 Practitioner Dimensions of E-Service Quality Source: Collier and Bienstock (2006) Website Dimensions of E-Service Quality E-Ratings (www.consumerreports.org). Bizrate.com (www.bizrate.com). Webby Awards (www.webbyawards.com). World’s Best Websites (www.worldbestwebsites.com). Credibility: privacy, security, customer service, and disclosure Usability: design and navigation in the website Content: accurate product information, personalization, and depth of categories Ease of ordering Product selection Price Website performance Product representation. Privacy policies Customer support Shipping and handing Production information On-time delivery. Content Structure and navigation Visual design. Functionality Interactivity Overall experience. Functionality: accessibility, speed and bandwidth sensitivity, HTML quality, navigation and links, and legality Design: graphic design, user friendliness, aesthetics, alignment, layout, and integration Content: purpose, human interactivity, information process, verbal expression, and attention to detail Originality: creativity, distinctiveness, and vision Professionalism: customer service, values, and focus on message Professionalism: customer service, values, and focus of message. Furthermore, Zeithaml, Parasuraman, and Malhotra (2000, 2002) developed eSERVQUAL for measuring e-service quality with seven dimensions, and they also split the dimensions into two separate scales in 2005. One of the scales is the core dimensions: efficiency, system availability, fulfillment, and privacy, which is named E-S-QUAL. The other scale is E-RecS-QUAL, responsiveness, compensation, and contact, focused on the recovery part. They thought that in on-line environments, gaps will exist between service expectations and perceptions, similar to the PZB model: Information gap: The difference between customers’ requirements concerning a website and management’s beliefs about the requirements. Design gap: The failure to fully incorporate knowledge about customer requirements into the structure and functioning of the website.. 12.
(22) Communication gap: A lack of accurate understanding on the part of marketing personnel about a website’s features, capabilities, and limitations. Fulfillment gap: The overall discrepancy between a customer’s requirements and experiences, and it is the only one occurring on the customer side. The overall fulfillment gap stems from a combination of the information, design, and communication gaps. Collier and Bienstock (2006) measured service quality in E-Retailing and they developed a conceptual framework of e-service quality. This research focused not only on website interactivity or process quality but also on outcome quality and recovery quality. It consisted of three second-order dimensions and eleven firstorder dimensions: privacy, design, information accuracy, ease of use, functionality, order timeliness, order accuracy, order condition, interactive fairness, procedural, and outcome fairness. In order to integrate both utilitarian and hedonic e-service quality elements, Bauer, Falk, and Hammerschmidt (2006) developed a transaction process-based scale for measuring service quality (eTransQual). The five dimensions in eTransQual are functional/design, enjoyment, process, reliability and responsiveness. The details are shown below (Table 2.3). Study. Table 2.3 Academic Dimensions of E-Service Quality Dimensions. Sample. WebQual (Loiacono, Watson, and Goodhue, 2000). Information fit to task, Trust, Design, Visual appeal, Flow, Business process, Interaction, Response time, Intuitiveness, Innovativeness, Integrated communication, Substitutability. Students. SITEQUAL (Yoo and Donthu , 2001). Ease of use, Aesthetic design, Processing speed, Interactive responsiveness. Students. eTailQ (Wolfinbarger and Gilly, 2003). Website design, Reliability, Customer service, Privacy. Members of Harris Poll On-line Panel. E-S-QUAL and E-RecS-Qual (Zeithaml, Parasuraman, and Malhotra, 2000, 2002, 2005). Core- Efficiency, System availability, Fulfillment, Privacy. On-line Customers of Amazon/ Walmart. Recovery- Responsiveness, Compensation, Contact. 13.
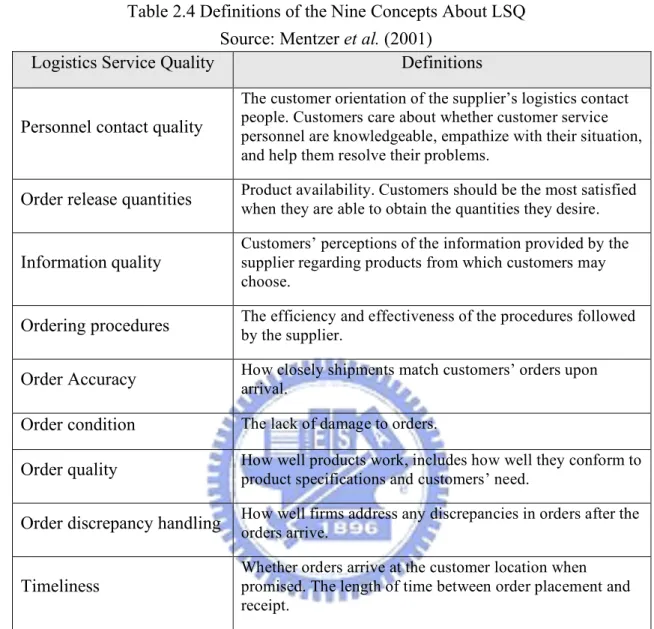
(23) Study E-Service Quality (Collier and Bienstock, 2006). Dimensions Process quality- Ease of use, Privacy, Design, Information accuracy, Functionality. Sample Students. Outcome quality- Order timeliness, Order accuracy, Order condition Recovery- Interactive fairness, Procedural fairness, Outcome fairness. eTransQual (Bauer, Falk, and Hammerschmidt, 2006). Functional/Design, Enjoyment, Process, Reliability, Responsiveness. On-line shopper. 2.3.3 Logistics Service Quality Logistics has been considered an aspect of service with which firms can create competitive advantage (Mentzer and Williams, 2001). Logistics service quality is a key factor of marketing, and it can create customer satisfaction. The “Seven Rs” describe the attributes that a company can offer products and services and create utility through logistics service. In other words, part of a product’s marketing offering is the company’s ability to deliver the right amount of right product at the right place at the right time in right condition at the right price with the right information (Mentzer, Flint, and Kent, 1999). Unlike traditional logistics studies, logistics service studies not only include cycle time, on-time delivery, and inventory availability, but also any handling of individual customer requests beyond traditional service measures (Davis and Mentzer, 2006). Mentzer, Flint, and Hult’s (2001) research in logistics service quality states that service quality perceptions are based on the dimensions of order placement and order receipt, and that is a concept of procedure. Furthermore, the authors provided nine concepts to evaluate logistics service quality (Table 2.4).. 14.
(24) Table 2.4 Definitions of the Nine Concepts About LSQ Source: Mentzer et al. (2001) Logistics Service Quality Definitions Personnel contact quality. The customer orientation of the supplier’s logistics contact people. Customers care about whether customer service personnel are knowledgeable, empathize with their situation, and help them resolve their problems.. Order release quantities. Product availability. Customers should be the most satisfied when they are able to obtain the quantities they desire.. Information quality. Customers’ perceptions of the information provided by the supplier regarding products from which customers may choose.. Ordering procedures. The efficiency and effectiveness of the procedures followed by the supplier.. Order Accuracy. How closely shipments match customers’ orders upon arrival.. Order condition. The lack of damage to orders.. Order quality. How well products work, includes how well they conform to product specifications and customers’ need.. Order discrepancy handling. How well firms address any discrepancies in orders after the orders arrive.. Timeliness. Whether orders arrive at the customer location when promised. The length of time between order placement and receipt.. Most foreign and Taiwan logistics studies about e-retailing have all focused on home delivery, and develop the scale for measuring home delivery logistics service quality (Mentzer et al., 2001, Collier and Bienstock, 2006). Recently, Feng and Huang (2003, 2006) aimed at retailing delivery and used AHP and SEM to analyze consumer behavior intention about on-line shopping. They measured logistics service quality on retailing delivery service for on-line shopping by five dimensions: information quality, ordering procedures, timeliness, order condition and discrepancy handling.. 15.
(25) 2.4 Perceived Sacrifice Sacrifice is defined as what is given up or sacrificed to acquire a service/product (Zeithaml, 1988). The measured scale of the sacrifice can be described as the consumers’ perceptions of the monetary and the non-monetary price when they acquire a service/product. The monetary price is evaluated by a direct measure of the dollar price of the service, and non-monetary price is evaluated by direct measures of time and effort of the service (Cronin, Bredy, and Hult, 2000). Because risk is an inherent part of the cost of the acquisition and use of any service or product, sacrifice is described as a composite of perceived monetary price, perceived non-monetary price, and perceived risk (Cronon et al., 1997).. 2.5 Service Value Zeithaml (1988) described that perceived value is conceptualized as the consumer’s overall assessment of the utility of a product based on perceived of what is received and what is given. She also identified four unique definitions of the value construct by an exploratory investigation: (1) Value is low price, (2) Value is whatever I want in a product, (3) Value is equality I get for the price I pay, (4) Value is what I get for what I give. Overall, value is a trade-off between get (benefits) and give up (sacrifices) something, no matter what is given and what is received vary across consumers. Zeithaml (1988) argued that perceived quality is directly associated with perceived value. Bolton and Drew (1991) extended Zeithaml’s (1988) concept of perceived value and defined it as a function of service quality, sacrifice, and customer characteristics. The customers’ perceived value differs from each other because the monetary and nonmonetary, and their preference and past experiences. Generally, service value may be defined as (Cronon et al., 1997): ServiceValue = f (ServiceQuality,Sacrifice). Sweeney, Soutar, and Johnson (1999) extended previous research and developed a model of perceived value. The empirical results confirmed that perceived product, service quality, and perceived risk lead to perceived value in a service encounter. Therefore, the hypotheses of this study are developed:. 16.
(26) H1: Perceived service quality will impact the perceived service value. H1a: E-service quality will impact the perceived service value. H1b: Logistics service quality will impact the perceived service value. H2: Perceived sacrifice will impact the perceived service value.. 2.6 Customer Satisfaction The performance of a company leads to customer satisfaction with a product or service (Innis and Londe, 1994). Cardozo (1965) thought customer satisfaction may lead to repeat purchases, accept other products in the same product, and give favorable recommendation. Fornell (1992) also described that customer satisfaction can increase customer loyalty and decrease customer churn, reduce the costs of failing marketing and of new customer creation, improve the effectiveness of advertising, and enhance business reputation. Satisfaction is described as “an evaluation of an emotion” (Hunt, 1977). Satisfaction is associated with fulfilled performance expectations (Swan and Combs, 1976), and there are several definitions for customer satisfaction. Oliver (1980) stated that customer satisfaction is a function of expectations and performance, and furthermore, he described that it is not only from the disconfirmation of measurement but also from the emotions of purchasing experience (1981). Fornell (1992) thought that performance is more important than expectation. Customer satisfaction generally means customer reaction to the state of fulfillment, and customer judgment of the fulfilled state (Oliver, 1997). Overall, customer satisfaction is a person’s feelings of pleasure or disappointment resulting from the comparison between perceived and expected product performance. It is always existed two viewpoints of evaluating customer satisfaction: transaction-specific (multiple items scale) and cumulative (overall satisfaction). While transaction-specific satisfaction is identified as a post-choice evaluative judgment of a specific purchase occasion (Oliver, 1980), cumulative satisfaction is an overall evaluation of the firm’s past, current, and future performance (Oliver, 1996; Rust and Oliver 1994). Fornell et al. (1996) introduced the American Customers Satisfaction Index (ACSI) model, and the empirical results showed that service quality and service value are antecedents of overall customer satisfaction. Therefore, the hypotheses of this study are developed: 17.
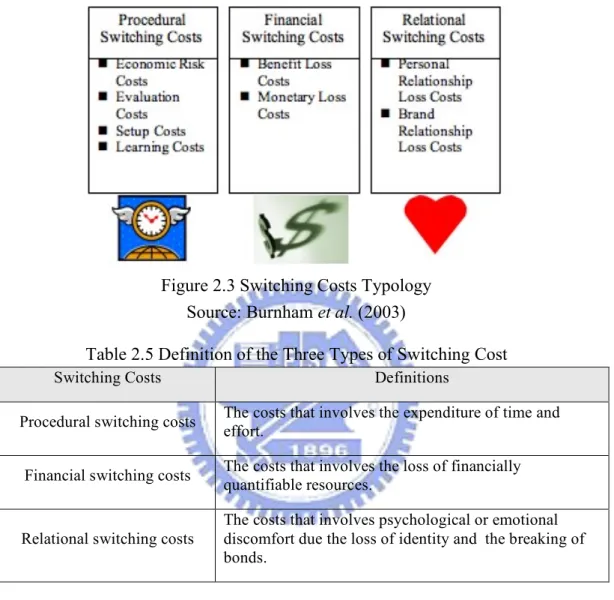
(27) H3: Perceived service quality will impact the customer satisfaction. H3a: E-service quality will impact the customer satisfaction. H3b: Logistics service quality will impact the customer satisfaction. H4: Perceived service value will impact the customer satisfaction.. 2.7 Switching Costs Switching costs can be defined as the costs involved in changing from one provider to another ( Heide and Weiss, 1995). When consumers decide to change the provider, they may consider if it is worth changing. The impediments of changing provider include “search costs, transaction costs, learning costs, loyal customer discounts, customer habit, emotional costs and cognitive effort, coupled with financial, social, and psychological risks on the part of the buyer” (Fornell, 1992). Therefore, when the switching costs are high for customers, they are more likely to choose to remain with their existing provider. Burnham, Frels, and Mahajan (2003) collected numbered of researches and generalized eight distinct switching costs facets: 1. Economic risk costs (Guiltinan, 1989; Jackson, 1985; Klemperer, 1995; Samuelson and Zecjhauser, 1988) 2. Evaluation costs (Samuelson and Zecjhauser, 1988; Shugan, 1980) 3. Learning costs (Alba and Hutchinson, 1987; Eliashberg and Robertson, 1988; Guiltinan, 1989; Wernerfelt, 1985) 4. Setup costs (Guiltinan, 1989; Klemperer, 1995) 5. Benefit loss costs (Guiltinan, 1989) 6. Monetary loss costs (Heide and Weiss, 1995; Jackson, 1985; Klemperer, 1995; Porter, 1980; Weiss and Heide, 1993) 7. Personal relationship loss costs (Guiltinan, 1989; Klemperer, 1995; Porter, 1980) 8. Brand relationship loss costs (Aaker, 1992; Porter, 1980) Burnham et al. (2003) investigated the relationships between the eight switching cost facets and organized them into three higher-order types of switching 18.
(28) cost: procedural switching costs, financial switching costs, and relational switching costs (see Figure 2.3). The definition of the three types of switching cost is shown is Table 2.5. And more simply, switching costs can be separated into financial and non-financial switching costs.. Figure 2.3 Switching Costs Typology Source: Burnham et al. (2003) Table 2.5 Definition of the Three Types of Switching Cost Switching Costs Procedural switching costs. Definitions The costs that involves the expenditure of time and effort.. Financial switching costs. The costs that involves the loss of financially quantifiable resources.. Relational switching costs. The costs that involves psychological or emotional discomfort due the loss of identity and the breaking of bonds.. 2.8 Customer Loyalty Customer loyalty is described as a consumer’s overall attachment or deep commitment to a product, service, brand, or organization (Oliver, 1999). The difference between customer loyalty and behavior intention is that customer loyalty has with a focus on repeat purchasing. Oliver (1997) developed a framework for loyalty and separated loyalty into four distinct, sequential phases. Harris and Goode (2004) collected and analyzed data from two surveys of on-line customers and the results supported the contention that there are four sequential levels of loyalty: 19.
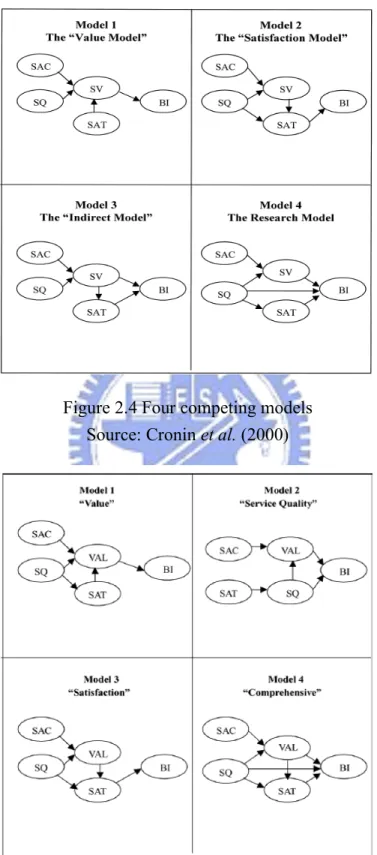
(29) Cognitive loyalty (1st level): It refers to the existence of beliefs that a brand is preferable to others, and it is also called “loyalty based on brand belief”. Affective loyalty (2nd level): It reflects a favorable attitude or liking based on satisfied. Conative loyalty (3rd level): It constitutes the development of behavioral intentions characterized by a deeper level of commitment. Action loyalty (4th level): It relates to the conversion of intentions to action, accompanied by a willingness to overcome impediments to such action. It is generally accepted that loyalty consists of two dimensions: attitudinal and behavioral loyalties (Koo, 2006). The attitudinal loyalty dimension is measured by psychological commitment to the target object, and the behavioral loyalty is measured as a proportion of purchase of a specific brand (Caruana, 2002). Zeithaml et al. (1996) argued that superior service quality leads to favorable behavioral intentions. Cronin et al. (2000) described an empirical assessment of the effects of quality, satisfaction, and value on consumers’ behavioral intentions in six service industries. They reviewed the literature, and presented three competing models based on different research objectives (Figure 2.4). The first model called “Value Model” is based on the service value literature, where value is suggested to lead directly to favorable behavioral outcomes. The second one is “Satisfaction Model” which is derived from the satisfaction literature and defines customer satisfaction as the major and direct determinant of behavioral intentions. The third model called “Indirect Model” is comed from the literature on relationships between service quality, satisfaction, and behavioral intentions. This model shows that the relationship between service quality and behavioral intention is indirect. In order to get a more pragmatic understanding of the relationships among service quality, service value, customer satisfaction, and behavioral intentions, Cronin et al. (2000) developed the fourth model called “Research Model”. They found that service quality, service value, and satisfaction are directly associated with behavioral intention. In addition, service quality and service value are indirectly related to behavioral intentions (i.e., SQ!SV!BI, SQ!SAT!BI, and (SV!SAT!BI). Brady, Knight, Cronin, Tomas, Hult, and Keillor (2005) identified four service evaluation models that are generally used to depict the antecedents to behavioral intentions. The four models include Value Model, Service Quality Model, Satisfaction Model, and Comprehensive Model (Figure 2.5). These models 20.
(30) are somewhat different from the models described in 2000. Brady et al. tested these models by multinational and multi-industry samples, and the result showed that the comprehensive model best captures the identified relationships.. Figure 2.4 Four competing models Source: Cronin et al. (2000). Figure 2.5 Four Service Evaluation Models Source: Brady et al. (2005). 21.
(31) Harris and Goode (2004) also developed a framework of service quality, trust, value, satisfaction, and loyalty, and tested this model by surveying customers in two on-line markets, Books.com and Flights.com. Their research supported associations between service quality and value, service quality and satisfaction, value and loyalty, and satisfaction and loyalty. The hypotheses of this study are developed: H5: Perceived service quality will impact the customer loyalty. H5a: E-service quality will impact the customer loyalty. H5b: Logistics service quality will impact the customer loyalty. H6: Perceived service value will impact the customer loyalty. H7: Customer satisfaction will impact the customer loyalty. Methlie and Nysveen (1999) argued that not only does customer satisfaction have a great impact on customer loyalty, but switching costs may also affect customer loyalty. Lam et al. (2004) developed a framework linking customer value, satisfaction, loyalty, and switching costs in a B2B service setting. The empirical results showed that switching costs have a positive effect on customer loyalty. Therefore, the hypothesis of this study is developed: H8: Switching costs will impact the customer loyalty.. 22.
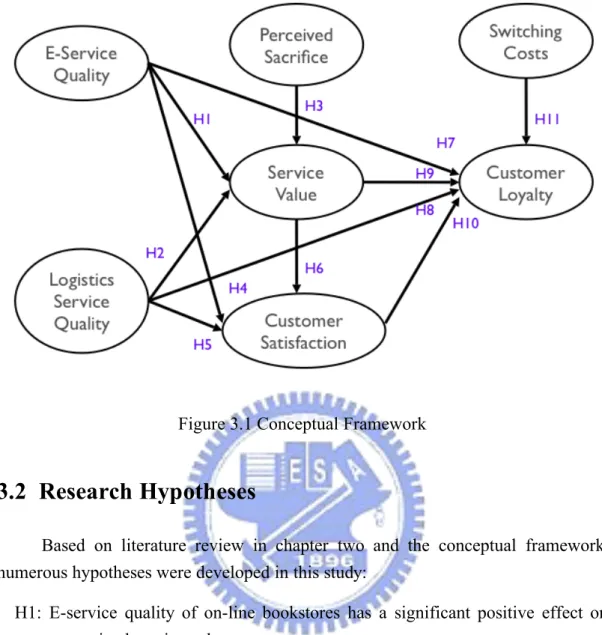
(32) CHAPTER 3 RESEARCH DESIGN AND METHODOLOGY This chapter first introduces the conceptual framework and hypotheses to be tested in this research. Then the construct measurements of research constructs, including e-service quality, logistics service quality, perceived sacrifice, service value, customer satisfaction, switching costs and customer loyalty are presented. Finally, the research methods, including questionnaire development, sampling plan, data collection, and data analysis techniques are described.. 3.1 Conceptual Framework According to research background and motivation, the purposes of this study are to integrate relevant literature and to develop a comprehensive research framework to identify the relationships among key constructs. Figure 3.1 shows the conceptual framework of this study. The literature review in chapter two shows that all of the research constructs such as service quality, perceived sacrifice, service value, customer satisfaction, switching costs, and customer loyalty have direct effects on each other. This study first divided service quality of on-line bookstores into two parts, e-service quality about the websites (on-line bookstores) and logistics service quality about retailing delivery (RD) service. The comprehensive model of four service evaluation models proposed by Brady et al. (2005) is used to depict the antecedents to customer loyalty. Furthermore, switching costs is also a critical antecedent to customer loyalty. If a customer is not satisfied with one on-line bookstore, and the costs of switching to another on-line bookstore are low, the customer will not be loyal. In other words, if the switching costs are high, the unsatisfied customer may not change to other on-line bookstores, but will remain loyal to the original on-line bookstore. Therefore, switching costs are added to the research model.. 23.
(33) Figure 3.1 Conceptual Framework. 3.2 Research Hypotheses Based on literature review in chapter two and the conceptual framework, numerous hypotheses were developed in this study: H1: E-service quality of on-line bookstores has a significant positive effect on perceived service value. H2: Logistics service quality of retailing delivery has a significant positive effect on perceived service value. H3: Perceived sacrifice has a significant positive effect on perceived service value. H4: E-service quality of on-line bookstores has a significant positive effect on customer satisfaction. H5: Logistics service quality of retailing delivery has a significant positive effect on customer satisfaction. H6: Perceived service value has a significant positive effect on customer satisfaction.. 24.
(34) H7: E-service quality of on-line bookstores has a significant positive effect on customer loyalty. H8: Logistics service quality of retailing delivery has a significant positive effect on customer loyalty. H9: Perceived service value has a significant positive effect on customer loyalty. H10: Customer satisfaction has a significant positive effect on customer loyalty. H11: Switching costs has a significant positive effect on customer loyalty.. 3.3 Construct Measurement For the purposes of this study, the following seven major constructs are defined in this section: (1) E-Service Quality, (2) Logistics Service Quality, (3) Perceived Sacrifice, (4) Service Value, (5) Customer Satisfaction, (6) Switching Costs, and (7) Customer Loyalty. The measurement items of these constructs are adopted and modified according to previous researches, and all of them using Likert 5-point scales rating from “strongly disagree = 1” to “strongly agree = 5”.. 3.3.1 E-Service Quality According to Collier and Bienstocks (2006), process quality of e-service quality is customers’ quality evaluations based on the interactive process that takes place on the Internet. Then e-service quality in this study is defined as the interaction of a customer and an on-line bookstore when the customer entered the on-line bookstore to order books, and that is the website service quality provided by the on-line bookstores. Moreover, Collier and Bienstocks (2006) used five dimensions to measure process quality, and hence this study adopts and modifies the definitions of these five dimensions, described as follows. (1) Ease of use, the on-line bookstore’s ability to enable customers to find information or enact a transaction with the least amount of effort; (2) Privacy, the on-line bookstore will not share information with third parties unless the customer gives permission; (3) Design, the visual appearances and audible applications of the on-line bookstore; (4) Information, information provided by the on-line bookstore regarding products or services is sufficient and accurate; (5) Functionality, the online bookstore’s ability to execute customer comm.ands and provide customers the function of choosing.. 25.
(35) To measure customers’ perceptions of this construct, 27 questionnaire items are employed. These 27 items are mainly adopted and modified based on the studies of Collier and Bienstocks (2006) and of Parasuraman, Zeithaml, and Malhotra (2005), and they are categorized into the above-mentioned five dimensions. Table 3.1 displays the questionnaire items for e-service quality.. 3.3.2 Logistics Service Quality Logistics service quality is customers’ quality evaluations of delivery, and it is similar to the definition of outcome quality by Collier and Bienstocks (2006), customers’ evaluations of how the products or services are delivered. Then logistics service quality in this study is defined as how the books or services are delivered after the customers have ordered books, and that is the service quality about retailing delivery service provided by the on-line bookstores. To measure customers’ perception of logistics service quality, 15 questionnaire items are adopted and modified according to the studies of Mentzer, Flint, and Hult (2001), Collier and Bienstocks (2006), and Feng and Huang (2003, 2006). These 15 items are categorized into four dimensions described as follows. (1) Information Quality, the information provided by the RD provider regarding delivery is sufficient and accurate; (2) Timeliness, whether the books or services are received within the expected amount of time; (3) Order Condition, how closely the books or services match customers’ order, and the lack of damage to the books; (4) Personnel Contact Quality, whether the staff of convenience stores are knowledgeable and have a good manner. Table 3.1 displays the questionnaire items for logistics service quality.. 3.3.3 Perceived Sacrifice According to Zeithaml (1988), the definition of perceived sacrifice in this study is what is given up or sacrificed when ordering books in the on-line bookstore, and including monetary and non-monetary costs. To measure customers’ perception of sacrifice, this study adopts 3 questionnaire items based on Cronin et al. (2000). Table 3.1 displays the questionnaire items for perceived sacrifice.. 3.3.4 Service Value Following Zeithaml (1988), service value in this study is defined as the overall assessment of utility of books or services based on perceived of what is received and what is given, and this is a trade-off between benefits and sacrifices. To measure customers’ perception of service value, 3 questionnaire items are employed, 26.
(36) and these items are adopted based on the study of Dodds, Mornoe, and Grewal(1991). Table 3.1 displays the questionnaire items for service value.. 3.3.5 Customer Satisfaction Following Oliver (1981), customer satisfaction in this study is defined as customers’ overall evaluation of their feelings after ordering books in the on-line bookstore. There are 3 questionnaire items used to measure customers’ perception of satisfaction, and these items are according to the studies of Cronin et al. (2000) and Tsai et al. (2006). Table 3.1 displays the questionnaire items for customer satisfaction.. 3.3.6 Switching Costs According to Heide and Weiss (1995), the definition of switching costs in this study is the costs involved in changing from the original on-line bookstore to another, including both financial and non-financial costs. To measure customers’ perception of switching costs, this study adopts 5 questionnaire items based on the studies of Burnham et al. (2003) and Feng and Huang (2006). Table 3.1 displays the questionnaire items for switching costs.. 3.3.7 Customer Loyalty According to Oliver (1999), customer loyalty in this study is defined as the overall attachment or deep commitment to the on-line bookstore, including repeat purchasing and recommendation. In addition, the 4 questionnaire items are used to measure customers’ perception of loyalty, and these items are based on the studies of Collier and Bienstocks (2006) and Parasuraman, Zeithaml, and Malhotra (2005). Table 3.1 displays the questionnaire items for customer loyalty.. 3.4 Questionnaire Design First, to understand respondents’ experience of ordering books in the on-line bookstore, 7 questionnaire items are employed. Then, as discussed in section 3.3, a 60-items survey questionnaire is developed to measure the research constructs in this study: “e-service quality (27 items),” “logistics service quality (15 items),” “perceived sacrifice (3 items),” “service value (3 items),” “customer satisfaction (3 items),” “switching costs (5 items),” and “customer loyalty (4 items).” All of these. 27.
(37) items using Likert 5-point scales. Besides, the demographics of the respondents are also contained. Table 3.1 Measurements of Research Constructs Constructs. Measurement Items. Literature Based. Ease of Use I can find the books what I need by using search engine easily. The site records all the books I have ever browsed, and it allows me to browse them again conveniently. The hyperlinks make it convenient to browse the books that interest me. The shopping procedure is easy to understand. It enables me to complete a transaction quickly. The site is simple to use. Privacy There are special measures for protecting information about my online transaction. My personal information will not be stolen or disclosed. Advertisements will not be mailed to me without my permission The site has passed a security review and has the secure symbols. Design. E-Service Quality. The site is attractively designed and is visually pleasing. The display of objectives and graphics is appealed. The site can provide most of the covers of books, and it makes the pages look more orderly. The text and graphics are clear and easy to understand. Information The information about books is accurate. The site provides information about new books. The site provides information about best-selling books. The information about books is sufficient. The site will send an e-mail or message to me to confirm my book order. I can follow the conditions of my orders. The site provides complete illustrations for returning and changing books. Functionality The site loads its pages quickly. It provides the functions for interaction. It gives me numerous options of merchandise other than books. It provides numerous premiums, like bonuses and e-coupon. It gives me numerous options for payment. It gives me numerous options for delivery.. 28. PZM(2005) Collier and Bienstock (2006) Dadize et al. (2005) Bauer, Falk, and Hammerschmidt (2006).
(38) Constructs. Measurement Items. Literature Based. Information Quality The e-map interface lets me choose a pick-up point conveniently. It gives me numerous options to choose the pick-up point. The information of convenience stores on the e-map is accurate. After my books arrived at the convenience store, it will send a message to remind me to pick up the books. Timeliness When I use an e-map, the information is processed quickly. Time between ordering books and receiving books is short.. Logistics Service Quality. Books arrive on the date promised. Order Condition It reliably delivers my books to the convenience store I chose. When I pick-up the books I ordered, the bar code information is accurate and can be read.. Mentzer, Flint, and Hult (2001) Collier and Bienstock (2006) Feng and Huang (2006). Damage rarely occurs during transportation of my books. The books I received are undamaged. Personnel Contact Quality When I pick up, the convenience store staff can quickly find the books I ordered. When I pick up, the convenience store staffs have good manners. The convenience store staffs have good manners even though they are busy. When there is a problem with delivery, the convenience store staff can immediately tell me what to do.. Perceived Sacrifice. Service Value. I think the prices charged for ordering books from this on-line bookstore are reasonable. I think ordering books in this on-line bookstore does not take much time. I think ordering books in this on-line bookstore is easy. I think that the service provided by this on-line bookstore compared to the price I had to pay is acceptable. I think that it is more worthwhile to use this on-line bookstore than others.. Cronin et al. (2000). Dodds et al. (1991). Compared to the price, I think the service provided by this on-line bookstore is very valuable. In general, the service from this on-line bookstore conformed to my expectations. Customer Satisfaction. In general, I am satisfied with the service that this on-line bookstore provided. Shopping on this on-line bookstore is a wise decision.. 29. Cronin et al. (2000) Tsai et al. (2006).
(39) Constructs. Measurement Items I am used to choosing the same on-line bookstore to order books. I feel troublesome about some procedures for joining a new on-line bookstore to order books.. Switching Costs. If I choose another on-line bookstore, the pick-up place is not convenient for me. If I choose another on-line bookstore, I will lose some premiums. If I choose another on-line bookstore, I need to spend some effort to know the service well.. Customer Loyalty. I will recommend this on-line bookstore to my friends. If I want to buy books, I will choose this on-line bookstore first. I am willing to do other business in this on-line bookstore. Compare to other on-line bookstores, I prefer this on-line bookstore.. Literature Based. Burnham et al. (2003) Feng and Huang (2006). PZM(2005) Collier and Bienstock (2006). 3.5 Sampling Plan The research sample in this study was people who have previously ordered books from on-line bookstores, specifically BOOKS.com and KingStone, and then picked up their books at convenience stores. The sampling was conducting by online surveys to collect sample data from the target population. The on-line survey generates raw data automatically in a database, and it can save much time and avoid human mistakes when coding data.. 3.6 Data Analysis Procedure and Methods In order to investigate the objectives and test the hypotheses of this study, SPSS and AMOS software were used to help us analyze the collected data. Furthermore, freeware ConstructMap was also employed to reduce the questionnaire items.. 3.6.1 Rasch Model Rasch model is a method for analyzing data from assessments to measure things such as abilities, attitudes, and personality traits. Rasch model is the most basic and the simplest model of item response theory (IRT), and is firstly proposed by Georg Rasch in 1960. Rasch model has only two ingredients, one ability parameter Bn for each person n and one difficulty parameter Di for each item i . These parameters are used to determine the probability of person n succeeding on. 30.
(40) item i through log-odds. The equation below considered only dichotomous responses:. ln. P (1Bn ,Di ). P (0 Bn ,Di ). = Bn ! Di. where, P (1Bn ,Di ) is the probability of a “Yes” response to item i and P (0 Bn ,Di ) is the probability of a “No” response. When Bn > Di , the probability of a “Yes” response is more than 50%. When Bn = Di , the probability of a “Yes” response is 50%. When Bn < Di , the probability of a “Yes” response is less than 50%. In Rasch model, the estimation of the parameter Bn and Di will not be affected by each other. And this mathematical property is called “test-free” and “person-free” or “sample-free” measurement. It implies that the difficulty parameter of an item does not depend on the ability distribution of the sample, and the ability parameter of a person does not depend on the set of test items (Prieto, Alonso, and Lamarca, 2003). In addition to dichotomous responses, Rasch model has been modified to be applicable to polytomous rating-scale instrument, such as Likert scales. The Polytomous Rasch model views one multinomial-choice problem as several binary choice problems and it can be divided into two different models, Rating Scale Model (RSM) and Partial Credit Model (PCM). The rating scale model is used for instruments in which the definition of the rating scale is the same for all items, while the partial credit model is used when the definition of the rating scale differs from one item to another (Chang and Wu, 2008). In rating scale model, it modified the original difficulty parameter Di to Dix , and that represents the threshold of rating category x !1 to category x of item i . Therefore, the log-odds of the probability that a person responds in category x for item i , compared with category x !1 can be represented:. ln. Pnix = Bn ! Dix Pni( x!1). The partial credit model is similar to the rating scale model except that each item i has its own threshold parameters Fix , for each category. So the parameter Dix is refined: Dix = Di + Fix. and the partial credit model becomes 31.
(41) ln. Pnix = Bn ! Di ! Fix Pni( x!1). Outfit (outlier-sensitive fit) and Infit (information-weighted fit) statistics are the most widely used diagnostics Rasch fit statistics. The comparison is with an estimated value that is near to or far from the expected value. They are reported as Mean-Squares (MNSQ), that is, the chi-square statistics divided by their degrees of freedom. If X is an observation, E is the expected value based on Rasch parameter estimates, and ! 2 is the variance of expectation, then the squared standardized residual is: z2 = (X ! E ) " 2 2. The Mean-Square Outfit statistics is obtained by the summed squared standardized residual with divided by total observation number N :. ! (z ) Mean-Square Outfit = 2. N. In addition to the Outfit statistics, the Infit statistics weights the squared residual by its variance ! 2 . It can be calculated as:. " (z ! ) Mean-Square Infit = " (! ) 2. 2. 2. Furthermore, the Outfit and Infit can be expressed as normalized residuals (Zstd) via a transformation into a t-statistic with an approximate unit normal distribution. The usually acceptable criteria of the fit statistics are 0.7 ! MeanSquare ! 1.3 and -2 ! Zstd ! 2.. 3.6.2 Structural Equation Model Structural equation model (SEM) is also called causal model, causal analysis, simultaneous equation model, analysis of covariance structures, path analysis, and confirmatory factor analysis. SEM is used to explain the relationships between a set of latent (unobserved) constructs, each measured by one or more observed variables (Reisinger and Turner, 1999). The observed variables can be directly measured, but the latent variables are not directly observed like attitudes, customer satisfaction, perception of value or quality.. 32.
(42) SEM is a multivariate technique combining aspects of multiple and factor analysis. When using SEM, latent variables can be separated into “exogenous” (independent) variables and “endogenous” (dependent) variables, and there existing several linear regression equations that describe how the endogenous variables depend on the exogenous variables. SEM encourages confirmatory rather than exploratory modeling, so it is critical that all construct of SEM must be directed by theory for model development and modification. SEM is characterized by two components: the measurement model and the structural model. SEMs are most often represented graphically. Figure 3.2 show a graphical example of a SEM: 1. Measurement model represents the relationship between observed variables and latent variables including the relationship between latent endogenous construct and measured dependent variable, and the relationship between latent exogenous construct and measured independent variable. The equations are shown below:. y = !y * " + # x = !x * " + #. Where x - measured independent variable y - measured dependent variable ! - latent exogenous construct explained by x-variables ! - latent endogenous construct explained by y-variables. ! - error for x-variable ! - error for y-variable ! - correlation between measured variables and all latent constructs 2. Structural model includes the relationships among the latent constructs including exogenous construct and endogenous construct. The equation is shown below:. ! = " *! + # *$ + % Where ! - latent endogenous construct. ! - latent exogenous construct ! - correlations between endogenous latent constructs ! ! - correlation between latent constructs ! (exogenous) and ! (endogenous). ! - structural error term. 33.
數據
+7

相關文件
Therefore, this research is for the purpose of understanding the service of privatization nursery, discussing parents’ satisfaction with service quality and finding the
This study aims to explore whether the service quality and customer satisfaction have a positive impact on the organizational performance of the services and whether the
Service quality, customer satisfaction and customer loyalty are also different while people used Taipei Smart Card in different situation.. We suggest that the Taipei Smart
The study combined the concepts of Kano’s two-dimensional quality model and IPGA to classify online service quality factors for online sporting goods stores and
And we also used company image, service quality perceived quality, customer satisfaction, customer loyalty, and customer complaint to measure the car customer
In this study, Technology Acceptance Model (TAM 2) is employed to explore the relationships among the constructs of the model and website usage behaviors to investigate
This study evaluates the service quality gap of leisure farms through the consumers' ideas, and applies Kano’s two-dimensional quality analysis to not only explore service
This study intends to use the Importance-performance and gap analysis (IPGA) to analyze the factors key to the improvement of the service quality provided by
