Department of Business Administration
I-Shou University
Master Thesis
Analysis of related factors to employee satisfaction at
Vietinbank
Advisor
: Ph.D Chiao - ping Bao
Advisor
: Dr. Nguyen Quan Vinh
Graduate Student
: Vu Hong Nhat Trang
Acknowledgement
For the success of this essay, I would like to show my deepest gratitude to Mr Nguyen Quang Vinh and professor Chiao – Ping Bao who guided me through writing the Graduation report. I would like to thank teachers in the International relation Department of Hanoi Business and technology university who whole-heartedly gave me precious knowledge during my study. The valuable knowledge which I had after the study not only served me well during the study of my graduation paper but also gave me experience in my life. I also thank Board of Director of Viettinbank who created favorable conditions for me during my study. Last but not least I wish all teachers health and success in their career and all staffs in Viettinbank the best in their life and business.
Abstract
With the powerful of integration of recent times in various fields, especially the banking sector, the banks need to prepare to improve the competitiveness of domestic banks. To obtain a guaranteed workforce both in quality and quantity, the banks need to develop a strategic development of human resources in line with their development. The objective of this research is establishing assessment model of employee satisfaction in banking sector and Understanding the factors that affect employee satisfaction and assessing the situation on the satisfaction level of employees in recent years. This paper propose solutions to improve the efficiency of corporate governance for banks in the near future. This research result indicates that that employee satisfaction is impacted by 7 factors Salary, Work feature, Leadership, Colleague, Training and promotion, Working, Welfare. Thus hypothesis H1 to H7 is accepted. However, From the t-test and anova result indicate that there are not differences among Socio-demographics and ANOVA satisfaction.
Table of Contents
Acknowledgement ... i
Abstract ... iii
Table of Contents ... v
List of Tables ... vii
List of Figures ... viii
Chapter I INTRODUCTION ... 1 1.1 Background ... 1 1.2 Research objectives ... 2 1.3 Research questions ... 2 1.4 Research implication ... 2 1.5 Thesis structure ... 3
Chapter II: LITERATURE REVIEW ... 4
2.1 Employee satisfaction definitions ... 4
2.2 Employee satisfaction theory ... 5
2.3 Factors affect employee satisfaction ... 8
2.4 Hypothesis and research frame work development ... 9
Chapter III. METHODOLOGY... 11
3.1 Construction scale and questionnaire ... 11
3.1.1 Construction scale ... 11 3.1.2 Questionnaire ... 11 3.2 Sampling ... 12 3.3 Methods of analysis ... 12 3.3.1. Descriptive statistics ... 12 3.3.2. Scaling ... 13 3.3.3. Factor analysis ... 13 3.3.4. Analysis of variance ... 13
Chapter IV DATA ANALYSIS ... 14
4.1 Characteristic of respondent ... 14
4.2 Reliability test ... 15
4.4. Hypothesis testing ... 18
4.4.1 Evaluate the fit of the linear regression model ... 18
4.4.2 Regression model analysis ... 19
4.4.3 T-test and ANOVA ... 21
Chapter V CONCLUSION AND RECOMMENDATION ... 24
5.1 Conclusion ... 24
5.2 Recommendations ... 25
5.3 Research contribution ... 26
Reference ... 27
List of Tables
Table 4.1 Respondent background ... 14
Table 4.2 Cronbach alpha test ... 15
Table 4.3 Correlation coefficient ... 18
Table 4.4. Model summary variable regression ... 19
Table 4.5. Anova result of Multiple variable regression model ... 19
Table 4.6 Regression result ... 20
Table 4.7 Differences between gender and job satisfaction ... 22
Table 4.8 The differnent of employee satisfaction among age group ... 22
Table 4.9 Differnent of employee satisfaction among education level group ... 23
Table 4.10 differences among working experience and job satisfaction ... 23
List of Figures
Chapter I INTRODUCTION
1.1 Background
The establishment of the ASEAN Economic Community (AEC) and to be a member of TPP Trans-Pacific Partnership Agreement in 2015 has important implications in the process for Vietnam integration. With the liberalization of goods, services, investment and capital flows, the AEC and TPP are expected to provide opportunities for financial markets development and the economy of the countries in general and Vietnam in particular. (Brock R. Williams, 2016) According to information from the center of WTO of Vietnam Chamber Of Commerce And Industry (VCCI, 2015)1 from 2015, the free trade agreement (FTA), bilateral and multilateral, which Vietnam has signed is 11 agreements (which include the AEC, ASEAN-China, Vietnam-Union Eurasian economic, ...), are negotiating is 5 (which includes: TPP, Vietnam-EU, ....) and is considering the agreement between ASEAN and Canada.
Also, according to the VCCI, commercial banks (CBs) and foreign banks are allowed to establish 100% foreign investment or a branch in Vietnam if they meet the conditions of minimum total assets. From 01/01/2011, branches of foreign banks have been allowed to take deposits Vietnam dong (VND) at the same rate of domestic banks. Foreign investors are buying shares of joint stock banks in Vietnam or state-owned banks in Vietnam are equitized, however the total number of shares owned by foreign banks does not exceed 30% of the capital.
With the powerful of integration of recent times in various fields, especially the banking sector, the banks need to prepare to improve the competitiveness of domestic banks. In order to meet the competition requirements in terms of integration, human resource must be not only meet the requirements in terms of quantity but to ensure the quality (Thanhh, and Thi, 2014). To obtain a guaranteed workforce both in quality and quantity, the banks need to develop a strategic development of human resources in line with their development needs, including: The structure and arrangement, staffing capacity, qualifications, practical experience in line with business requirements in the immediate and long term. Research and application of modern information technology in the management of human use effectively, evaluate the staff attached to professional ethics standards (Dang-Thanh, 2012). Focus on training, fostering their professional qualifications, professional skills, managerial and executive capacities, knowledge of foreign languages and the ability to apply modern
1VCCI
technology, gradually improve the quality human resources evenly and steadily towards synthesis and specialized medium, capable of highly competitive, always towards customers. Improving the retention policy of human resources as: working condition, salary, welfare ... in order to satisfy employees‟ devotion for improving productivity ((Thanh and Thi, 2014). There are policies to attract professionals, good employees and retain these objects through better remuneration as salary, bonus, promotion opportunities.
Making the satisfaction to employees is becoming more urgent than ever because it was so important purpose in the present context it is employee retention. And to examine the degree of employee satisfaction banking sector to enterprises and their work they are undertaking and making the banks have the facility to evaluate human resources policies and its business image for labor market (Pham, 2010). For Vietinbank - a bank is focused on exploiting the strengths of the human factor - customer satisfaction inside and outside is considered one of the key tasks in the context of fierce competition.
1.2 Research objectives
- Formalized the theories of employee satisfaction
- Establishing assessment model of employee satisfaction in banking sector
- Understand the factors that affect employee satisfaction and assessing the situation on the satisfaction level of employees in recent years. Since then propose solutions to improve the efficiency of corporate governance for banks in the near future.
1.3 Research questions
This thesis is going to answer flowing research questionnaire:
- Is there any relationship between the features of work and employee satisfaction? - Is there any relationship between working conditions and employee satisfaction? - Is there any relationship between salary and employee satisfaction?
- Is there any relationship between training and promoting and employee satisfaction? - Is there any relationship between Welfare policies and employee satisfaction? - Is there any relationship between colleague relationship and employee satisfaction? - Is there any relationship between leadership impact on employee satisfaction?
1.4 Research implication
- Additional theoretical f empirical evidence in assessing employee satisfaction for the banking sector of Vietnam
- To enriching the satisfaction evaluation system of Vietinbank and for other banks refer to perfect the human resources management
1.5 Thesis structure
Chapter 1: Provide the intruductiong of thesis
Chapter 2: Overview of literature related to employee satisfaction Chapter 3: Show the methodology of thesis
Chapter4: Analysis the data collected
Chapter II: LITERATURE REVIEW
2.1 Employee satisfaction definitions
There are so many different concepts about the satisfaction of. The work is not only a major source of income but also an important component of life. Research by Smith (2007) indicated that work plays a central role in the lives of many people. Therefore, according to Smith, satisfaction with one's job is an important component in the overall well-being of workers. Lee, & Kim, (2010) defined job satisfaction is a state in which employees feel and satisfying to do the job with goals effective and clear direction. He also said that job satisfaction is influenced by three factors combined, which is the expected value of work and means of work. Job satisfaction is also reflected in the attitude towards work that employees shown the love through the evaluation factors: salary, opportunities for advancement, superior, relationships with colleagues, satisfied with the work itself (Castanheira, 2014) and is evaluated through the job description index (JDI). The satisfaction of the employees is the degree of trying to maintain workers' work ưorkers feel satisfied with training opportunities for promotion; satisfied with the supervision of their superiors and satisfied with the relationship colleague (Castanheira, 2014). The satisfaction of the employees is represented by two groups of factors, factors inside and outside, through the common criteria such as working conditions and methods of teamwork (Kinicki, McKee-Ryan, Schriesheim, & Carson, 2002).). To measure the satisfaction, the researchers also used the scale factors including: the nature of work, income (wages and benefits), opportunities for training and advancement and recognition of job performance, working conditions, colleagues and supervisors.
Kusku (2003) shows that employee satisfaction reflects the extent to which the needs and desires of individuals are met and felt by other employees. According to Staples and Higgins (1998), employee satisfaction is generally perceived by the scope of the work and all the pot with a positive attitude working environment. Gruneberg (1979) concluded that since human beings spend much of their time for work, an understanding of the factors related to their satisfaction at work is very important for improving the situation better current status. So give up the satisfaction of employees can be summarized as a response to the needs and wishes of people in the work environment. When the needs and desires are met heavy like the satisfaction of employees will be increased and this will impact on profit in the service profit chain.
The definition of satisfaction Weiss, Dawis, & England, (1967) is full and more extensive: job satisfaction in the work attitude expressed in comments, beliefs and behaviors of employees. The definition of satisfaction with the composition of the Kreitner and Kinicki (2007) satisfaction with components such as the feature of work, training opportunities and promotion, leadership, colleagues, salary, job position, the remuneration, and the reward. In summary the job satisfaction of employees get when they feel excited, relaxed and show positive response to his work aspects.
2.2 Employee satisfaction theory
Maslow (1943, 1954) said that human water driven by many different needs and these needs are hierarchical decentralized model below. Maslow was divided into 5 rank needs in a defined order.
According to Maslow, the most basic needs must be satisfied before the higher level needs, and when a need has been met, it will become less important and it is the direction to demand at higher levels.
Maslow‟s hierarchy lists the following five levels of needs:
Physiological needs: This level of needs deals with the basic necessities of human survival like food, clothing and shelter. If a person does not fulfill these needs he will cease to function.
Safety: Once the first level needs are met, a person feels the need to have a life of security where safety in all aspects of life is ensured.
Social needs: This deals with the innate need to feel as if one belongs in a chosen social group and in various other relationships that are a part of human life. There is a need to be accepted or otherwise people are prone to negative effects like depression & loneliness. Esteem: Deals with the need to feel good about oneself and getting recognition from others. A lack of these needs will result in an inferiority complex and helplessness.
Self-actualization: Becoming the best one can be. Here the need is to maximize ones potential. Frederick Herzberg (1959) developed a theory of motivation is another popular theory two factors. Between the two elements that are neutral, which means that workers do not express satisfaction or dissatisfaction of her. The first is the maintenance factor, it involves the presence or absence of the elements of the job dissatisfaction, such as working conditions, wages, the mode of the company, the relationship between individuals. The second is the motivational factor is the need to promote a high level, it consists of: achievement, recognition, responsibility, and opportunity for advancement.
It is important to understand that employees are not unmotivated by hygiene factors, but feel dissatisfied without them. People are only driven by what Herzberg identified as motivation factors which give a deeper sense of achievement and meaning.
A badly managed team with poor working conditions and low pay would not motivate any employee. Hygiene Factors are basic needs of every employee that an employer must satisfy before they can start looking at motivation. Insure hygiene factors are sufficient enough so employees don't become demotivated. Ensure work is rewarding and challenging to motivate employees to work harder. Continually develop employees to keep motivation high. Reward and Recognise high achieving employees. If possible rotate employee's roles to keep Job interest high. Insure employees have training resources to continually develop themselves Not every employee will have the same motivation factors, it is important to identify what motivates each different employee so you can work towards satisfying their needs.
The implication of the theory of two factors for managers is very clear. Whether maintenance factor will eliminate dissatisfaction (disgruntled) employees, but it also does not stimulate the employees achieve great accomplishments. On the other hand, the recognition, challenges and opportunities for personal growth are very strong momentum and will bring satisfaction and doing things better. Expectancy theory suggests that motivation will depend on the expectations of the individuals„s ability to perform their tasks and in getting the desired rewards. Expectancy theory was known as Victor Vroom (1964) study, although many scholars also contribute to this field. Expectancy theory is not only concerned with the determination of types of demand, but also the research process so that individuals receive awards.
Elements of expectancy theory:
Expectancy theory is based on the relationship between individual effort, the implementation (action) by individuals and outcomes they desire combined with a job well done. These factors and their relationship will be illustrated in the figure below this.
The expectancy theory of motivation provides an explanation as to why an individual chooses to act out a specific behavior as opposed to another. This cognitive process evaluates the motivational force (MF) of the different behavioral options based on the individual's own perception of the probability of attaining his desired outcome. Thus, the motivational force can be summarized by the following equation:
MF = Expectancy X Instrumentality X ∑ (Valence(s)) Expectancy (E)
Expectancy refers to the "effort-performance" relation. Thus, the perception of the individual is that the effort that he or she will put forward will actually result in the attainment of the
"performance". This cognitive evaluation is heavily weighted by an individual's past experiences, personality, self-confidence and emotional state.
The Instrumentality (I)
Instrumentality refers to the "performance-reward" relation. The individual evaluates the likelihood or probability that achieving the performance level will actually result in the attainment of the reward.
Valance (V)
Valance is the value that the individual associates with the outcome (reward). A positive valance indicates that the individual has a preference for getting the reward as opposed to, vice-versa, a negative valance that is indicative that the individual, based on his perception evaluated that the reward doesn't fill a need or personal goal, thus he or she doesn't place any value towards its attainment.
As the Motivational Force (MF) is the multiplication of the expectancy by the instrumentality it is then by the valence that any of the perception having a value of zero or the individual's feeling that "it's not going to happen", will result in a motivational force of zero.
David Mc. Clelland (2002) argues that humans have three basic needs are: demand achievements, alliances needs and power needs.
(1) The need for achievement
People with a high need for achievement are one who pursues the settlement of the job in a better way. These people want to overcome the difficulties and obstacles; they want to feel that the results of their actions determine the success or failure of them. Those with high achievement needs generally prefer the challenging job. General characteristics of those with high achievement needs:
- The desire to perform personal responsibility. - The trend set high goals for themselves.
- Strong demand for specific responses, immediately. - Quickly, soon mastered their job
(2) The need for coalition
Like the social needs of A. Maslow, it is accepted love, friends. Workers demand higher league will do a good job of creating a friendly and social relation.
(3) The demand for power
Demand for power is the need to control and influence others as well as their working environment. The researchers pointed out that people in need and demand reliable power achievements tend to become managers.
2.3 Factors affect employee satisfaction
According to Foreman approach Facts (1946), the satisfaction of employees related to the ten factors: (1) Discipline dexterity, (2) Empathy with personal problems of employees, (3 ) interesting work, (4) be interacting and sharing their work, (5) work Safety, (6) working conditions, (7) Food, (8) to be fully evaluated the work performed, (9) Loyalty to the superior individuals, (10) Promotion and career development.
Weiss, Dawis, England & Lofquist (1967) has developed model MSQ (Minnesota Satisfaction Questionnaire) consists of 20 items (corresponding to 20 elements) assess the level of overall satisfaction in every aspect: (1) Usability (opportunity to do something to be able to develop the ability of workers); (2) Achievements (feeling of complete well that workers gain from work); (3) Activity (can maintain busy most of the time); (4) Promotions (opportunities promoted in this work); (5) Powers (opportunities to tell others what to do); (6) Company policy (how companies set policies and put in execution);
(7) Compensation (salary and a large number of jobs did); (8) colleague (the way that colleagues show to others); (9) Creative (opportunity to try the approach of each individual in his work); (10) Independent (opportunity to work alone on the job); (11) Safety (the stability of the work); (12) Social Services (the opportunity to do something for others); (13) Social position (the opportunity to become "someone" in the community); (14) Value ethics (can do things that are not contrary to conscience); (15) The recognition (of praising the good work); (16) Responsibility (the freedom to use their opinion); (17) The monitoring - human
(The way in which executive staff leadership); (18) The supervision - technical (ability of the leadership decisions); (19) The diversity (the chance to do things differently); (20) working conditions.
Scale job description JDI (Job Descriptive Index) by Smith et al established in 1969 is one of the valuable scale and reliability is appreciated in theory and in practice. This scale consists of five elements: (1) The nature of work, (2) promotion of training opportunities, (3) Leadership, (4) colleague, (5) Wages Later, Crossman and Bassem ( 2003) has added two more components, such as welfare and working environment.
With his research, the Schemerhon (1993) has launched eight factors affecting employee satisfaction, including: (1) Place of work, (2) the supervision of their superiors, (3) relationships with colleagues, (4) Description of work, (5) the preferential treatment, (6) Promotion, (7) physical condition of the workplace, (8) structure model JSS (Job satisfaction Survey) of Spector (1997) was developed to apply to businesses in the service sector, including nine factors assessed the level of satisfaction and attitudes, which are: (1) salary, ( 2)
advancement opportunities, (3) working conditions, (4) the monitoring, (5) colleague, (6) Loving the work, (7) Communicate information, (8) reward estate Incidentally, (9) Welfare.
In Vietnam, JDI models also have authors used as a basis for the study of employee satisfaction, but Tran Kim Dung (2013) on the topic "The demand, staff satisfaction and member engagement for organizations ", has used the scale of seven elements; Vu Khac Dat (2013) Measuring the satisfaction of office workers of Vietnam Airline Southern region have used the scale consists of six elements; Trung, N. V. T. (2013) villa research staff satisfaction at the joint-stock company for engineering mechanics Long An has used six factors scale. In addition, some studies of the authors also showed that the satisfaction of employees in their work differ due to factors of personal characteristics such as age, gender, education level , seniority, location.
2.4 Hypothesis and research frame work development
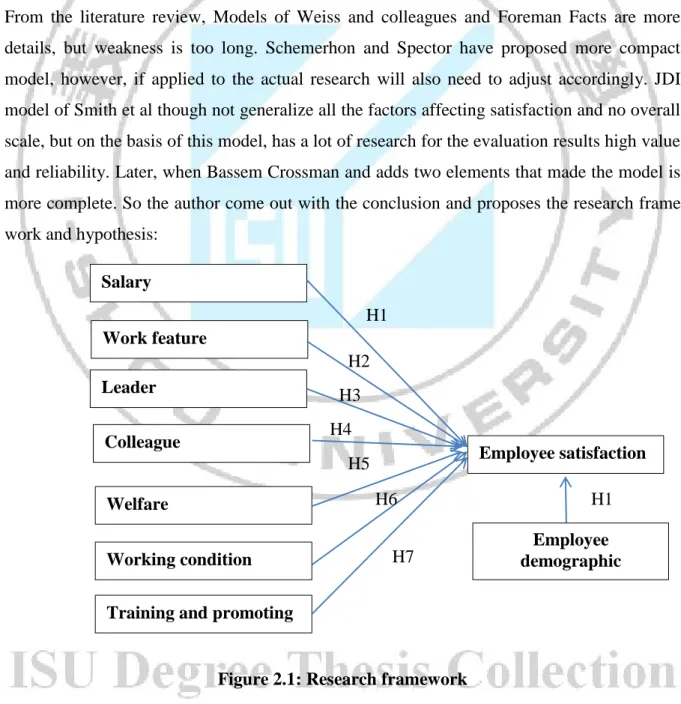
From the literature review, Models of Weiss and colleagues and Foreman Facts are more details, but weakness is too long. Schemerhon and Spector have proposed more compact model, however, if applied to the actual research will also need to adjust accordingly. JDI model of Smith et al though not generalize all the factors affecting satisfaction and no overall scale, but on the basis of this model, has a lot of research for the evaluation results high value and reliability. Later, when Bassem Crossman and adds two elements that made the model is more complete. So the author come out with the conclusion and proposes the research frame work and hypothesis:
Figure 2.1: Research framework Salary
Training and promoting Working condition Work feature Leader Colleague Welfare Employee satisfaction Employee demographic H1 H2 H3 H4 H5 H6 H7 H1
Hypothesis
H1: Salary has a relationship with Employee satisfaction H2: Work feature has a relationship with Employee satisfaction H3: Leader has a relationship with Employee satisfaction H4: Colleague has a relationship with Employee satisfaction H5: Welfare has a relationship with Employee satisfaction
H6: Working condition has a relationship with Employee satisfaction H7: Training and promoting has a relationship with Employee satisfaction
Chapter III. METHODOLOGY
3.1 Construction scale and questionnaire
3.1.1 Construction scale
The scale was built and developed from the theoretical basis and research models. This scales are translated into Vietnamese from the scales have been used in the research are published before. So, prior to the official formation of scale for research objectives and in-depth interviews were conducted to confirm the subjects interviewed are content to understand the concept and meaning of words. Scales used in the study was 5 Likert scale with level of popularity as follows: strongly agree, agree, normal, disagree and strongly disagree. The use of this scale in the socio-economic study for the economic problems in society are most identifiable aspects.
3.1.2 Questionnaire
- Salary factor as measured by 5 variables, including: (1) basic salary in line with the nature of work; (2) Peace of mind with current salary; (3) Salary commensurate with the level of contributions; (4) The appropriate allowances; (5) Policy fair and satisfactory reward
- Work feature: factor as measured by 6 variables, including: (6) The work represents social position; (7) The work allows good use of individual capacity; (8) Work suitable for academic and professional qualifications; (9) work to create conditions to improve the skills and knowledge; (10) The pressure of work; (11) The work fun
- Leadership is measured by 4 variables measured, including: (12) Leadership is courtesy, gentleness; (13) Leadership by friendly communication; (14) Employees are treated fairly, regardless; (15) Leadership has always acknowledged the comments of staff; 16) Leadership is knowledgeable.
- Colleagues factor is measured in 5 variables, including: (17) The friendliness of colleagues; (18) The collaboration between staff and colleagues at work; (19) The mutual support between colleagues; (20) Share and help each other in life, 21) sharing the knowledge among colleagues
- Welfare factor as measured by 3 variables, including: (22) welfare policy clear and full implementation; (23) The welfare of expression thoughtful attention to workers; (24) Welfare Policy useful and attractive
trained for the job and career development; (26) supported staff time and travel costs higher education qualifications; (27) The promotion of employees; (28) The promotion of the company's equity
- Working conditions as measured by four variables including: (29) reasonable working hours; (30) Facilities good for working; (31) the safety working environment, comfort and hygiene; (32) Convenient location works
Each variable will be evaluated on a Likert scale from 1 (completely disagree) to 5 points (Totally agree) Similarly, the variable measuring employee satisfaction was also measured in 5 - Likert scale as above, and used points for 3 variables: (1) in general he / she likes this job; (2) In general he / she satisfied with the company; (3) He / she will work in the long term the company
3.2 Sampling
Sample size: the purpose of determining the sample size is to reduce the cost of labor and experiment. It is important to select how the sample size without losing the characteristics of the sample and the reliability of the figures represent overall.
Many researchers requiring larger sample size because it is based on a large sample distribution theory (Raykov & Widaman, 1995). However, the sample size is large, then how many have not yet clearly defined. Furthermore, the sample size will depend estimation method used. If using the estimation method, the sample size ML3 minimum of 100 to 150 samples (Hair et al, 1998), or at least 200 samples (HOELTER). Bollen (1989) suggested that the minimum sample size is 5 samples for a parameter estimation .
MacCallum, R. C., Widaman, K. F., Preacher, K. J., & Hong, S. (2001) has summarized the views of the previous studies on minimum standards for the audience sample size factor analysis. MacCallum and his colleagues cited studies Gorsuch, he suggested that the sample size should be five times the number of questions. Thus a minimum sample size of this study was 165 (33 × 5 variables).
3.3 Methods of analysis
The data collected are cleaned and analyzed with the aid of SPSS software using analytical methods. Include:
3.3.1. Descriptive statistics
Samples collected will be conducted in accordance with the statistical classification variables. The basis for classification include: Gender, age, education, work placements and work
experience. Also scoring average, maximum value, minimum value and standard deviation of the answers in the questionnaires collected.
3.3.2. Scaling
Factors inspection is done by Cronbach`s Alpha scales. These variations are observed not guarantee minimum reliability will be removed from the scale and does not appear in the analysis of factors. In this study, Cronbach's alpha coefficient was taken as the minimum of Hair Research and colleagues at 0.6. Variables Cronbach's alpha coefficient of less than 0.3 is considered junk variable.
3.3.3. Factor analysis
After the observed variables were tested using Cronbach's Alpha scale, they will be included in the explore factor analysis (EFA). Factor analysis will help authors observed variables collapsed into more significant variables in explaining the research model.
Some standards apply when analyzing EFA research as follows:
- Inspection of the suitability of factor analysis of sample data via the KMO. If greater than 0.5, the KMO factor analysis is appropriate, whereas if the value is less than 0.5 KMO factor analysis method is not appropriate.
- The number of factors: The number of factors that are determined based on the index eigenvalue represent the fraction of variation explained by each factor. - The Explained variance criteria: Total variance extracted must be greater than 50%. - Criticized coefficient method Principal components factor with Varimax rotation to ensure that the amount is the smallest factor.
3.3.4. Analysis of variance
For the test of the difference between the overall research expertise this study use T-test and analysis of variance (ANOVA), testing is also used to directly compare the value p- corresponding value. To consider the difference occurs in the category involving three or more groups are using Post Hoc Test by Tukey to assess value.
Chapter IV DATA ANALYSIS
4.1 Characteristic of respondent
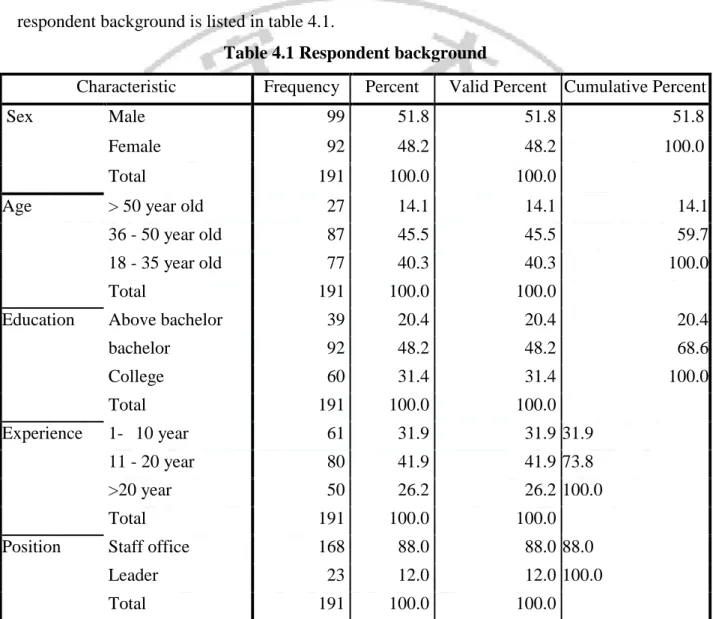
Among 250 questionnaires sent to employee who is working in Vietinbank in Hanoi on May, 2016 to ask about their satisfaction with the job. 223 questionnaires were returned and in this 191 questionnaires is considered as valuable for analysis counted for 85.2% of valid rate. The respondent background is listed in table 4.1.
Table 4.1 Respondent background
Characteristic Frequency Percent Valid Percent Cumulative Percent
Sex Male 99 51.8 51.8 51.8
Female 92 48.2 48.2 100.0
Total 191 100.0 100.0
Age > 50 year old 27 14.1 14.1 14.1
36 - 50 year old 87 45.5 45.5 59.7
18 - 35 year old 77 40.3 40.3 100.0
Total 191 100.0 100.0
Education Above bachelor 39 20.4 20.4 20.4
bachelor 92 48.2 48.2 68.6 College 60 31.4 31.4 100.0 Total 191 100.0 100.0 Experience 1- 10 year 61 31.9 31.9 31.9 11 - 20 year 80 41.9 41.9 73.8 >20 year 50 26.2 26.2 100.0 Total 191 100.0 100.0
Position Staff office 168 88.0 88.0 88.0
Leader 23 12.0 12.0 100.0
Total 191 100.0 100.0
From the table 4.1, the result indicates that, among 191 employees, there are 51.8% is male and 48.2 is female. The age of respondent is asked from 18 to 60-year-old in which, employee is in the group of 18 – 35 is 40.3%, from 36- 50 is 45.5%, and over 50 years old counted only 14.1% in this study.
Related to education level of employee in this study, the result shows that for employee who have the higher bachelor degree in this study is just 20.4%, employee who is graduated from university is 48.2%. While employee who have the College and in this study 31.4 indicates
high education level of employee in this study. For the experience of employee who are working for Vietinbank the result shows that employee who have 1 to 10 years experience is 31.9%, employee with 11-20 years experience is 41.9% and more than 20 year is 26.2% indicate the high experience of respondent in this study. Total 191 employees were surveyed there are 88% is working as staff and 12% who is leader.
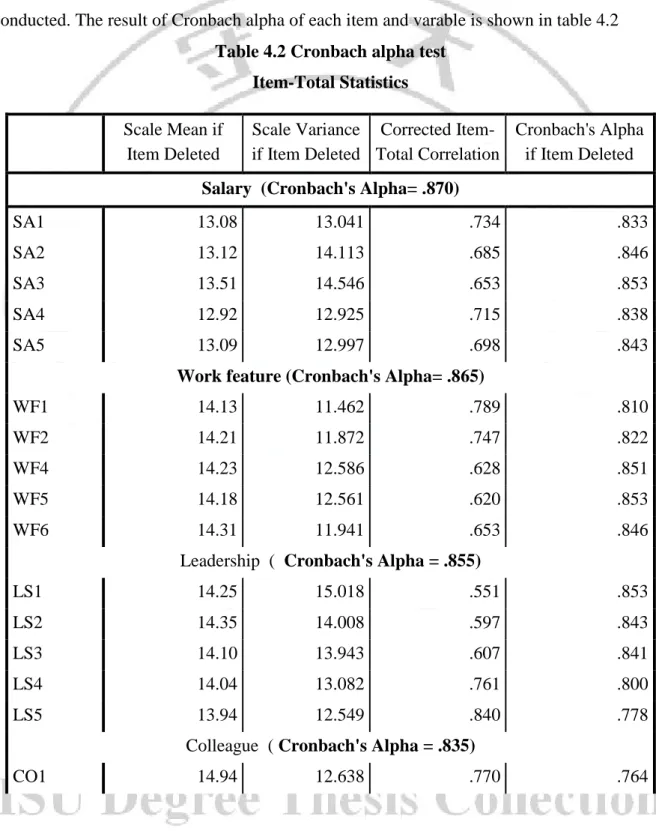
4.2 Reliability test
To check the reliability and internal consistency of each factor, Cronbach alpha test was conducted. The result of Cronbach alpha of each item and varable is shown in table 4.2
Table 4.2 Cronbach alpha test Item-Total Statistics Scale Mean if Item Deleted Scale Variance if Item Deleted Corrected Item-Total Correlation Cronbach's Alpha if Item Deleted
Salary (Cronbach's Alpha= .870)
SA1 13.08 13.041 .734 .833
SA2 13.12 14.113 .685 .846
SA3 13.51 14.546 .653 .853
SA4 12.92 12.925 .715 .838
SA5 13.09 12.997 .698 .843
Work feature (Cronbach's Alpha= .865)
WF1 14.13 11.462 .789 .810
WF2 14.21 11.872 .747 .822
WF4 14.23 12.586 .628 .851
WF5 14.18 12.561 .620 .853
WF6 14.31 11.941 .653 .846
Leadership ( Cronbach's Alpha = .855)
LS1 14.25 15.018 .551 .853
LS2 14.35 14.008 .597 .843
LS3 14.10 13.943 .607 .841
LS4 14.04 13.082 .761 .800
LS5 13.94 12.549 .840 .778
Colleague ( Cronbach's Alpha = .835)
Scale Mean if Item Deleted Scale Variance if Item Deleted Corrected Item-Total Correlation Cronbach's Alpha if Item Deleted CO2 15.01 13.068 .675 .791 CO3 15.35 13.448 .654 .797 CO4 15.21 14.359 .583 .817 CO5 14.95 14.424 .509 .837
Training and promotion (Cronbach's Alpha = .846)
TP1 9.18 10.172 .746 .826
TP2 9.08 11.677 .659 .858
TP3 9.10 12.701 .680 .853
TP4 9.21 10.159 .828 .787
Working condition (Cronbach's Alpha = .816)
WK1 9.26 6.150 .688 .745
WK2 8.92 6.146 .581 .796
WK3 9.18 6.161 .709 .737
WK4 9.47 6.208 .581 .796
Welfare (Cronbach's Alpha = .816)
WE1 6.05 3.319 .609 .718
WE2 5.91 3.475 .695 .629
WE3 5.98 3.573 .563 .766
Satisfaction (Cronbach's Alpha = .839)
JS1 5.85 3.719 .736 .741
JS2 6.10 4.322 .637 .835
JS3 6.14 3.697 .736 .741
From the result of reliability, there is one item of work feature factor ( WF3) is removed from the construct since this item has the Cronbach's alpha value wich is smaller that 6.0, others items remain in this study that shows in the table 4.2 have the Cronbach's alpha that are greater than 0.7. The Corrected Item-Total Correlation of the observed variables are greater than 0.3 which shows the research concept was built from the observed variables are reaching intrinsic consistency and measurement concept is good.
4.3 Factor analysis
Factor analysis (EFA) was used to test the value of the concept of scale. Scale in the study consists of 32 variables observed and after checking the reliability by Cronbach Alpha method.
Rotated Component Matrixa Component 1 2 3 4 5 6 7 SA1 .776 SA2 .758 SA3 .780 SA4 .720 SA5 .704 WF1 .863 WF2 .801 WF4 .746 WF5 .719 WF6 .736 LS1 .739 LS2 .647 LS3 .606 LS4 .766 LS5 .847 CO1 .831 CO2 .698 CO3 .745 CO4 .734 CO5 .687 TP1 .767 TP2 .722 TP3 .742 TP4 .838 WK1 .777 WK2 .699 WK3 .778 WK4 .670 WE1 .787 WE2 .831 WE3 .787 Eigenvalues 9.125 2.911 2.457 2.090 1.739 1.530 1.291 % of Variance 29.435 9.391 7.924 6.74 5.611 4.937 4.165 KMO/P-value .847/0.000 Total Variance
Explained (TVE) TVE = 68.205
Extraction Method: Principal Component Analysis. Rotation Method: Varimax with Kaiser Normalization. a. Rotation converged in 6 iterations.
In this study, the principle component method is used to analyze the factors explored. 6 factors of 32 items to be put in the system and analyzed. Bartlett test results (Table 4.3) shows the value-Meyer-Olkin Kaiser (KMO) = 0.847> 0.5 and Bartlett test with statistical significance at Sig = 0.000 <0.05. Such methods of factor analysis officially recognized in research.
In the rotated factor matrix (Table4.3), According to valid standards eigenvalue greater than 1 as: Factor Salary (5 item) = 9.125, Work feature (5 item) = 2.911, Leadership (5 item)=2.457, Colleague (5 item) = 2.090, Training and promotion (4 item)= 1.739, Working condition (4 item) = 1.530, Welfare (3 item) = 1.291. The total variance extracted 68.205 > 50%. Variance extracted values tell us 7 components are identified 68.205% variability of the data. The factors loading is greater than 0.5. From the above information, the study concluded the scale is accepted.
4.4. Hypothesis testing
4.4.1 Evaluate the fit of the linear regression model
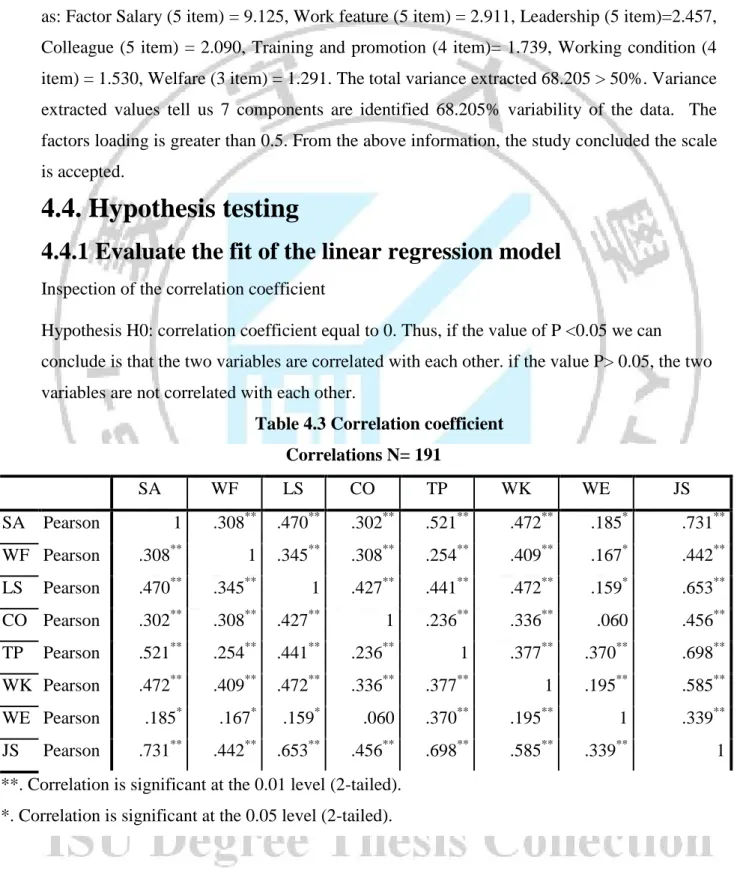
Inspection of the correlation coefficient
Hypothesis H0: correlation coefficient equal to 0. Thus, if the value of P <0.05 we can conclude is that the two variables are correlated with each other. if the value P> 0.05, the two variables are not correlated with each other.
Table 4.3 Correlation coefficient Correlations N= 191 SA WF LS CO TP WK WE JS SA Pearson 1 .308** .470** .302** .521** .472** .185* .731** WF Pearson .308** 1 .345** .308** .254** .409** .167* .442** LS Pearson .470** .345** 1 .427** .441** .472** .159* .653** CO Pearson .302** .308** .427** 1 .236** .336** .060 .456** TP Pearson .521** .254** .441** .236** 1 .377** .370** .698** WK Pearson .472** .409** .472** .336** .377** 1 .195** .585** WE Pearson .185* .167* .159* .060 .370** .195** 1 .339** JS Pearson .731** .442** .653** .456** .698** .585** .339** 1
**. Correlation is significant at the 0.01 level (2-tailed). *. Correlation is significant at the 0.05 level (2-tailed).
According to the correlation matrix in table 4.4, the variable input factor Salary, Work feature, Leadership, Colleague, Training and promotion, working condition, Welfare and Job Satisfaction are correlated with a correlation coefficient r > 0.3 with a significance level Sig <5%, which was statistically significant.
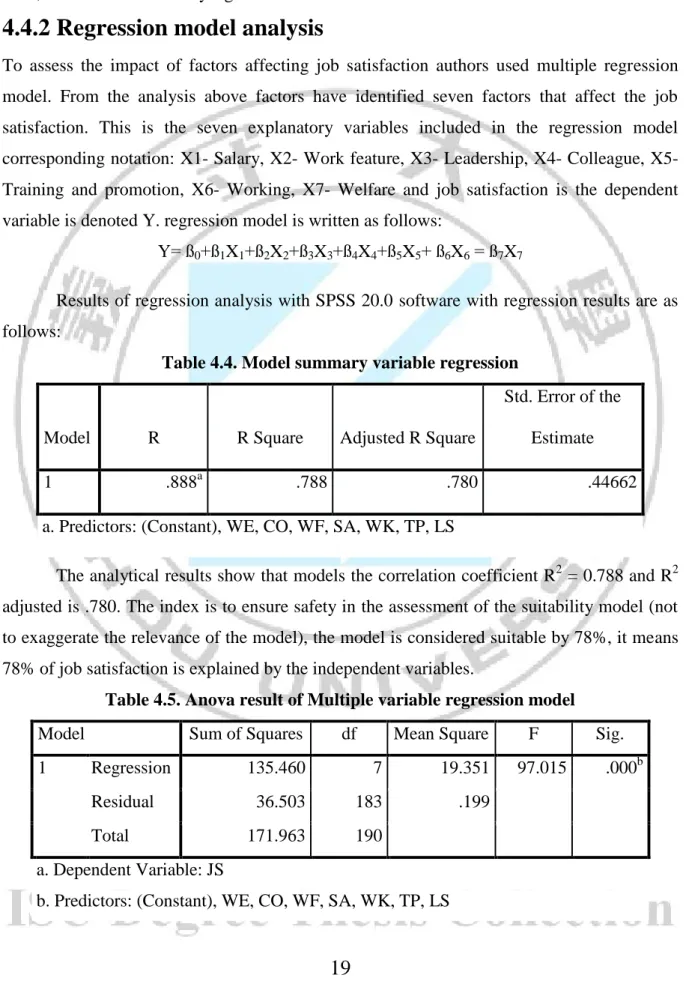
4.4.2 Regression model analysis
To assess the impact of factors affecting job satisfaction authors used multiple regression model. From the analysis above factors have identified seven factors that affect the job satisfaction. This is the seven explanatory variables included in the regression model corresponding notation: X1- Salary, X2- Work feature, X3- Leadership, X4- Colleague, X5- Training and promotion, X6- Working, X7- Welfare and job satisfaction is the dependent variable is denoted Y. regression model is written as follows:
Y= ß0+ß1X1+ß2X2+ß3X3+ß4X4+ß5X5+ ß6X6 = ß7X7
Results of regression analysis with SPSS 20.0 software with regression results are as follows:
Table 4.4. Model summary variable regression
Model R R Square Adjusted R Square
Std. Error of the Estimate
1 .888a .788 .780 .44662
a. Predictors: (Constant), WE, CO, WF, SA, WK, TP, LS
The analytical results show that models the correlation coefficient R2 = 0.788 and R2 adjusted is .780. The index is to ensure safety in the assessment of the suitability model (not to exaggerate the relevance of the model), the model is considered suitable by 78%, it means 78% of job satisfaction is explained by the independent variables.
Table 4.5. Anova result of Multiple variable regression model
Model Sum of Squares df Mean Square F Sig.
1 Regression 135.460 7 19.351 97.015 .000b
Residual 36.503 183 .199
Total 171.963 190
a. Dependent Variable: JS
ANOVA analysis showed that F (97.015) is significant at 0.000 level, suggesting that building the regression model is consistent with the data collected and the factors are statistically significant at the 5% significance. Thus, the factors for the independent variable in the model with factors related to the dependent variable.
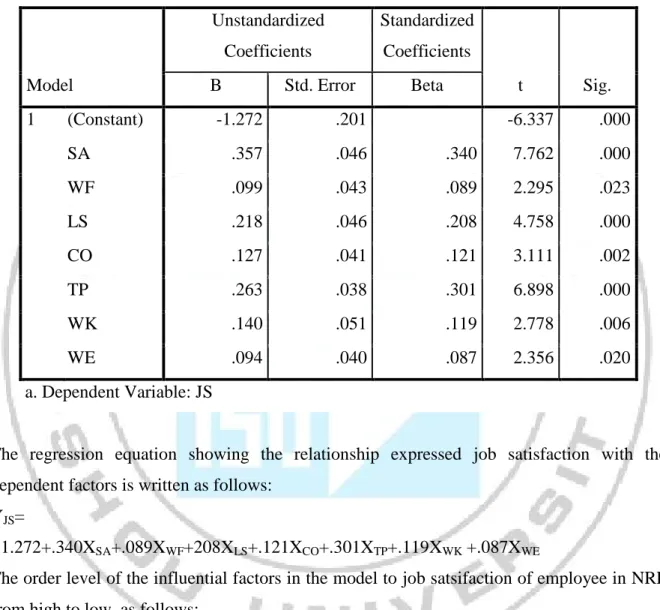
Table 4.6 Regression result Coefficientsa Model Unstandardized Coefficients Standardized Coefficients t Sig. B Std. Error Beta 1 (Constant) -1.272 .201 -6.337 .000 SA .357 .046 .340 7.762 .000 WF .099 .043 .089 2.295 .023 LS .218 .046 .208 4.758 .000 CO .127 .041 .121 3.111 .002 TP .263 .038 .301 6.898 .000 WK .140 .051 .119 2.778 .006 WE .094 .040 .087 2.356 .020 a. Dependent Variable: JS
The regression equation showing the relationship expressed job satisfaction with the dependent factors is written as follows:
YJS=
- 1.272+.340XSA+.089XWF+208XLS+.121XCO+.301XTP+.119XWK +.087XWE
The order level of the influential factors in the model to job satsifaction of employee in NRP from high to low, as follows:
1. Salary (beta = 0.340)
2. Training and promotion (beta =.301) 3. Leadership (beta =.208)
4. Colleague (beta= .121)
5. Working condition (beta = .119) 6. Work feature (beta = .089) 7. Welfare (beta = .087)
This means, in the context of other factors constant, then: when Factors " Salary" improved by 1 unit, the rate of job satisfaction in Vietinbank improved further 0. 340 units; when factors " Training and promotion " is improved by 1 unit, the rate of job satisfaction in Vietinbank is improved further 0.301 units; the factor " leadership " improved further by 1 unit, job satisfaction in Vietinbank is improved further 0.208 unit, Factor “working condition " improved further by 1 unit, job satisfaction in Vietinbank is improved further 0.119 unit, Factor “Colleague" improved further by 1 unit, job satisfaction in Vietinbank is improved further 0.121 unit, Factor “Work feature" improved further by 1 unit, job satisfaction in Vietinbank is improved further 0.089 unit and Factor “Welfare " improved further by 1 unit, job satisfaction in Vietinbank is improved further 0.087 unit.. So it is concluded that hypothesis 1 to hypothesis 7 is supported by the model.
4.4.3 T-test and ANOVA
For testing the hypothesis 8 this study uses t-test and Anova test the differences between Socio-demographics (gender, age, education) and job satisfaction for the employees who work in who work in the Vietinbank, Vietnam and the differences between job behaviors (working experience and working position) and job satisfaction for the employees who work in the Vietinbank, Vietnam?
To apply or perform a one−way ANOVA, certain assumptions (or conditions) need to exist. If any of the conditions are not satisfied, the results from the use of ANOVA techniques may be unreliable. The assumptions are:
- Each sample is an independent random sample
- The distribution of the response variable follows a normal distribution
- The population variances are equal across responses for the group levels. This can be evaluated by using the following rule of thumb: if the largest sample standard deviation divided by the smallest sample standard deviation is not greater than two, then assume that the population variances are equal.
Given that you are comparing independent groups, the null and alternative hypotheses are: H0: 1 - 2 = 0
H1: 1 = 2 # 0
In other words, the null hypothesis is that at all of the groups' population means are equal. The alternative is that they are not all equal; there are at two population means that are not equal to one another.
- The differences between Socio-demographics (gender, age, education) and job
satisfaction for the employees who work in who work in the Vietinbank
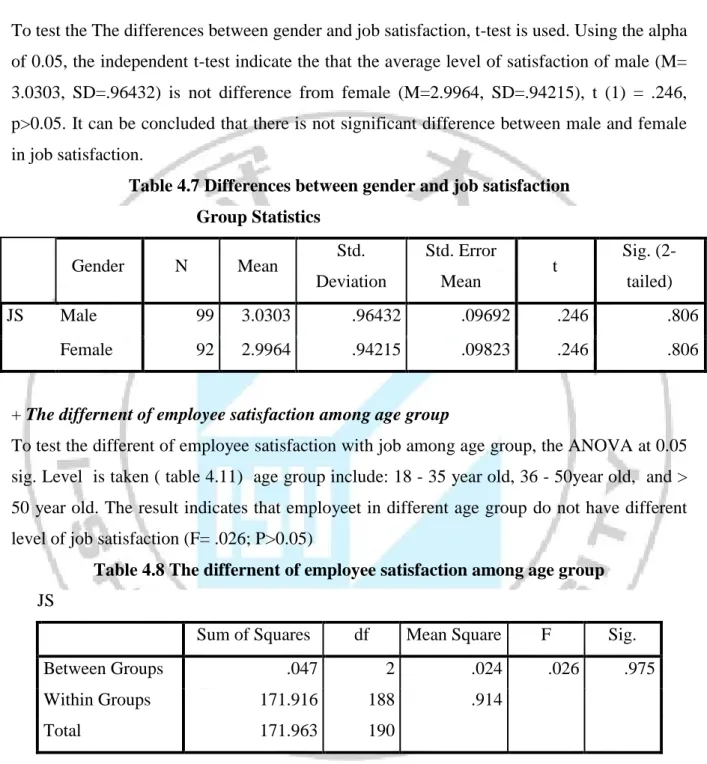
+ The differences between gender and job satisfaction
To test the The differences between gender and job satisfaction, t-test is used. Using the alpha of 0.05, the independent t-test indicate the that the average level of satisfaction of male (M= 3.0303, SD=.96432) is not difference from female (M=2.9964, SD=.94215), t (1) = .246, p>0.05. It can be concluded that there is not significant difference between male and female in job satisfaction.
Table 4.7 Differences between gender and job satisfaction Group Statistics Gender N Mean Std. Deviation Std. Error Mean t Sig. (2-tailed) JS Male 99 3.0303 .96432 .09692 .246 .806 Female 92 2.9964 .94215 .09823 .246 .806
+ The differnent of employee satisfaction among age group
To test the different of employee satisfaction with job among age group, the ANOVA at 0.05 sig. Level is taken ( table 4.11) age group include: 18 - 35 year old, 36 - 50year old, and > 50 year old. The result indicates that employeet in different age group do not have different level of job satisfaction (F= .026; P>0.05)
Table 4.8 The differnent of employee satisfaction among age group
JS
Sum of Squares df Mean Square F Sig.
Between Groups .047 2 .024 .026 .975
Within Groups 171.916 188 .914
Total 171.963 190
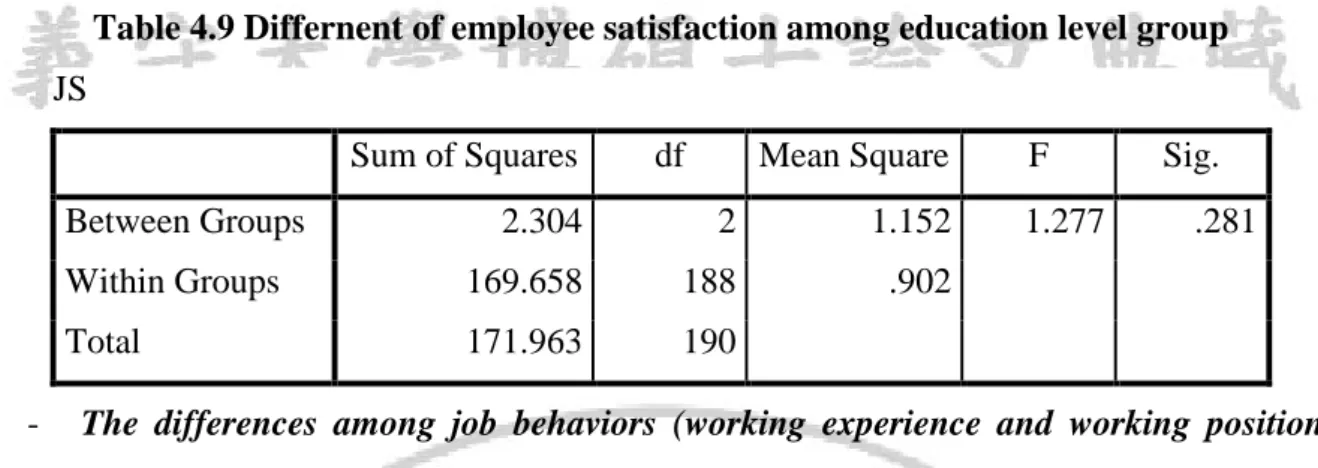
+ The differnent of employee satisfaction among education level group
To test the different of employee satisfaction with job among education level group, the ANOVA with 0.05 sig. is taken ( table 4.12) education group include: Above bachelor, Bachelor and College. The result indicates that employee in different education level group do not have the different level of job satisfaction (F= 1.277; P=0.05)
Table 4.9 Differnent of employee satisfaction among education level group
JS
Sum of Squares df Mean Square F Sig.
Between Groups 2.304 2 1.152 1.277 .281
Within Groups 169.658 188 .902
Total 171.963 190
- The differences among job behaviors (working experience and working position)
and job satisfaction for the employees who work in the Vietinbank, Vietnam + The differences among working experience and job satisfaction
To test the different of employee satisfaction among working experience group, the ANOVA with 0.05 sig. is taken ( table 4.13) working experience group group include: 1-10 year, 11 - 20 year and >20 year. The result indicates that employee in different working experience have different level of job satisfaction (F= .709; P > 0.05)
Table 4.10 differences among working experience and job satisfaction
JS
Sum of Squares df Mean Square F Sig.
Between Groups 1.287 2 .644 .709 .493
Within Groups 170.676 188 .908
Total 171.963 190
+ The differences between Position and job satisfaction
To test the The differences between Position and job satisfaction, t-test is used. Using the alpha of 0.05, the independent t-test indicate the that the average level of satisfaction of Staff (M= 3.0060, SD=.94596) is not significant difference from Leader (M= 3.0725, SD=.1.00983), t (1) = -.314, P>0.05.
Table 4.11 Differences between g Position and job satisfaction
Position N Mean Std. Deviation Std. Error Mean t Sig. (2-tailed)
JS Staff 168 3.0060 .94596 .07298 -.314 .754
Leader 23 3.0725 1.00983 .21056 -.298 .768
From the t-test and anova result indicate that there are not differences among Socio-demographics (gender, age, education) and job satisfaction for the employees who work in who work in the Vietinbank and job behaviors (working experience and working position) and job satisfaction for the employees who work in the Vietinbank, Vietnam. So hypothesis H8 is not accepted.
Chapter V
CONCLUSION AND RECOMMENDATION
5.1 Conclusion
Human resources is the key to success, that it's really true in the current period and become more important than ever while the door of international economic integration is opening. Since the integration and open economy, more and more foreign banks flooded the financial market of Vietnam and the banks in the country, scrambling to expand their many branches. The issue of human resources for banking industry have become "hot" than ever. The objective of this research is establishing assessment model of employee satisfaction in banking sector and Understanding the factors that affect employee satisfaction and assessing the situation on the satisfaction level of employees in recent years. Since then propose solutions to improve the efficiency of corporate governance for banks in the near future. This research result indicates that that employee satisfaction is impacted by 7 factors X1- Salary, X2- Work feature, X3- Leadership, X4- Colleague, X5- Training and promotion, X6- Working, X7- Welfare. This result consistent with the other result when study the employee satisfaction such as: Tran Kim Dung (2013), Khac Dat (2013), Trung, N. V. T. (2013) in their studies, the Salary and Colleague have positive relationship with employee satisfaction. The order level of the influential factors in the model to job satisfaction of employee in NRP from high to low, as follows: 1. Salary (beta = 0.340) , 2. Training and promotion (beta =.301), 3. Leadership (beta =.208), 4. Colleague (beta= .121), 5. Working condition (beta = .119), 6. Work feature (beta = .089), 7. Welfare (beta = .087)
Thus hypothesis H1 to H7 is accepted. For testing the H8 to find out the differences among Socio-demographics (gender, age, education) and job satisfaction for the employees who work in who work in the Vietinbank and job behaviors (working experience and working position) and job satisfaction for the employees who work in the Vietinbank, Vietnam. However, From the t-test and anova result indicate that there are not differences among Socio-demographics (gender, age, education) and job satisfaction for the employees who work in who work in the Vietinbank and job behaviors (working experience and working position) and job satisfaction for the employees who work in the Vietinbank, Vietnam. So hypothesis H8 is not accepted.
5.2 Recommendations
From the result show that salary is strong impacted to job satisfied. Featuring jobs and current working conditions, most employees feel the basic salary is not commensurate. There are so new enhanced sense of responsibility for employees at work, encourage them to work effectively, positive, enthusiastic, in order to achieve the Bank's objectives and also satisfy the individual needs of staff. For those allowances are being applied, more than 85% of employees are unhappy about the allowances, the Bank needs to raise rates further allowances to ensure that the allowances which are given Bank value and carries a certain significance for each employee. As salaries and allowances, respondents satisfied with this factor. To increase the reward for the staff as the effort of a group both employees and management, however, the policy making material reward timely and deserve to motivate small not for staff efforts and strive to work. Therefore, banks need to improve methods and performance assessment criteria to create a fair and motivation to work for employees.
In addition to ensuring full coverage of the regime, the banks need to pay more attention to the welfare policies for workers. Survey results showed that the degree of satisfaction is not high on the policy. Banks need to add a number of other policy and practical implications. As the result, the bank should adjust training policy and promotion, about 80% of people surveyed are not satisfied with the training policy of the bank, showed the need for the improvement of knowledge and improve the qualifications of staff in banks is high . Bank to pay special attention to encouraging banks academic staff qualifications, especially those key leadership positions, because the current level of education of banking personnel mainly university, only two master's degree holders.
Promotion policy: The survey showed that only 20% of people surveyed are satisfied with the policy advancement in the company. Equitable policies for promotion and attraction will be the driving force for employees not to effort and striving, closer and tried to contribute to the development of the bank.
Improving the quality of leadership
Over 60% of those surveyed are not satisfied with the leadership of the least recognized the contribution of staff to listen and show the operating methods of the bank's management is really good. In addition to attractive promotion policy and justice, as well as an improved method of quality management team of the bank helps banks accomplish development goals, create stronger confidence for employees on development prospects in the future.
Vietinbank should have assigned and working arrangements to suit the characteristics of each job, each part helps people make better employees work in the position they undertake. Need finishing the job description, provides the means and tools to support employees can fulfill their work. In addition, the recruitment policy of the banks also need to complete to ensure recruit people with expertise and technical capability to perform the job well.
Improving the working environment
Colleagues and working conditions are the two factors that the level of satisfaction with the highest number is about 50% of those surveyed. To improve these factors, banks should invest more on infrastructure conditions at work. In fact, in areas dealing with new customers investment and equip the material factors, however, the work area of employees should also be focused to improve work efficiency. Through the union activities to create good relationships between employees with one another, especially those employees working in different departments or other transaction.
5.3 Research contribution
It can be said, at present, one of the elements of competition between firms that policies to attract talent. Bringing satisfaction to employees becoming more urgent than ever because it was so important purpose in the present context it is employee retention. And to examine the degree of employee satisfaction banking sector to enterprises and their work they are undertaking and makes banks have the facility to evaluate the personnel policy and its corporate image told labor market. Vietinbank- a bank is focused on exploiting the strengths of the human factor - customer satisfaction inside and outside is considered one of the key tasks in the context of fierce competition present.
Reference
- Bollen, K. A. (1989). A new incremental fit index for general structural equation models. Sociological Methods & Research, 17(3), 303-316.
- Brock R. Williams (2016) The Trans-Pacific Partnership: Strategic Implications, Congressional Research Service
- Castanheira, F. (2014). Job Descriptive Index. In Encyclopedia of quality of life and
well-being research (pp. 3439-3441). Springer Netherlands.
- Dang-Thanh, N. (2012). Measuring the performance of the banking system: case of Vietnam (1990-2010). Journal of applied finance and banking, 2(2), 289-312.
- Gruneberg, M. M. (1979). Understanding job satisfaction. Springer.
- Hair, J. F., Anderson, R. E., Tatham, R. L., & William, C. (1998). Black (1998), Multivariate data analysis.
- Herzberg, F., & Mausner, B. (1959). Snyderman, The motivation to work. New York. - Kim, H. R., Lee, M., Lee, H. T., & Kim, N. M. (2010). Corporate social responsibility
and employee–company identification. Journal of Business Ethics, 95(4), 557-569. - Kinicki, A. J., McKee-Ryan, F. M., Schriesheim, C. A., & Carson, K. P. (2002).
Assessing the construct validity of the job descriptive index: a review and meta-analysis. Journal of applied psychology, 87(1), 14.
- Kreitner, R., & Kinicki, A. (2007). Organizational Behaviour; 7th eds.
- Küskü, F. (2003). Employee satisfaction in higher education: the case of academic and administrative staff in Turkey. Career Development International, 8(7), 347-356. - MacCallum, R. C., Widaman, K. F., Preacher, K. J., & Hong, S. (2001). Sample size in
factor analysis: The role of model error. Multivariate Behavioral Research, 36(4), 611-637.
- Maslow, A. H. (1943). A theory of human motivation. Psychological review, 50(4), 370.
- McClelland, D. A., Aitken, J. D., Bhella, D., McNab, D., Mitchell, J., Kelly, S. M., ... & Rixon, F. J. (2002). pH reduction as a trigger for dissociation of herpes simplex virus type 1 scaffolds. Journal of virology, 76(15), 7407-7417.
- Pham, L. (2010). A conceptual framework for e-banking service quality in Vietnam.
- Raykov, T., & Widaman, K. F. (1995). Issues in applied structural equation modeling research. Structural Equation Modeling: A Multidisciplinary Journal, 2(4), 289-318. - Smith, J. A. (Ed.). (2007). Qualitative psychology: A practical guide to research
methods. Sage.
- Staples, D. S., Hulland, J. S., & Higgins, C. A. (1998). A self‐efficacy theory explanation for the management of remote workers in virtual organizations. Journal of
Computer‐Mediated Communication, 3(4), 0-0.
- Thanhh, N. D., & Thi, C. H. (2014). Structural model for Adoption and Usage of E-banking in Vietnam. Journal of Economic Development, 220, 116-135.
- Tran Kim Dung (2013). Human resource management. University of Economics Ho Chi Minh City. Trung, N. V. T. (2013). Corporate social responsibility. University of National Economy.
- Vroom, V. H. (1966). Organizational choice: A study of pre-and postdecision processes. Organizational behavior and human performance, 1(2), 212-225.
- Vu Khac Đat (2013). Factors affecting staff‟s loyalty to business: a case at Viet Nam Airlines. Journal of University of Economics Ho Chi Minh City.
- Weiss, D. J., Dawis, R. V., & England, G. W. (1967). Manual for the Minnesota Satisfaction Questionnaire. Minnesota studies in vocational rehabilitation.
Appendix: Questionnaire (English Version)
I am a Vietnamese graduate student of International Master of Business of Administration program I-Show University, Taiwan. My master thesis is about “ The Relationship between Employee Motivation, Employee Retention and Work Performance in CMI Stone Vietnam JSC.” Please take about 10 to 15 minutes to answer all of the questions in my survey. The answers will only be used for academic purposes and will be strictly confidential. Thank you in advance for your time and help.
Part I . Motivation and Its effecting factors
Please read the following statements and tick the level agreed under your personal opinion 1 = Strongly Disagree 2= Disagree 3= Neutral 4= Agree 5= Strongly Agree level agreed
Basic salary in line with the nature of work 1 2 3 4 5
Peace of mind with current salary 1 2 3 4 5
Salary commensurate with the level of contributions; 1 2 3 4 5
The appropriate allowances; 1 2 3 4 5
Policy fair and satisfactory reward 1 2 3 4 5
The work represents social position; 1 2 3 4 5
The work allows good use of individual capacity; 1 2 3 4 5
Work suitable for academic and professional qualifications; 1 2 3 4 5 Work to create conditions to improve the skills and knowledge 1 2 3 4 5
The pressure of work; 1 2 3 4 5
Leadership is courtesy, gentleness; 1 2 3 4 5
Leadership by friendly communication; 1 2 3 4 5
Employees are treated fairly, regardless; 1 2 3 4 5
Leadership has always acknowledged the comments of staff; 1 2 3 4 5
Leadership is knowledgeable 1 2 3 4 5
The friendliness of colleagues; 1 2 3 4 5
The collaboration between staff and colleagues at work 1 2 3 4 5
The mutual support between colleagues; 1 2 3 4 5
Share and help each other in life, 1 2 3 4 5
sharing the knowledge among colleagues 1 2 3 4 5
welfare policy clear and full implementation; 1 2 3 4 5
The welfare of expression thoughtful attention to workers 1 2 3 4 5
Welfare Policy useful and attractive 1 2 3 4 5
Staff are trained for the job and career development; 1 2 3 4 5
Supported staff time and travel costs higher education qualifications; 1 2 3 4 5 The promotion of employees;
The promotion of the company's equity Reasonable working hours;
Facilities good for working;
The safety working environment, comfort and hygiene; Convenient location works
In general he / she likes this job; (
In general he / she satisfied with the company He / she will work in the long term the company
1. Gender: Male Female
2. Age: 18-35 -50 0 or over 3. Education: Under Bachelor (Associate Degree)
Bachelor degree
4. Your position
Leader Staff
5. Your work experience