Department of Business Administration
I-Shou University
Master Thesis
Influencing Factors on Customer Loyalty in
On-line Small and Medium Enterprises in Vietnam
Advisor: Wen-Huei Yang, Ph.D.
Co-advisor: Ho Sy Tan, Ph.D.
Graduate Student: Chi Bac Nguyen
i
Acknowledgement
Firstly, I am highly indebted to our department for their guidance and constant supervision as well as for providing necessary information regarding the project and also for their support in completing the project. I would like to express my special thanks to Dr. Wen-Huei Yang, who gave me the golden opportunity to do this wonderful project on the topic. He also helped me in doing research and I came to know about so many new things.
Secondly, I would like to express my thanks to my family members and all my close friends. They always stand by me and give me the strength of spirit to finish this project. Moreover, I am very grateful to and appreciated to industry people for giving me such time and attention. Finally, I aslo wish to share my gratitude and thanks to everybody who has willingly encouraged, as well as helped me out with all their abilities, and my classmates in developing this project.
ii
Abstract
The number of SMEs recognizing the importance of customer satisfaction, trust and loyalty for the long- term development of online market has increased. Nevertheless, many previous studies have stated that most businesses had difficulties in maintaining e- loyalty, in spite of the fast growth in e-commerce technology. Thus, firstly, the major objective of this study is to explore the key factors that have impacts on online shopper satisfaction, trust and loyalty. Secondly, a conceptual framework is also built to describe the mutual relationships among these three main constructs and their antecedents. In addition, an online survey was carried out with 350 respondents who often buy products via Internet. The findings of this study presented that perceived security is strongly influenced by customer satisfaction, but weakly influenced by customer trust. Moreover, satisfaction played more important role than trust in relation to loyalty. Lastly, the study also gives some limitations, implications for managers, and directions for future studies.
iii
Table of Contents
Acknowledgement ... i
Abstract ... ii
Table of Contents ... iii
List of Table ... v
List of Figures ... vi
List of Abbreviations... vii
Chapter 1 INTRODUCTION ... 1
1.1 Research background ... 1
1.2 Problem statement and research objectives ... 2
1.3 Research questions ... 3
1.4 Research Significance... 4
Chapter 2 LITERATURE REVIEW ... 5
2.1 Current situation of Vietnam E- Commerce Industry ... 5
2.1.1 The concept of E- commerce ... 5
2.1.2 Online SMEs ... 5
2.1.3 Current situation of Vietnam E- Commerce Industry ... 5
2.2 E- Loyalty ... 9
2.2.1 The concept of e-loyalty ... 9
2.2.2 The influencing factors of E- Loyalty ... 9
2.2.2.1 Perceived Service Quality ... 9
2.2.2.2 E- Satisfaction ... 13
2.2.2.3 E- Trust... 13
2.3 Summary of construct definitions and references ... 15
Chapter 3 METHODOLOGY ... 17
3.1 Conceptual framework ... 17
3.2 Hypothesis ... 17
3.3 Variables ... 18
iv
3.3.2 Independent variables ... 18
3.3.2.1 Perceived service quality ... 18
3.3.2.2 E- Satisfaction ... 20 3.3.2.3 E- Trust... 21 3.3.2.4 Demographic Factors ... 21 3.4 Research Design... 22 3.5 Sampling Design ... 22 3.6 Data Collection ... 22 3.7 Data Analysis ... 23
Chapter 4 RESULT AND DISCUSSION ... 24
A. Data Analysis ... 25
4.1 Descriptive Analyses ... 25
4.2 Mean and Standard Deviation ... 26
4.3 Reliability Cronbach’s Alpha... 27
4.4 One sample T- test Analysis... 28
4.5 Linear regression analysis ... 28
4.6 One- way ANOVA Analysis ... 33
4.6.1 Age ... 33
4.6.2 Gender ... 33
4.6.3 Monthly Income ... 34
4.6.4 Job ... 35
B. Discussions ... 36
Chapter 5 CONCLUSIONS AND SUGGESTIONS ... 38
5.1 Research summary ... 38
5.2 Research Implications ... 38
5.3 Research Limitations ... 39
5.4 Suggestions for future research ... 39
5.5 Concluding statement... 39
References ……….40
Appendix A ... 50
v
List of Table
Table 2.1 Market shares of Internet users in some countries in the world ... 8
Table 2.2 SERVQUAL MODEL of Parasuraman et al. (1988) ... 11
Table 2.3 Summary of SERVQUAL SCALE of previous researchers ... 11
Table 2.4 Summary of construct definitions and references ... 15
Table 3.1 Measurements of e- loyalty ... 18
Table 3.2 Measurements of Perceived Service Quality ... 19
Table 3.3 Measurements of e- satisfaction ... 21
Table 3.4 Measurements of e- trust ... 21
Table 3.5 Measuring scale for demographic factors ... 22
Table 4.1 Summary of Demographic characteristics ... 25
Table 4.2 Summary of Mean and Standard Deviation ... 26
Table 4.3 Summary of Reliability level ... 27
Table 4.4 Summary of Hypothesis result of H3a-b ... 28
Table 4.5 Equation 1 of E-satisfaction - Model Summary ... 29
Table 4.6 Equation 1 of E-satisfaction - Coefficients ... 29
Table 4.7 Equation 2 of E- Trust- Model Summary ... 30
Table 4.8 Equation 2 of E- Trust- Coefficients ... 30
Table 4.9 Equation 3 of E- Loyalty- Model Summary ... 31
Table 4.10 Equation 3 of E- Loyalty- ANOVA Analysis ... 31
Table 4.11 Equation 3 of E- Loyalty- Coefficients ... 32
Table 4.12 Results of Linear Regression Analysis ... 32
Table 4.13 Test of Homogeneity of Variances- Age ... 33
Table 4.14 ANOVA - Age ... 33
Table 4.15 Test of Homogeneity of Variances- Gender ... 34
Table 4.16 ANOVA - Gender ... 34
Table 4.17 Test of Homogeneity of Variances- Income ... 34
Table 4.18 ANOVA- Income ... 35
vi
Table 4.20 ANOVA- Job ... 36
List of Figures
Figure 2.1 Market shares of Internet users in Southeast Asia 2010 ...7 Figure 2.2 Perceived Service Quality Framework ...13 Figure 3.1: Framework of the study ...17
vii
List of Abbreviations
SMEs: small and medium enterprises APEC: Asia-Pacific Economic Cooperation E- Commerce: Electronic Commerce
E- Satisfaction or SAT: Customer satisfaction in E- commerce market E- Trust or TRU: Customer trust in E- commerce market
E- Loyalty or LOY: Customer loyalty in E- commerce market H1a-d: Hypothesis 1a-d
H2 a-d: Hypothesis 2a-d H3 a-b: Hypothesis 3a-b H4: Hypothesis 4
H5: Hypothesis 5
UIQ: Perceived user interface quality REP: Perceived responsiveness PSL: Perceived Personalization PSR: Perceived Security
SPSS: Statistical Package for the Social Sciences ANOVA: Analysis of Variance
1
Chapter 1 INTRODUCTION
1.1 Research background
E- Commerce is a new field to be created more and more trust for the subjects involved in online relationship. In the process of integration with the world as a member of APEC, Vietnam has actively involved and supported the development of electronic commerce that has changed the way business transactions tradition and bring enormous benefits to society. However, We also has to admit that the risks encountered during the transaction, online business is possible and this requires the solution not only technically but also need to form an adequate legal basis. The demand of our international legal right requires be meeting and keeping up the integration in the region and around the world.
Furthermore, E- Commerce can be seen as a common phenomenon but many people just vague understanding of it. Many young people want to understand it fully, but the concept of complex electronic commerce has hindered their wishes. The entrepreneurs also want to jump on this movement but lack the knowledge and specific planning. Finally, the dream has become the ride on the wave of a trend seething. But with its profound influence, E- Commerce truly perfected the future of humanity. Therefore, the study of electronic commerce is not just limited to understanding about E- Commerce, for instance, E- Commerce is what? Why did it become so important? How will E-commerce impact our lives?
Kuttner (1998) referred that the Internet is almost recognized as a perfect market since information is instantaneous and shoppers can compare the offerings of sellers worldwide. Moreover, this leads to a dramatic competition and vanishing loyalty. Annual report published by Vietnam Ecommerce Association, 2013 E- business Index illustrated that 50% of more than 31 million Internet users went online shopping. Online purchases worth a year of Vietnam are quite low, estimated current market size of about $ 2.2 billion. However, in this e- business competition still remains some serious challenges consisting of difficulties in contribute consumers’ trust, illegal risk to tax evasion, and anonymous smear.
E-commerce in Vietnam has recently become a hot topic that is attracting a lot of attention not only of policy makers, business managers, government in both researchers and operations practices. There have been no fewer monographs, dissertations, thesis and scientific topics, the
2
articles written on this issue including Anh (2001) "Electronic Commerce, the deployment in Vietnam and the involvement of the Vietnam Association for Information Processing", Thang (2001)" Internet Infrastructure in the development of Electronic Commerce”. Kaynak et al (2005) stated that the rapid emergence of E-commerce has changed the nature of business so quickly and pervasively that where once it was evolutionary.
In the early 2000s, E-commerce in Vietnam is considered as a toddler; but until 2010, the trade sector "non-traditional" is actually booming. In the modern economy, it would be flawed if the object is only focused on selling the traditional way in the real world but lost track virtual world, where land is e-marketing hunting. It creates "leverage" for the development of enterprises, especially mobile technology; the Internet is coming to all aspects of life. Thanks to rapid growth of Internet, it widens new chances for retails doing business, more and more people conduct making online commercial activities.
Research by Reichheld (1995) justified that profitability and long-term growth of a firm was strongly concerned by customer loyalty even small rise in customer retention rates can dramatically increase profit (Huffmire, 2001). According to Rosen’s analysts in 2001, it is suprising that the proportion of patrons contribute to approximately 40% of online business profits. As such, it is not great to confirm that loyalty has been appreciated as a key path for Internet retail enterprises’ success. Reichheld and Schefter (2000) discovered that high cost structure to new online buyers because of al least three years unprofitable customer relationships. Therefore, it is very significant to find out the fundamentual elements that have a strong impact on online loyalty. Futhermore,the way to keep online shoppers who continue purchase products and services requires more efforts, and in todays hard competitive online trade if the e- commerce providers can not build the trust and make them feel pleased, the failure is upcoming soon.
1.2 Problem statement and research objectives
The concept of "loyalty" has been formed over the centuries. In ancient times, the great veteran of Roman Empire used loyalty to against military and political power, to overthrow the emperor. Napoleon Bonaparte, one of the famous French generals of the 19th century, has achieved miraculous results through the loyalty of the soldiers under his command. Step into the 21st century, we can see that the "general" so the marketplace, trying to protect and expand market based on customer loyalty.
3
Customer loyalty has been recognized as a valuable asset to compete in the market (Srivastava, Shervani, & Fahey (1998). Investing in loyalty management customers is very important and necessary if switching costs are low use, because they are not bound by the contract (Shapiro & Vivian, 2000). The concept of customer loyalty is common in many economies during the last decade (Lewis, 1997). The loyalty program customers usually give its members rewards and value added, which makes the program become attached more familiar to customers (Liebermann, 1999).
Therefore, this has led to increased competition to attract more customers among companies in the same industry. As a result, clients will be more committed to the loyalty program customers of many companies in the same business area (Passingham, 1998). For example, customers often have more loyalty cards of different supermarkets. Trend of the company is launching the loyalty program is seen as a strategy to protect market share (Dawkins & Reichheld, 1990) rather than using CRM. That's why flooded lead to loyalty programs. If companies do not make a difference or just a special value alone, they often wasteful use of resources to try to build loyalty that results can be profitable or not (Reinartz & Kumar, 2002).
Shopping websites have mushroomed in Vietnam to cater to a community of more than 34 million Internet users, of whom 18 million shopped online last year according to an official survey. But only a few of the websites are properly registered and most of the rest customers off with no one to complain to. With the aim of exploring in e-commerce’s role in the modern market economy, current situation Analysis and development trend of e-commerce in Vietnam, thesis research would be written to propose effective measures to promote the development of e-commerce meet the requirements of the economy. Moreover, the paper would like to examine the importance of customer loyalty to steady-state growth in e- commerce market. Last but not least, the study also investigates the antecedents and consequences of customer loyalty in online business of SMEs, concurrently find out the most critical components potentially impacting on e- loyalty.
1.3 Research questions
To be more concern, the main aim of the study is to investigate the path of perceived service quality => Satisfaction
=> Trust Loyalty drawing from Vietnam online SMEs, so that the study addresses four research questions:
4
1. What are the determining factors of overall e-service satisfaction? 2. Which is the most significant element of online customer trust?
3. How can firms build and maintain e- loyalty that from perspectives of small and medium size stakeholders?
4. What are some promising areas for future research on e- loyalty?
1.4 Research Significance
Although many previous researches mentioned on the relationship among customer satisfaction, trust and loyalty, only few ones has been lately carried out to reveal the impact of these factors in concept of online business in Vietnam. The perception of the important elements in improving customer loyalty can help manager try their best to a potential market like e- commerce business. Hence, the results of this research will be expected to bring a brighter vision for various businesses providing Vietnamese e-commerce service in academic perception as well as practical perception. From an academic perspective, this study is aimed to provide the general knowledge on the influence of many elements contributed to e-commerce customer loyalty in Vietnam. Besides, it will add value to the literature of online business on the impact of website user interface design, information quality, privacy, security on both variables satisfaction and e-trust. Lastly, by find out the relationships among satisfaction, trust, and loyalty in the diversity of cultures, the readers can draw the lessons to lessen to unexpected failure.
5
CHAPTER 2 LITERATURE REVIEW
2.1 Current situation of Vietnam E- Commerce Industry
2.1.1 The concept of E- commerce
The concept of E-commerce is broadening and giving in literature contributions. Baker & McKenzie (2001) defines E-commerce as “the production, distribution, marketing, sale or delivery of goods and services by electronic means”. To reach the aim of this research, this paper will adopt the definition of Globerman et al (2001 cited Kaynak et al 2005): “Any economic
transaction where the buyer and the seller come together through the electronic media of the Internet, form contractual agreement concerning pricing and delivery of particular goods and services and complete the transaction through the delivery of payments and good or service as contracted”
2.1.2 Online SMEs
Definitions of online SMEs are extensive with quantitative approach that includes staffing levels or factor of turnover, assets. On the other hand, qualitative approach is employed by others. According to Meredith (1994), any description or definition of online SMEs must have not only quantitative factors that include “staff levels, turnover, assets together with financial and non-financial measurements”, but also qualitative components that describe how the enterprise is organized and operated. In term of qualitative approach, “any description of a small business must be premised on the notion that they are not simply scaled down large businesses” (Westhead & Storey 1996, MacGregor et al 2005) and although major distinguishing factor is size, SME has a number of particular traits that separate them from larger enterprises.
Numerous researches conducted so as to isolate the traits unique to SMEs. Brigham & Smith (1967) found that SMEs “tended to be more prone to risk than their larger counterparts”. Later studies is also supported this view (Walker, 1975, Delone,1988). Cochran (1981) suggested that “SMEs tended to be subject to higher failure rates”, while Rotch (1987) argued that “SMEs had inadequate records of transactions”. Welsh & White (1981) compared SMEs with their larger counterparts found that “SMEs suffered from a lack of trained staff and had a short-range management perspective. They termed these traits 'resource poverty’ and suggested that their net
6
effect was to magnify the effect of environmental impact, particularly where information systems were involved”. Some recent studies have been supported these suggestions that have argued most SMEs lace of technical expertise (Barry & Milner 2002) or in other words, they can not undertake technical enhancements because lack of adequate capital (Gaskill et al., 1993; Raymond 2001). According to Reynolds (1994), most SMEs are weak in the extend of product/service range available to customer and suffer from inadequate organisational planning (Tetteh & Burn 2001, Miller & Besser 2000).
Several of recent researches (see Reynolds et al (1994), Murphy (1996), Bunker & MacGregor 2000) have found there are big differences between the management style of large businesses and SMEs. These researches have shown that, among other features, “SMEs tend to have a small management team (often one or two individuals)”. The management style will have little control over its environment and be strongly affected by the owner and the owner’s personal idiosyncrasies.
2.1.3 Current situation of Vietnam E- Commerce Industry
The pace of change today is much faster; Vietnam is on track to grow extremely rapidly and is actually expected to step into the digital era. The advances in the field of modern technology and Internet embrace with the open arms for companies to widen their scale of operation. Over the last decade, efforts to promote e-commerce in Vietnam have brought about certain effects. Purchase online via the website has become more popular, from airline tickets, hotel reservations, and payment of electricity, telecommunications, buy books or perfume. The method of payment and delivery has operated more flexibly to suit those who do not have credit cards, for example, online payment to bank transfer or delivery receipt.
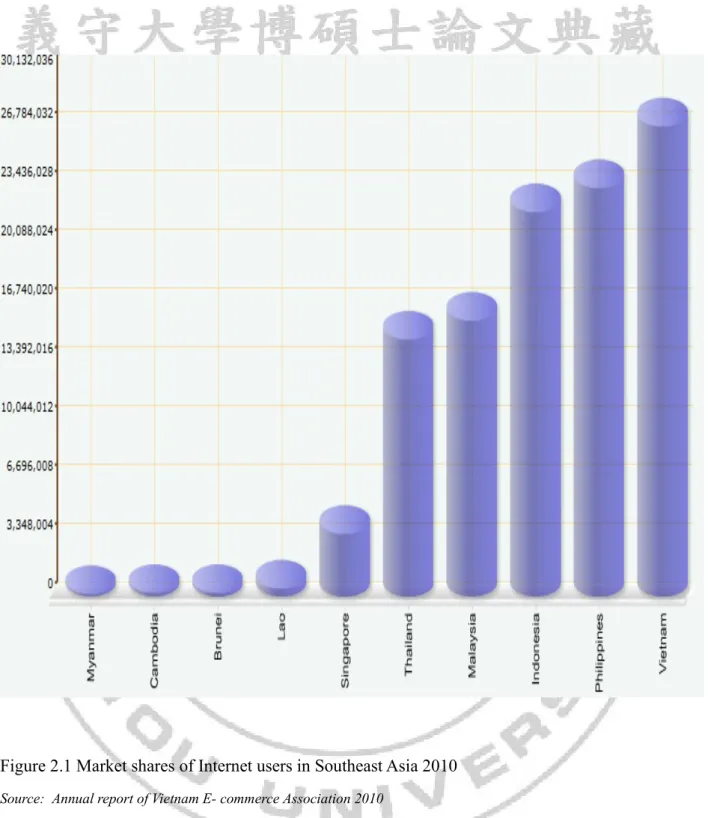
According to Annual report of Vietnam E- commerce Association, the number of Internet users in Vietnam, accounting for a third of the population and 60 % of them go online to find out information about the product before purchase. From 2000 to 2012, average Internet popularization rate in Vietnam increased by 20 %, the highest in the Asian region. A survey by the Ministry of Commerce with 3,400 enterprises in many sectors shows that 60 % of the applied form of commercial transactions electronically.
7
Figure 2.1 Market shares of Internet users in Southeast Asia 2010 Source: Annual report of Vietnam E- commerce Association 2010
In annual report of 2013, there was a remarkable increase in total e-commerce revenue (2.2 billion dollars), approximately 120 USD. The most preferable online product is clothes and beauty cosmetic, accounting for 62%, technology and Electrolux items shared the same proportion with home appliances made up to 35% and 32% respectively. By far, customers spend money on purchasing airplane tickets on Internet, comprising just 25%. Recent Revenues from
e-8
commerce in Vietnam are over $ 2 billion, equivalent to 2.5 % of GDP, and are forecast to $ 6 billion figure in 2015.
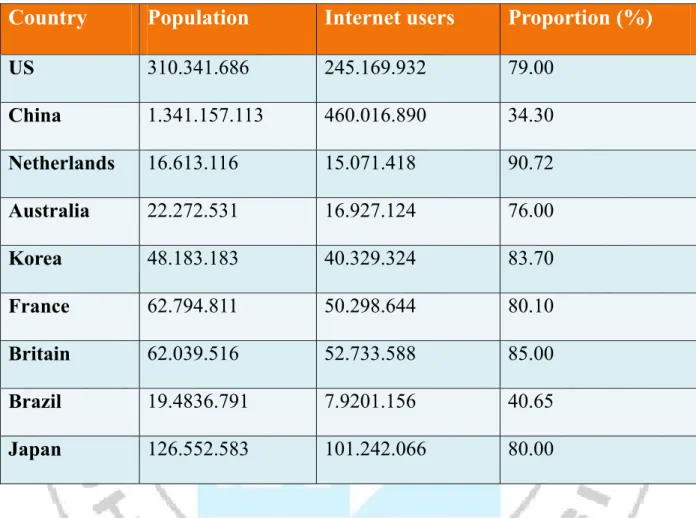
Table 2.1 Market shares of Internet users in some countries in the world
Country
Population
Internet users
Proportion (%)
US
310.341.686
245.169.932
79.00
China
1.341.157.113
460.016.890
34.30
Netherlands
16.613.116
15.071.418
90.72
Australia
22.272.531
16.927.124
76.00
Korea
48.183.183
40.329.324
83.70
France
62.794.811
50.298.644
80.10
Britain
62.039.516
52.733.588
85.00
Brazil
19.4836.791
7.9201.156
40.65
Japan
126.552.583
101.242.066
80.00
Many customers still feel unsafe when online shopping in Vietnam. Compared to other countries in the world, Vietnam is proud of being one of the top countries which has the great proportion of people use Internet. However, in spite of these advantages, the growth of online business in Vietnam is facing many barriers, including its market environment less reliable. The customer did not even seem to trust when shopping online. They feel protected rights or security information. Thanks to the cooperation among the bank websites; today payment has become easier, the online payment still remains to be a very small part in electronic trading in Vietnam. Despite the above barriers, foreign companies still see a lot of potential opportunities in a country of nearly 80 million people.
9
2.2 E- Loyalty
2.2.1 The concept of e-loyalty
Many early researches concentrated on that loyalty refers to repeat purchase behavior of customer. According to purchase patterns of customer, Brown (1952) separated customer loyalty into four main parts including “undivided loyalty, divided loyalty, unstable loyalty and no
loyalty”. Lipstein (1959) & Kuehn (1962) suggested that buyer loyalty is measured by the
product repurchasing probability. Other researchers Day (1969); Jacoby & Chestnut, (1978) stated that loyalty behavior could not make easy sense of as it found hard to differentiate true loyalty and fake loyalty, for instance, from a lack of available alternatives for e-commerce consumers. In the other hand, some researchers criticized that loyalty is measured by “means of
an attitudinal dimension in addition to a behavioral dimension”. Engel & Blackwell (1982)
expressed that loyalty referring to “the preferential, attitudinal and behavioral response toward
one or more brands in a product category expressed over a period of time by a consumer.”
Jacoby (1971) suggested that customer loyalty which leads to a psychological process is considered as a biased behavioral purchase process. According to Assael (1992, p. 87), brand loyalty is “a favorable attitude toward a brand resulting in consistent purchase of the brand
over time.” Keller (1993) was also supported this rationale with the view that loyalty exists when
“favorable attitudes for a brand are manifested in repeat buying behavior”. Gremler (1995) proposed that measurement of loyalty have both the attitudinal and behavioral dimensions. In the current study, the researcher defines loyalty as a customer’s favorable attitude toward the e-commerce businesses that repeating buying behavior then tailor the choice of that customer about products, services, and shopping experience.
2.2.2 The influencing factors of E- Loyalty
2.2.2.1 Perceived Service Quality
The concept of Perceived Service Quality
Although the importance of service quality has become more and more popular (Qualls and Rosa, 1995), it finds difficult to build an abstract and elusive construct (Brown and Swartz, 1989) For measuring service quality, there are many instruments and alternative service quality model
10
developed in the empirical literature. Eshghi et al. (2008) suggested that service quality is considered as the entire reflection of customers towards company’s service.
Many researchers (Kim et al. 2006, Santos 2003) suggested that perceived service quality in an e-commerce setting is described as the comments of customers about the quality of online products or service without direct interchange. This research deployed the definition of Cretu & Brodie (2007) “the perceived service quality is not exactly the association of a commercial brand and logo but is an association that projects the state of a special aspect of the specific value of a commercial brand and logo”.
Soteriou & Chase (1998) stated that services and customers have a close Cretu & Brodie, 2007 although services are intangible assets. Service with superior quality will increase customer satisfaction (Brady & Robertson, 2001). Babakus (2004) said that improvements of service quality will enhance “retention and loyalty of existing customer and attract new customers”. Evaluation of service quality does not only involve the “outcome quality of service”, but also depend on the “process of service delivery”.
The SERVQUAL Scale
Sasser et al. (1978) identified three specific dimensions including levels of material, facilities and personnel to measure service quality. Gronroos (1984) suggested that technical quality (what is provided for customer), functional quality (how the firm delivers service for customer) and image quality (company’s reputation for quality) is considered as a mediator on which whole service quality could be evaluated. Six years later, in Gronroos’s research (1990), he changed his mind to build a different way to measure overall perceived service quality. New model consisted of six generic factors namely “professionalism and skills, reliability and trustworthiness, attitudes and behavior, accessibility and flexibility, recovery, and reputation and credibility”. Despite of reseachers’ contribution, the dimensions could not be limited in any harsh empirical testing.
In the mid-1980s, Parasuraman et al. (1985) conducted a research of service quality which is one of the most systematic research about this topic. This research showed that service quality can be measured by the gaps between actual service performance and customer expectations. The study stated that ten dimensions comprising “tangibles, reliability, responsiveness, competence,
11
courtesy, credibility, security, communication, understanding, and access in the original model of service quality”.
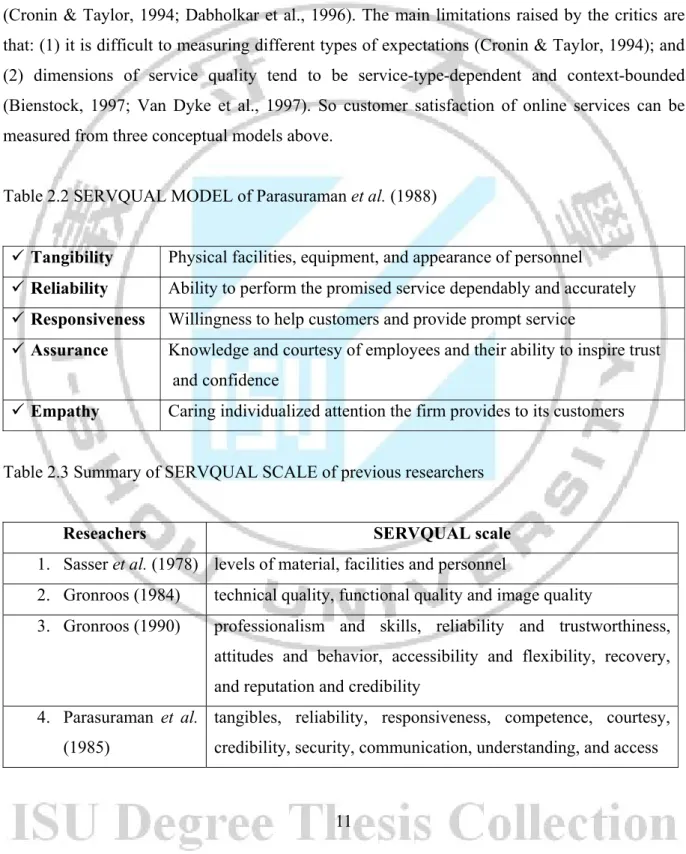
However, in the subsequent study of Parasuraman et al. (1988), five elements of dimension were impressed: “tangibles, reliability, responsiveness, assurance, and empathy”. Although SERVQUAL has some criticism, it has been applied to projects in various service industries (Cronin & Taylor, 1994; Dabholkar et al., 1996). The main limitations raised by the critics are that: (1) it is difficult to measuring different types of expectations (Cronin & Taylor, 1994); and (2) dimensions of service quality tend to be service-type-dependent and context-bounded (Bienstock, 1997; Van Dyke et al., 1997). So customer satisfaction of online services can be measured from three conceptual models above.
Table 2.2 SERVQUAL MODEL of Parasuraman et al. (1988)
Tangibility Physical facilities, equipment, and appearance of personnel
Reliability Ability to perform the promised service dependably and accurately Responsiveness Willingness to help customers and provide prompt service
Assurance Knowledge and courtesy of employees and their ability to inspire trust and confidence
Empathy Caring individualized attention the firm provides to its customers Table 2.3 Summary of SERVQUAL SCALE of previous researchers
Reseachers SERVQUAL scale
1. Sasser et al. (1978) levels of material, facilities and personnel
2. Gronroos (1984) technical quality, functional quality and image quality
3. Gronroos (1990) professionalism and skills, reliability and trustworthiness, attitudes and behavior, accessibility and flexibility, recovery, and reputation and credibility
4. Parasuraman et al. (1985)
tangibles, reliability, responsiveness, competence, courtesy, credibility, security, communication, understanding, and access
12 5. Parasuraman et al.
(1988),
Tangibles, reliability, responsiveness, assurance, and empathy.
Some studies on determining factors of online service quality have been addressed. The significant factors of online service quality – user interface, responsiveness, personalization and perceived security.
User Interface Quality
Van Riel et al. (2004) argued that one of the most important channels through which customers stay in touch with online buyers is through website. According to Park & Kim (2003), either product or service information quality which is seen as the customer perception of the quality of information is given by a website. Mcknight et al. (2002) claimed that the quality of user interface could also be a fundamental factor of online customer trust.
Responsiveness
Zeithaml et al. (2002), to measure service quality, they used responsiveness to find out the quality of servive by consumers (Voss 2000). It measures a company’s ability and willingness to provide prompt service when customers have questions/problems (Gefen 2002, Zeithaml et al. 2002). Understanding customer requirements and developing the service based on responsive feedback enhances service satisfaction and also increases customer trust (Gefen 2002, Gummerus et al. 2004). However, in practice, Kaynama and Black, (2000) many companies have not reached the success on this.
Personalization
Zeithaml et al. (2002) stated that “the personalization or customization part is possible seen as the empathy dimension of the traditional SERVQUAL”. It shows the level of which information or a service is tailored to satisfy each customer (Lee, 2005). In term of online personalization concept, there are four factors: “personal attention; preferences; understanding the specific needs of customers; and information regarding the products modification”. Anderson and Kerr (2002) argued that one of the three rules for success of e- commerce business is to make it individual.
Perceived security
Regarding the reliability of used online payment means and data exchange, safety in website is still considered reflects most perceptions among the most important factors (Kolsaker & Payne,
13
2002). Dong & Her (2004) stated that the lack of perceived security in e-commerce will represent a risk and a main obstacle an e-commerce development to any company.
Figure 2.2 Perceived Service Quality Framework
2.2.2.2 E- Satisfaction
Customer satisfaction is how supplied product/service meet customer needs and expectations. Geyskens et al. (1996) found that it has close relationship to interpersonal trust. Zins (2001) believed that the more satisfied the companies achieved from customer, the more customer keep loyalty with them. Buying states can be seen as the reflection of customer satisfaction (Chang, 2008). In other words, it is “the result of customer experience during different stages of buying” (Lin, 2011).
In term of E-satisfaction, it includes customer judgments about buying experiences on the internet. Therefore, experiences of using internet service will be compared with the experiences from traditional service by customers.
There are some theories and confusion about relationship between service quality and customer satisfaction/dissatisfaction (Chong et al. 1997). In the first theory, customer satisfaction is defined as a “perception on the basis of a specific service encounter” (Cronin & Taylor 1992) while service quality is described as attitude or judgment regarding the superiority of the service (Parasuraman et al. 1988). Oliver’s (1981) viewed that satisfaction is “an emotional reaction which influences attitude and is consumption-specific”. Developed from this perspective, Cronin & Taylor (1994) argued that “customer satisfaction should be limited to transaction-specific judgments and service quality to long-term attitudes”. Thus, service quality evaluation over time
User interface Responsiveness Personalization Perceived Security Perceived Service Quality
14
was caused by cumulative influence of customer satisfactions (Parasuraman et al. 1994). Thus, “satisfaction/dissatisfaction of customer is an antecedent of service quality” (Bitner 1990, Bitner & Hubbert 1994, Bolton & Drew 1991, Oliver 1981).
Besides, in the second theory that “service quality is an antecedent of customer satisfaction and that customer satisfaction refers to a stronger influence on future purchase intentions than service quality” (Anderson & Sullivan 1993, Cronin & Taylor 1992, Gotlieb et al. 1994, Woodside et al. 1989). Furthermore, satisfaction appears as a inclusive concept and to be more extensive, that “is based upon perceived service quality and other factors” (Zeithaml & Bitner 1996).
However, it is the fact that the impact of consumer satisfaction on their loyalty is more complicated. In the view of Fisher (2001), he stated that satisfaction just represented a small percentage of customer decision on changinng to other providers. Besides, other researchers objected to Fisher that consumer satisfaction is considered as one of the most basic and principal elements in affecting loyalty (Anderson & Lehmann, 1994). Study of Anderson & Srinivasan (2003) showed that the belief of customer on providers’ products as well as value which they are worth to receive from the companies concentratedly build to online loyalty. In the study of Cyr (2008) it was found that in three countries Canada, Germany, and China, website satisfaction is closely related to loyalty.
2.2.2.3 E- Trust
E- commerce consumer trust is significantly affected by perceived privacy which is the way the providers solved customer private database (Flavia´n & Guinalý´u, 2006). According to Coulter (2002), customer trust was beliefs that online providers try to build about products as well as services at the present and in the foreseeing period in the concept of e- commerce business. In the reseach of Chaudhuri & Holbrook (2001), customer loyalty had a strong impact on the retaining and keeping the relationship between providers and customers contributed by trust. Futhermore, Cyr (2008) stated that in Germany and China, website trust and loyalty have a very close relationship, but this relationship is weak in Canada. In addition, Kim et al. (2009) found that American online customer trust is strongly related to loyalty.
In the literature of service quality, trust was described as ‘trust in the service itself’ (Parasuraman et al. 1985, 1988). Typically, a customer must buy a service before experiencing it so that service quality has a crucial relationship to manage trust. In addition, “trust in a relationship is a kind of
15
insurance against risks and unexpected behavior”. It partly depends on experience from interacting with another party. For example, a service provider who has been doing business with a customer for some time and meet her expectation will be received trust from that customer. Cowles (1997); Doney & Cannon (1997); Chaudhuri & Holbrook (2001) found that “the role of trust in building and maintaining loyalty has been researched extensively in both consumer and business-to-business buying situations”.
Trust plays an major role in augmenting both attitudinal and behavioral loyalty which in turn affects marketing outcome regarding factors such as price elasticity and market share maintenance. In term of e-loyalty, “several structural models of trust and its relationship to repeat visits to e-commerce sites have been presented” (Jevons & Gabbott, 2000). In addition, a unique and important dimension of e-loyalty is privacy (Ratnasingham, 1998).
2.3 Summary of construct definitions and references
After providing all academic papers which discussed about the variables in relationship with customer loyalty, the research would like to give summary table to clarify more clearly.
Table 2.4 Summary of construct definitions and references
Variables Definitions
References
User Interface Quality
Either product or service information quality which is seen as the customer perception of the quality of information is given by a website
Park & Kim (2003)
Responsiveness
a company’s ability and willingness to provide prompt service when customers have questions/problems
Zeithaml et al. (2002)
Personalization
the degree to which information or a service is tailored to meet the needs of the individual visitor
Lee (2005)
Perceived security perceptions regarding the reliability of the payment methods used and the
Kolsaker & Payne (2002)
16
mechanisms of data transmission and
storage
E- Satisfaction
the result of customer experience during different stages of buying
(Lin, 2011)
E- Trust
customer trust was beliefs that online providers try to build about products as well as services at the present and in the foreseeing period in the concept of e- commerce business
Coulter (2002)
E- Loyalty
a customer’s favorable attitude toward the e-retailer that results in repeat buying behavior then tailor the choice of products, services, and shopping experience for that customer.
17
Chapter 3 METHODOLOGY
3.1 Conceptual framework
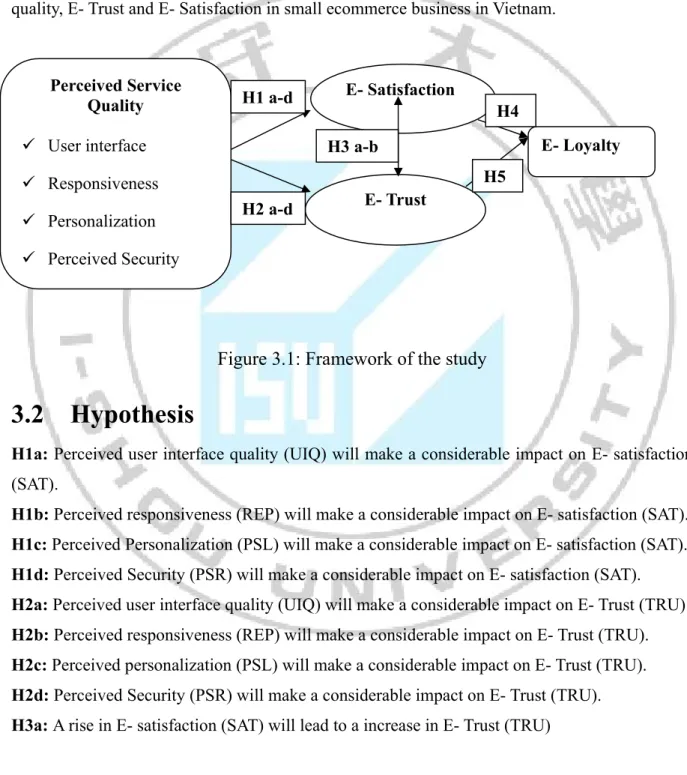
Based on the literature review, Figure 3.1 shows the research conceptual framework which explains the relationship among E- Loyalty and the determinants including Perceived service quality, E- Trust and E- Satisfaction in small ecommerce business in Vietnam.
Figure 3.1: Framework of the study
3.2 Hypothesis
H1a: Perceived user interface quality (UIQ) will make a considerable impact on E- satisfaction
(SAT).
H1b: Perceived responsiveness (REP) will make a considerable impact on E- satisfaction (SAT). H1c: Perceived Personalization (PSL) will make a considerable impact on E- satisfaction (SAT). H1d: Perceived Security (PSR) will make a considerable impact on E- satisfaction (SAT). H2a: Perceived user interface quality (UIQ) will make a considerable impact on E- Trust (TRU) H2b: Perceived responsiveness (REP) will make a considerable impact on E- Trust (TRU). H2c: Perceived personalization (PSL) will make a considerable impact on E- Trust (TRU). H2d: Perceived Security (PSR) will make a considerable impact on E- Trust (TRU). H3a: A rise in E- satisfaction (SAT) will lead to a increase in E- Trust (TRU)
E- Loyalty E- Satisfaction E- Trust Perceived Service Quality User interface Responsiveness Personalization Perceived Security H1 a-d H2 a-d H3 a-b H4 H5
18
H3b: A rise in E- Trust (TRU) will lead to a increase in E- satisfaction (SAT) H4: A rise in E- Satisfaction (SAT) will lead to a increase in E- Loyalty (LOY). H5: A rise in E- Trust (TRU) will lead to a increase in E- Loyalty (LOY)
3.3 Variables
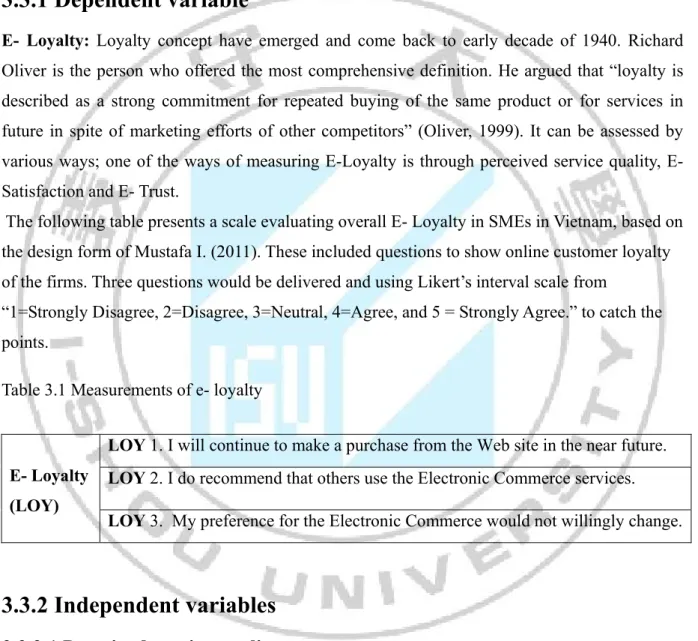
3.3.1 Dependent variable
E- Loyalty: Loyalty concept have emerged and come back to early decade of 1940. Richard
Oliver is the person who offered the most comprehensive definition. He argued that “loyalty is described as a strong commitment for repeated buying of the same product or for services in future in spite of marketing efforts of other competitors” (Oliver, 1999). It can be assessed by various ways; one of the ways of measuring E-Loyalty is through perceived service quality, E- Satisfaction and E- Trust.
The following table presents a scale evaluating overall E- Loyalty in SMEs in Vietnam, based on the design form of Mustafa I. (2011). These included questions to show online customer loyalty of the firms. Three questions would be delivered and using Likert’s interval scale from
“1=Strongly Disagree, 2=Disagree, 3=Neutral, 4=Agree, and 5 = Strongly Agree.” to catch the points.
Table 3.1 Measurements of e- loyalty
E- Loyalty (LOY)
LOY 1. I will continue to make a purchase from the Web site in the near future. LOY 2. I do recommend that others use the Electronic Commerce services. LOY 3. My preference for the Electronic Commerce would not willingly change.
3.3.2 Independent variables
3.3.2.1 Perceived service quality
Perceived service quality reflects customers’ opinion of the product/service’s ability to fulfill their expectations. It is based on the company’s image, customer’s experience with the company’s other product/service, the leaders’ opinion, and customer’s peer group.
19
User interface, responsiveness, personalization and perceived security are four dimensions that construct the service quality.
The table presents a scale evaluating perceived service quality in SMEs in Vietnam based on the mixed design form some researchers. Twelve questions would be delivered and using Likert’s interval to catch the points.
For UIQ, REP
1=Strongly Disagree, 2=Disagree, 3=Neutral, 4=Agree, and 5 = Strongly Agree.
For PSL, PSR
1=Not Important at All, 2=Not Very Important, 3=Quite Important, 4=Very important, 5 = Essential
Table 3.2 Measurements of Perceived Service Quality
Independent Variable Operating Variables Items Sources Perceived service quality Perceived User Interface Quality (UIQ)
UIQ 1. The design on the site is
attractively displayed for customer (Colors, contents, pictures, videos and comments) Parasuraman et al. 1985, 1988, Zeithaml et al. 2000 Ribbink et al. 2004
UIQ 2. The information on the site is
well organized to understand and follow
UIQ 3.The Web site does not increase
my search effectiveness.
Perceived Service Responsiveness (REP)
REP1. It is easy to get in contact with
the online organization which provides the online services.
Norizan, M. & Nor, A. (2008)
REP2.The online organization is
20
3.3.2.2 E- Satisfaction
Satisfaction is related to a pleasurable level of consumption fulfillment that include levels of under-or-over-fulfillment (Oliver, 1981). Tse & Wilton (1988) raised the view that “satisfaction is the evaluation of the perceived discrepancy between prior expectations and the actual performance after the consumption”.
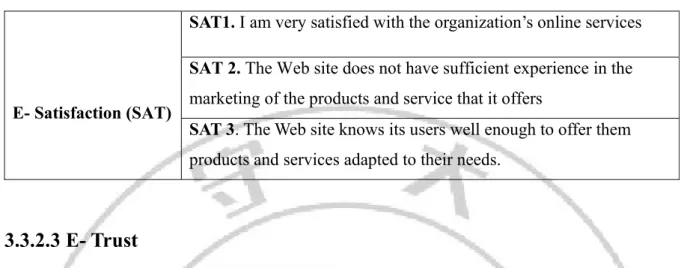
The table presents a scale evaluating overall E- Satisfaction in Vietnamese SMEs based on the design form of Mustafa I. (2011). These included questions to show online customer loyalty of the firms. Three questions would be delivered and using Likert’s interval scale from “1=Strongly Disagree, 2=Disagree, 3=Neutral, 4=Agree, and 5 = Strongly Agree.”
REP3. The online organization is
prompt in replying to queries
Perceived Personalization (PSL)
PSL 1. I feel my personal needs have
been met when using the site or doing transactions with the online organization.
Norizan, M. & Nor, A. (2008)
PSL 2. This site provides me with
information and products according to my preferences.
PSL 3. I feel a safe when sending my
personal information to the Web site.
Perceived Security (PSR)
PSR 1 The Web site has mechanism to
ensure the safe transmission of its users' information.
Mustafa I. (2011)
PSR 2. The Web site has sufficient
technical capacity to ensure that the data I send cannot be modified by hackers
PSR 3. Purchasing on the Web site will
21 Table 3.3 Measurements of e- satisfaction
E- Satisfaction (SAT)
SAT1. I am very satisfied with the organization’s online services SAT 2. The Web site does not have sufficient experience in the
marketing of the products and service that it offers
SAT 3. The Web site knows its users well enough to offer them
products and services adapted to their needs.
3.3.2.3 E- Trust
The benefits and advantages of trust to any businesses have been widely recognized. Luhmann (1988) described trust as “a risky advance concession in the hope or expectation of a positive outcome”. Trust has also been characterized as “the willingness of a party to be vulnerable to the actions of another party based on the expectations that the other party will perform a particular action important to the trust, irrespective of the ability to monitor or control that other party” (Mayer et al. 1995).
The table presents a scale evaluating overall E- Trust in Vietnamese SMEs, based on the design form of Mustafa I. (2011). These included questions to show online customer loyalty of the firms. Three questions would be delivered and using Likert’s interval scale from “1=Strongly Disagree, 2=Disagree, 3=Neutral, 4=Agree, and 5 = Strongly Agree.” to catch the points.
Table 3.4 Measurements of e- trust
E- Trust (TRU)
TRU 1. E-product/service provider does not usually fulfill the promises
and commitments he assumes.
TRU2. E-product/service provider is trustworthy and honest.
TRU3. E-product/service provider instills the confidence in his customers.
3.3.2.4 Demographic Factors
22
items including age, gender, monthly income, job and mobile operators which customers use. 1. Age group: Basing on three criteria comprising of less than 25, 25~ 40, and greater than 40 2. Gender: Grouping in male and female.
3. Monthly Income: Dividing into four types which are under 3 million VND, 3~7 million VND, 7~ 15 million VND, and over 15 million VND.
4. Job: Including Student, Employee
Table 3.5 Measuring scale for demographic factors
Variable Scale Objective
Age group Nominal The paper wants to consider how difference about the level of loyalty among target users to online service based on age group, gender, income, and job.
Gender Nominal Monthly Income Rate
Job Nominal
3.4 Research Design
The research was carried out to achieve the given important objectives and answer all the questions, so the design of research contributes enormously to the success of the study. There are two major kinds of research design which comprise quantitative and qualitative approach. Each still own strength but does not avoid some limitations; however depending on the purpose of the study, quantitative approach prefers more. In order to meet the goal of exploring satisfaction of a considerable amount of customers in mobile service provider field, quantitative approach should be noticed. To be more specific, internet- based surveys are sent to 200 consumers since Babbie (2004) noted that survey is considered as a superior technique to measure attitude or behaviors of respondent in a big population. Moreover, Buckingham & Sauder (2004) suggested that survey is approached to deliver questionnaires for respondents and taking back statistical data involving in their actions or reflection.
3.5 Sampling Design
23
which retain online customers, so 500 random surveys with highly expected returned percentage (70%) of 350 surveys were delivered to users from different ages, gender, jobs of schools including universities, colleges and high schools or government were selected to become the subjects of this research. Secondly, due to the limitation of time, the research can only be carried out within the scope of three most crowded cities consisting of Hanoi Capital, Hai Phong City and Ho Chi Minh City in Vietnam.
3.6 Data Collection
Questionnaires were translated into Vietnamese to get easily understanding and accurate information from respondents. The main collection data method is depended on the questionnaires from customers through internet Google doc via mainly email Facebook and Gmail. It finds very useful in limited time and receives a large number of reply. Indeed, Zinkmud (2003) stressed the benefits of internet based surveys “will become the trend for survey methods in the future, because it provide speediness and cost effectiveness” p.17.
3.7 Data Analysis
After finishing collecting data, the survey was used Statistical Package for the Social Sciences (SPSS) version 16.0 (is known as the name of Predictive Analytics Software (PASW) which was acquired by IBM in October 2009). The statistical procedures for quantitative research include Descriptive Statistic, One sample T- Test Analysis, Mean and Standard Deviation, Reliability and Linear Regression Analysis.
Descriptive statistics was selected in order to understand the characteristics of the sample and included measures of central tendency and variability (frequency, distribution, range and standard deviation) for selected variables (Age, Gender, Income and Job).
Testing of One-Sample T-Test is the test of the hypothesis (H3a-b) of the overall average, which is used in case we want to analyze the link between two independent variables.
Reliability Analysis of variables measured by Cronbach's Coefficient Alpha which results of the tests was allowed to build the appropriate scale for the research model Linear Regressions would help to solve in finding the interrelated relationship among three main variables with customer loyalty (H1 a-d, H2 a-d, H4 and H5).
24
Chapter 4 RESULT AND DISCUSSION
This chapter included two important parts of the study: firstly, showing the analysis and results of data collected in the surveys from 355 respondents (return rate is 71 % of 500 people) about customer loyalty evaluation to small and medium companies in Vietnam. The statistical analyses used in this study include:
(1) Description of the survey participants- Demographic analysis. (2) Mean and standard deviation summary
(3) Reliability Cronbach’s Alpha (4) One sample T- Test Analysis (5) Hypothesis Test.
Pearson correlation of all dependent and independent variables, Linear Regression
(6) ANOVA Analysis the differences among demographic factors related to e-loyalty
Secondly, the research would like to discuss more about the results by comparing with previous studies.
25
A. Data Analysis
4.1 Descriptive Analyses
In this study, from the total number of 355 participants who involved in the survey, the majority is Male with 232 persons accounting for 65.4%, and female rate only makes up 34.6% (123 respondents). The most popular age range is between 25 and 40 years old with 45.4% of total respondents while the least group was over 40 years old. The age of respondents under 20 years old comprised up to 35.5 % of the total respondents. Most of respondents who were interviewed received a low salary with only less than 3 million VND per month. However, as can be seen from the below table, there was a surprising number of participants who earns much money from 7 to 15 million VND and accounting for 27.6 % of the total people. The left two income groups (3~7 million VND, Over 15 million VND) shared quite the same percentage were just nearly 15% which provided the average salary of respondents was rather acceptable. Moreover, the middle class people played a significant role in purchasing goods by electronic ecommerce. Table 4.1 Summary of Demographic characteristics
Measures Items Frequency
(N) Percentage (%) Total participants 355 100 Gender Male 232 65.4 Female 123 34.6
Age Less than 25 126 35.5
25~ 40 161 45.4
Greater than 40 68 19.2
Monthly Income Under 3 million VND 154 43.4
3~7 million VND 59 16.6 7~ 15 million VND 98 27.6 Over 15 million VND 44 12.4 Jobs Employee 182 51.3 Student 116 32.7 Others 57 16.1
26
4.2 Mean and Standard Deviation
This factor is used the scale interval from 1 to 5 corresponding to a gradual increase of agree level to evaluate the factors determining service quality from customer’s perspectives. The results shows that perceived service quality consisting of four independent sub- variables satisfied the conditions of mean (3.21- 4.75) and standard deviation (.462- 1.277)
Table 4.2 Summary of Mean and Standard Deviation
Perceived Service Quality
Mean
Standard Deviation
UIQ1. The design on the site is attractively displayed for customer (Colors,
contents, pictures, videos and comments). 4.18 .612
UIQ2. The information on the site is well organized to understand and follow. 4.67 .648
UIQ 3. The Web site does not increase my search effectiveness. 3.21 .854
REP1. It is easy to get in contact with the online organization which provides
the online services. 4.33 .729
REP2. The online organization is interested in getting feedback. 4.25 1.060 REP3. The online organization is prompt in replying to queries. 4.28 .949
PSL1. I feel my personal needs have been met when using the site or doing
transactions with the online organization. 3.77 1.277
PSL 2. This site provides me with information and products according to my
preferences. 4.20 .979
PSL 3. I feel a safe when sending my personal information to the Web site. 4.18 1.185 PSR1. The Web site has mechanism to ensure the safe transmission of its users'
information. 4.55 .676
PSR 2. The Web site has sufficient technical capacity to ensure that the data I
send cannot be modified by hackers 4.75 .462
27
4.3 Reliability Cronbach’s Alpha
The scale of research is often assessed through methods Cronbach alpha reliability coefficient. Criteria for evaluating a standard scale is: Cronbach's Alpha analysis: α> 0.6, the correlation coefficient gross> 0.3 (Nunnally & Burnstein, 1994). However it should be noted that if the Cronbach Alpha too high (> 0.95), it appears likely variations in the observed excess scales. All below variables after eliminating rubbish items got a high score which was over .7 and the highest rate shown by E- Trust (.928).
Table 4.3 Summary of Reliability level
Variables Items Items deleted Cronbach’s
Alpha Perceived service
quality
User interface UIQ1, UIQ3 .884
Responsiveness REP1, REP3 Personalization PSL 1 Perceived Security PSR 2
E- Satisfaction SAT1 No .870
SAT2 No
SAT3 No
E- Trust TRU1 Yes .928
TRU2 No
TRU3 No
E- Loyalty LOY 1 No .704
LOY 2 No
28
4.4 One sample T- test Analysis
The T- test results clarified exactly close relationships among customer satisfaction and trust in E- commerce case, thus H3a-b was totally supported with confidence interval 95%, Sig< .005. Indeed, any firms which want customer continue to repurchase their product, should pay more attention on satisfaction and trust relationship building construction. People have stronger sense of customer satisfaction if they put their belief on the brand. That is the reason why the research would like to explore closer relationship between two major factors of mutildimenstional framework of e- loyalty.
Table 4.4 Summary of Hypothesis result of H3a-b
Hypothesis Factor
Sig.
Support
H3a
E- Satisfaction E- Trust .000 YESH3b
E- Trust E- Satisfaction .000 YES4.5 Linear regression analysis
In order to test the importance of each hypothesized path in the research framework, Cavana et al (2007) found out regression analysis is popularly statistical method used to examine the relationship among independent and dependent variables by equitation.
First of all, the equation was applied to test the impacts of these factors on online customer satisfaction, including User interface, Responsiveness, Personalization and Perceived Security. The results indicated that PSR was the most determining element on customer satisfaction in online market, strongly supporting H1d. Besides, REP and PSL are seen to considerably influential ECS supporting H1b-c. However, the left variable UIQ are found negative impact in ECS, thus H1a was not supported. R² of the first equation is .561, which means most of the 56.1% of the variance in ECS is explained by REP, PSL, and PSR variables.
29 Table 4.5 Equation 1 of E-satisfaction - Model Summary
Model R R Square Adjusted R Square Std. Error of the Estimate 1 .749a .561 .556 .55671
a. Predictors: (Constant), PSR, REP, UIQ, PSL b. Dependent Variable: SAT
Table 4.6 Equation 1 of E-satisfaction - Coefficients
Model Unstandardized Coefficients Standardized Coefficients t Sig. B Std. Error Beta 1 (Constant) 1.601 .233 6.869 .000 UIQ -.526 .080 -.408 -6.613 .000 REP .322 .045 .409 7.108 .000 PSL .271 .061 .324 4.468 .000 PSR .494 .051 .458 9.699 .000
a. Dependent Variable: SAT
Equation 1: Y ( E- Satisfaction)= 1.601-.526 UIQ+ .322 REP + .271 PSL+ .494 PSR
Next to the second equation tested the influence of each of the factors: UIQ, REP, PSL, and PSR on online buyers’ trust. Table 5 displayed that PSL had the most significantly influences TRU, thus positively supporting H2c, followed by UIQ. Both REP and PSR variables did not make positive effect on TRU construct, therefore not supporting H2b, H2d respectively. R² of the second equation is 0.196 which means 19.6% of the variance in TRU is mainly explained by PSR, REP, PSL, UIQ variables.
30 Table 4.7 Equation 2 of E- Trust- Model Summary
Model R R Square Adjusted R Square Std. Error of the Estimate 1 .443a .196 .187 .80987
Table 4.8 Equation 2 of E- Trust- Coefficients
Coefficients Model Unstandardized Coefficients Standardized Coefficients t Sig. B Std. Error Beta 1 (Constant) 2.631 .339 7.759 .000 UIQ .238 .116 .172 2.055 .041 REP -.476 .066 -.561 -7.219 .000 PSL .527 .088 .588 5.986 .000 PSR -.260 .074 -.224 -3.514 .000
a. Dependent Variable: TRU b. Predictors: (Constant), PSR, EP, IQ, PSL
Equation 2: Y (E- Trust)= 2.631+ .238 UIQ -.476 REP + .527 PSL -.260 PSR
Last but the not least, the results in Table 4.13 showed linear regression between E-loyalty and independent variables (E- Satisfaction and E- Trust). Based on the decision coefficient (coefficient of determination) R2 (R Square) from table above show that a combination of variables (E- Satisfaction and E- Trust) causes 71.5% of the deviation explained.
31 Table 4.9 Equation 3 of E- Loyalty- Model Summary
Model Summary Model R R Square Adjusted R Square Std. Error of the Estimate 1 .846a .715 .713 .49773
a. Predictors: (Constant), TRU, SAT b. Dependent Variable: LOY
In addition, the results also show that the value of the sum of squares regression (Regression- Sum of Square) is 218.672, the value of F = 441.351 and p (sig.) = 0.000 (< 0.05) proves this regression model is statistically significant. In other words, there is concern linear relationship among combinations of these variables.
Table 4.10 Equation 3 of E- Loyalty- ANOVA Analysis
ANOVA
Model Sum of Squares df Mean Square F Sig.
1 Regression 218.672 2 109.336 441.351 .000a
Residual 87.201 352 .248
Total 305.873 354
a. Predictors: (Constant), TRU, SAT b. Dependent Variable: LOY
The result shows that satisfaction and trust are key factors for both customer loyalty in online market in Vietnam with coefficients of 62.6% and 88.9% respectively. However, shoppers had tendency to buy online products when they relied more than satisfied on the website.
32 Table 4.11 Equation 3 of E- Loyalty- Coefficients
Coefficientsa Model Unstandardized Coefficients Standardized Coefficients t Sig. B Std. Error Beta 1 (Constant) -1.429 .182 -7.835 .000 SAT .626 .034 .562 18.500 .000 TRU .889 .031 .859 28.261 .000
a. Dependent Variable: LOY
Equation 3 (E- loyalty) Y= -1.429+ .626 SAT+ .889 TRU
Table 4.12 Results of Linear Regression Analysis
Hypothesis Independent Variable
Dependent Variable
β Coefficients P- value Hypothesis Result
H1a UIQ SAT -.526 .000 Accepted
H1b REP SAT .322 .000 Accepted
H1c PSL SAT .271 .000 Accepted
H1d PSR SAT .494 .000 Accepted
H2a UIQ TRU .238 .041 Accepted
H2b REP TRU -.476 .000 Accepted
H2c PSL TRU .527 .000 Accepted
H2d PSR TRU -.260 .000 Accepted
H4 SAT LOY .626 .000 Accepted
H5 TRU LOY .889 .000 Accepted
33
4.6 One- way ANOVA Analysis
The content of this section is aimed to test the difference between demographic variables (age, gender, income and job) with independent variable (e-loyalty). To accomplish this, the researcher conducted analysis of one-way variance ANOVA. The difference was statistically significant with a 95% confidence level (or significance level Sig. <.05).
4.6.1 Age
As can be seen from the below table of Test of Homogeneity of Variances, Sig= .000 < .05, there is a difference among variances of the respondents’ age. Thus, the ANOVA test is not continued.
Table 4.13 Test of Homogeneity of Variances- Age
Test of Homogeneity of Variances
LOY Levene Statistic df1 df2 Sig.
100.739 2 352 .000
Table 4.14 ANOVA - Age
ANOVA
LOY
Sum of Squares df Mean Square F Sig.
Between Groups 42.204 2 21.102 28.171 .000
Within Groups 263.669 352 .749
Total 305.873 354
4.6.2 Gender
The gender’s homogeneity variances showed there was no difference with Sig. = .253 > .05; however, Sig. = .584 > .05 in ANOVA table illustrated that male and female shoppers had the same loyalty for online market in Vietnam.
34 Table 4.15 Test of Homogeneity of Variances- Gender
Test of Homogeneity of Variances
LOY Levene Statistic df1 df2 Sig.
1.312 1 353 .253
Table 4.16 ANOVA - Gender
ANOVA
LOY
Sum of Squares df Mean Square F Sig.
Between Groups .260 1 .260 .300 .584
Within Groups 305.613 353 .866
Total 305.873 354
4.6.3 Monthly Income
As can be seen from the below table of Test of Homogeneity of Variances, Sig= .000 < .05, there is a difference among variances of the respondents’ income per month. Thus, the ANOVA test is not continued.
Table 4.17 Test of Homogeneity of Variances- Income
Test of Homogeneity of Variances
LOY Levene Statistic df1 df2 Sig.
35 Table 4.18 ANOVA- Income
ANOVA
LOY
Sum of Squares df Mean Square F Sig.
Between Groups 140.117 3 46.706 98.903 .000
Within Groups 165.756 351 .472
Total 305.873 354
4.6.4 Job
As can be seen from the below table of Test of Homogeneity of Variances, Sig= .000 < .05, there is a difference among variances of the respondents’ job. Thus, the ANOVA test is not continued.
Table 4.19 Test of Homogeneity of Variances- Job
Test of Homogeneity of Variances
LOY Levene Statistic df1 df2 Sig.
36 Table 4.20 ANOVA- Job
ANOVA
LOY
Sum of Squares df Mean Square F Sig.
Between Groups 38.992 2 19.496 25.714 .000
Within Groups 266.881 352 .758
Total 305.873 354
B. Discussions
The results drawn from the above parsimonious models provided some significant supports for the study framework displayed. First of all, in order to respond two first research questions finding out the key determining factors of both e- satisfaction and e- trust in case of Vietnamese online market culture, shoppers believed that personalization played the most crucial role in contributing e-commerce customer satisfaction, but it was found to be one of the weakest determinants of e-trust. Besides, perceived security in the awareness of Vietnam Internet shoppers was the most important factor for e- satisfaction but not for e- trust. It is the same to responsiveness element found positive effect on satisfaction but not on trust.
Research question 1. What are the determining factors of overall e-service satisfaction? Research question 2. Which is the most significant element of online customer trust?
Secondly, although user interface quality of online services factor was recognized to significantly influence online trust, its coefficient is insignificant factor in consumer satisfaction. This result seemed to confirm Roy’s findings et al. (2001) who stated the impact of online website user interface quality on customer trust. However, the study found that information quality do not make any changes in e-commerce service trust, which completely differs from with the study of McKnight et al. (2002) who argued that user interface quality is a former of an online customer’s trust. This means that customers can feel satisfied in spite of the bad design of website and user
37
interface. In order to improve customer trust, the online shop owner should pay more attention on service content and quality of website interface.
Thirdly, the study analysis was found in line with the findings of Ribbink et al. (2004) which implied that customer satisfaction drove and had a positive and significant relationship with trust. Moreover, the results also confirmed that e- trust is an outcome of e-satisfaction.
Fourthly, the direct impact of satisfaction and trust was also found to be positively and significantly related to customer loyalty (both emotional and behavioral dimensions of customer loyalty).
Lastly, after testing the differences in keeping loyalty with the online companies among respondents with regards of age, gender, income and job, the research did find any differences.