The Effect of Varied Enhancements to
Animated Instruction on Tests Measuring
Different Educational Objectives
Chih-Lung Lin*
Abstract
The primary purpose of this study was to investigate the effect of varied
enhancements to animated instruction on the achievement of different educational objectives in a self-paced and web-based instructional setting. Four different treatment groups that were examined were (1) Static Visual, (2) Animation Only, (3) Animation with Advance Organizers, and (4) Animation with Adjunct Questions and Feedback. One way multiple analysis of variance (MANOVA) indicated that there were no statistically significant differences in achievement among students in each treatment group at the .05 level. Discussions, conclusions, and recommended future studies are provided in this paper.
Key words: Animation, Adjunct Question, Advance Organizer, Feedback
I. Introduction
The new technologies are facilitating a diversity of message designs. With the dramatic advances in computer technology, it is possible for educators and
instructional designers to develop instructional environments providing students with a wide variety of learning experiences through the use of multimedia technologies such as text, graphics, sound and animation. Among the most dynamic features are sound and animation. Software developers are now adding these features, with ease of use, into their line of instructional products, such as Macromedia Director,
Dreamweaver, and Flash. Consequently, more and more instructional designers and developers have utilized and incorporated animation into their instructional lessons and educational programs.
Several benefits of using animation are cited in the literature. Attention-gaining, the first step of Gagné’s (1985) nine events of instruction, provides an obvious rationale of the use of animation (Rieber, 1990a). In contrast to a static background, animated presentations can enhance figures’ prominence (Hannafin & Peck, 1988).
Animation can be utilized with or without supplementary text to demonstrate or elaborate a lesson fact, concept, rule, or procedure when used for direct teaching (Rieber, 1990a). Used as part of practice strategies in instruction, computer animation can be used as feedback to student responses as well (Rieber, 1996). In addition, computer animation sequences can easily be revised over time as needed by changes in various instructional requirements (Milheim, 1993).
However, the effects of animation in CBI have shown inconsistent results. Some studies have provided positive effects (e.g. Baek & Layne, 1988; Mayer & Anderson, 1991; Rieber, 1990b; Rieber, 1991b), while others have shown no significant
The studies cited above mainly focused on experimentation with computer animation alone, while the present experiment investigated the effects of varied instructional strategies (advance organizers and adjunct questions and feedback) embedded within computer animation, against the static visual control condition.
Rieber (1990a, p. 82) suggested that, “when learners are novices in the content area, they may not know how to attend to the relevant cues or details provided by
animation” …“even though students may be attending to surface features of an animated visual, they still may be unable to draw out important details,” and “more accurate perceptions were elicited when the animated graphic representation was coupled with an interactive instructional strategy requiring learners to attend to the information in the graphic.” In his later review of computer animation, one of his conclusions stated, “learners may need to be carefully cued to information contained in an animated display” (Rieber, 1994, p. 169). The above findings indicated that, by only looking at the movement of computer animation, learners might not be able to comprehend what is happening in the animation. Additional instructional strategies, such as advance organizers or adjunct questions and feedback used in this study, may be utilized to better help learners focus on the specific details in the animation and therefore understand what the animation is intending to show.
The purpose of this study is to create a learning environment using computer animation complemented with varied types of instructional strategies to improve on tests measuring different educational objectives. The need for this study is two-fold. First, it may help educators and instructional designers in making decisions on what educational objectives can benefit from the use of animation. Secondly, it can help educators and instructional designers in deciding whether additional instructional strategies should be embedded within animation.
Therefore, the results of this study will be more beneficial.
II. METHODS AND PROCEDURES
1. Research Objectives
The purpose of this study was to determine the effect of varied enhancements to animated instruction on tests measuring different educational objectives. Questions of interest include: Does animation improve student learning? Does computer animation complemented with varied instructional strategies improve student performance on tests measuring different educational objectives? The following subsections will describe research subjects, methods and procedures used in this study.
2. Subjects
Subjects for this study were 93 volunteers who are enrolled in educational psychology courses. This group of volunteers mainly consisted of undergraduate freshmen and sophomores. The volunteers who participated in the study received extra credit points from their instructor.
3. Instructional and Experimental Materials
The content of the lesson used in this study was adapted from paper-based text materials developed by Dwyer and Lamberski (1977) concerning the physiology and function of the human heart. The lesson consists of 1821 words. The lesson
includes factual, conceptual and problem solving information covering the parts of the heart, circulation of blood, cycle of blood flow and blood pressure. To allow the learners to interact with the visual animation, this lesson was developed in a
Web-based instruction format. The software packages used to develop instruction materials are Adobe Photoshop, Macromedia Dreamweaver, and Macromedia Flash 5. The instructional materials were developed by the researcher.
The series of evaluation test materials consists of a Drawing Test (20 items),
Identification Test (20 items), Terminology Test (20 items), and Comprehension Test (20 items). A fifth score, Total Comprehension Test, was the sum of all four scores of the individual criterion test. The total test provides a comprehensive assessment of the learner's overall understanding of the instructional program.
4. Independent Variables
The effects of two independent variables were examined in this study. The first factor, computer animation, represents how the students interact with the instructional content. The second factor was the two instructional strategies (advance organizers and adjunct questions and feedback) used in this study that were designed to help student better interact with the animation.
5. Dependant Variables
The dependent variables of this study were the achievement exhibited on tests containing four types of learning objectives. Developed by Dwyer (1978), achievement of the specific learning objectives was determined by the following criterion. A description of each criterion measure adapted from Dwyer (1978, p. 45-47) follows.
Drawing Test (20 items): The objective of the drawing test was to evaluate student
ability to construct and/or reproduce items in their appropriate context. The students were required to draw a representative diagram of the human heart and indicate the location of 20 specific areas discussed in the presentation from a list of specific terms. The quality of the drawing did not affect the test score. This test evaluated student learning of the location of specific parts of the heart. The drawing test is shown in Appendix B.
Identification Test (20 items): The identification test evaluated a student’s ability to
identification test is shown in Appendix C.
Terminology Test (20 items): The terminology test was designed to measure
student’s knowledge of specific facts, terms, and definitions by asking learners to answer multiple-choice questions that describe parts of the heart. The objectives measured by this type of test are appropriate to all content areas which require an understanding of factual material that is prerequisite to the learning of concepts, rules, and principles. The terminology test is shown in Appendix D.
Comprehension Test (20 items): Subjects are required to demonstrate their
understanding of how specific parts of the heart function in relation to other parts. Given the location of certain parts of the heart at a particular moment of its
functioning, the student was asked to locate the position of other specified parts of the heart at the same point in time. The comprehension test required that subjects thoroughly understand the heart, its parts, its internal functioning, and the
simultaneous processes which occur during the systolic and diastolic phases. This test was designed to measure a higher level cognitive task where the learner
understands what is being communicated and can use it to explain some other phenomenon occurring simultaneously. The comprehension test is shown in Appendix E.
Total Comprehension Test (80 items): This score is the composite score by adding
the scores of the previously described tests into a total test score. The purpose of this test was to measure the student’s total understanding of all the content material presented in the instructional unit.
6. Technical Production Techniques
Static Visual
The visuals used in this study were adapted from the instructional booklet developed by Dwyer and Lamberski (1977). Visuals from the booklet were first scanned into computer using Acer Prisa 320P scanner. The resolution 100 dpi (dot per inch) of each visual was chosen to balance out the images file size and clarity.
narratives and the visual to fit in computer screen without scrolling, the image sizes were adjusted. The largest image size is 500x350 pixels (picture element) while the smallest one is (400x300). Each image has been applied to a "drop shadow" effect supported by Adobe Photoshop 5.0 software. The purpose of applying the effect to the images was two-fold. First, it made the images look nicer. Second, students could easily distinguish between narratives and images by the different look of the images.
Animated Visuals
The animated visuals were created using software called Macromedia Flash 5.0. The reason for using this software is because the end product has a very small size and good quality. It is best for use on the Internet, and most recent browsers have the player built in for playing Flash animation. A screen size of 750x550 pixels was chosen to fit most of the computer screens with 800x600 and higher resolution.
Web Pages
After all the visuals and animation were created, the researcher used a web page editor, Macromedia Dreamweaver 3.0, to generate the instructional web pages. A total of 24 web pages were created for each treatment. The narratives were typed and its font is Arial and size is 10 for each page for consistency.
7. First Item Analysis
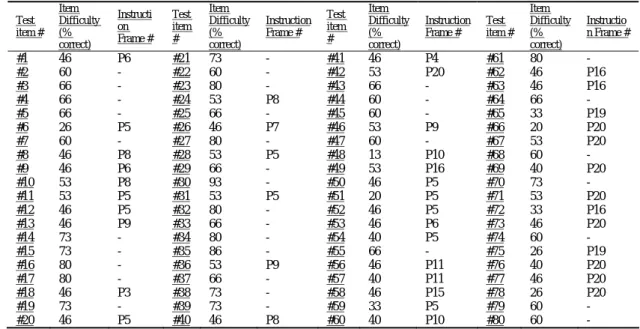
The first item analysis was conducted in order to determine which parts of the instruction needed improvement. Test items with item difficulty coefficient below 60% were considered as difficult items. Table 1 lists the item number according to the frame number where the instruction occurred.
8. Second Item Analysis
Table 1 Difficulty of Test Items and Its According Instruction Frame Number for the First Item Analysis Test item # Item Difficulty (% correct) Instructi on Frame # Test item # Item Difficulty (% correct) Instruction Frame # Test item # Item Difficulty (% correct) Instruction Frame # Test item # Item Difficulty (% correct) Instructio n Frame # #1 46 P6 #21 73 - #41 46 P4 #61 80 - #2 60 - #22 60 - #42 53 P20 #62 46 P16 #3 66 - #23 80 - #43 66 - #63 46 P16 #4 66 - #24 53 P8 #44 60 - #64 66 - #5 66 - #25 66 - #45 60 - #65 33 P19 #6 26 P5 #26 46 P7 #46 53 P9 #66 20 P20 #7 60 - #27 80 - #47 60 - #67 53 P20 #8 46 P8 #28 53 P5 #48 13 P10 #68 60 - #9 46 P6 #29 66 - #49 53 P16 #69 40 P20 #10 53 P8 #30 93 - #50 46 P5 #70 73 - #11 53 P5 #31 53 P5 #51 20 P5 #71 53 P20 #12 46 P5 #32 80 - #52 46 P5 #72 33 P16 #13 46 P9 #33 66 - #53 46 P6 #73 46 P20 #14 73 - #34 80 - #54 40 P5 #74 60 - #15 73 - #35 86 - #55 66 - #75 26 P19 #16 80 - #36 53 P9 #56 46 P11 #76 40 P20 #17 80 - #37 66 - #57 40 P11 #77 46 P20 #18 46 P3 #38 73 - #58 46 P15 #78 26 P20 #19 73 - #39 73 - #59 33 P5 #79 60 - #20 46 P5 #40 46 P8 #60 40 P10 #80 60 -
Table 3 Comparisons between First Item Analysis and Second Item Analysis Item # Instruction Frame # First Item Analysis Item Difficulty (% correct) Second Item Analysis Item Difficulty (% correct) Item # Instruction Frame # First Item Analysis Item Difficulty (% correct) Second Item Analysis Item Difficulty (% correct) #1 P6 46 68 #52 P5 46 52 #6 P5 26 68 #53 P6 46 48 #8 P8 46 6 4 #54 P5 40 64 #9 P6 46 5 2 #56 P11 46 48 #10 P8 53 6 0 #57 P11 40 52 #11 P5 53 8 4 #58 P15 46 28 #12 P5 46 7 6 #59 P5 33 64 #13 P9 46 6 0 #60 P10 40 64 #18 P3 46 64 #62 P16 46 32 #20 P5 46 76 #63 P16 46 56 #24 P8 53 68 #64 P20 66 40 #26 P7 46 76 #65 P19 33 44 #28 P5 53 68 #66 P20 20 16 #29 P5 66 56 #67 P20 53 64 #31 P5 53 52 #69 P20 40 44 #33 P5 66 52 #70 P6 73 36 #36 P9 53 72 #71 P20 53 76 #40 P8 46 64 #72 P16 33 44 #41 P4 46 48 #73 P20 46 56 #42 P20 53 76 #75 P19 26 8 #45 P10 60 48 #76 P20 40 56 #46 P9 53 48 #77 P20 46 40 #48 P10 13 8 #78 P20 26 56 #49 P16 53 60 #79 P20 60 56 #50 P5 46 44 #80 P20 60 52 #51 P5 20 20 - - - -
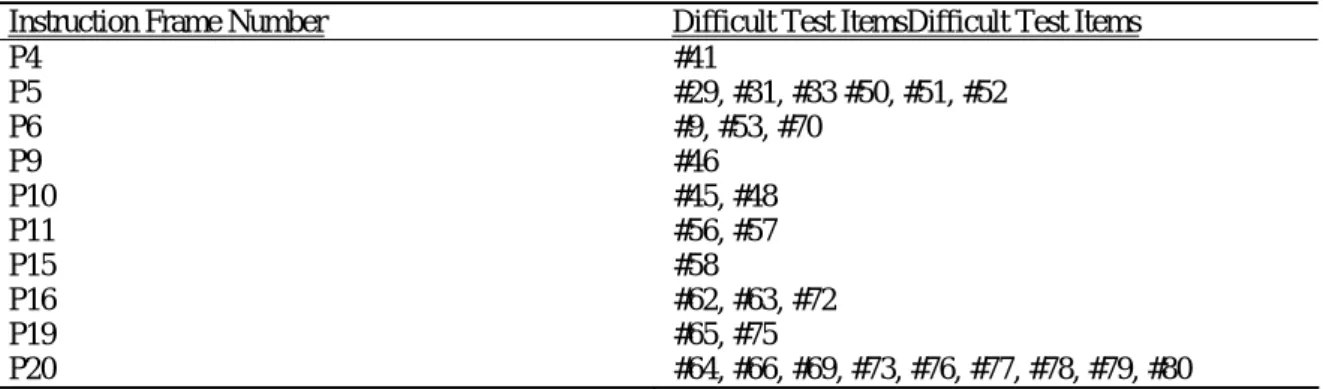
Table 4 Instructional Frame Number and Its Difficult Test Items.
Instruction Frame Number Difficult Test ItemsDifficult Test Items
P4 #41 P5 #29, #31, #33 #50, #51, #52 P6 #9, #53, #70 P9 #46 P10 #45, #48 P11 #56, #57 P15 #58 P16 #62, #63, #72 P19 #65, #75 P20 #64, #66, #69, #73, #76, #77, #78, #79, #80
9. Instructional Treatments
Four web-based treatments were developed for this study. They contain identical instructional content, but the type of presentation varies. The treatments are described below.
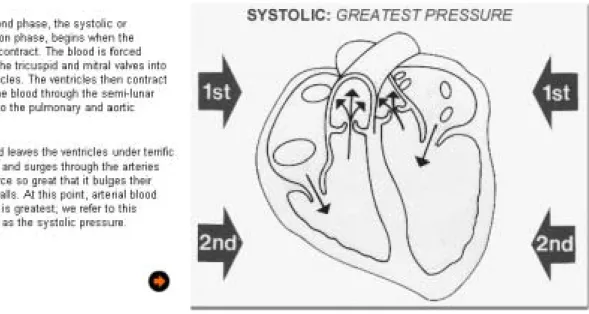
Static Visual (Control):
screen movement. This group served as the control group. A sample screen from this treatment is shown in Figure 1.
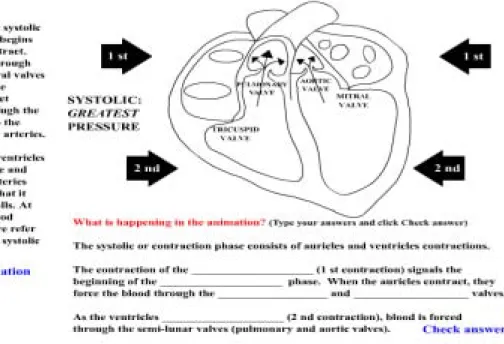
Animation only:
The students in this group were provided instructional scripts with an animated visual on selective frames identified by item analyses. Within those animated frames of instruction, the students were asked to read the script first and click on the button “Click to show animation” to see the animation. After the animation had been shown once, the “go back” and “go forward” arrows appeared automatically. The students could view the animation as many times as they wanted by clicking the “Click to show
animation” button before advancing to the next frame.
There were two different types of animation in this treatment:
Progressive Reveal: this is a type of animation that entails a sudden change
of color or a sudden addition of graphic elements (Wilson, 1998). This type of animation can draw the learner’s attention to the important parts contained in the graphics. By looking at the suddenly added arrows, learners will be able to focus on the important elements and ignore the irrelevant details. With adding one component at a time to the whole graphic, students not only can effectively interact, process, and encode the information into their memory but also can be shown the relationships of the elements presented in the graphic.
Motion: this is a type of animation that simulates motion. In this study,
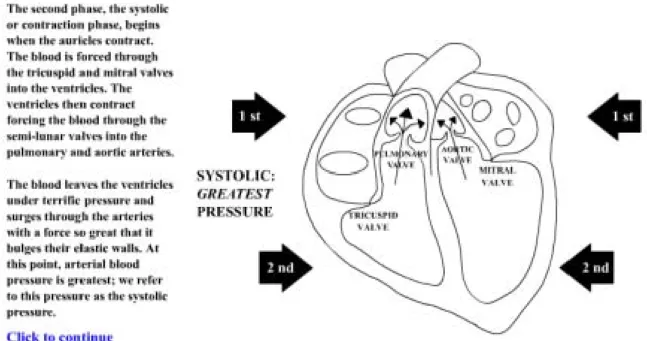
Animation with Advance Organizer:
The students in this group were provided instructional scripts with an animated visual on selected frames, identified by item analyses. Within those animated frames of instruction, the students were asked to read the script first and click on the button “Click to continue” to proceed. After the button has been clicked, the advance organizers that were designed to help students better process the animation appeared along with the “Click to
show animation” button. The students would read the advance organizers
the click the “Click to show animation” button to view the animation. After the animation had been shown once, the “go forward” and “go previous” buttons appeared for them to move on.
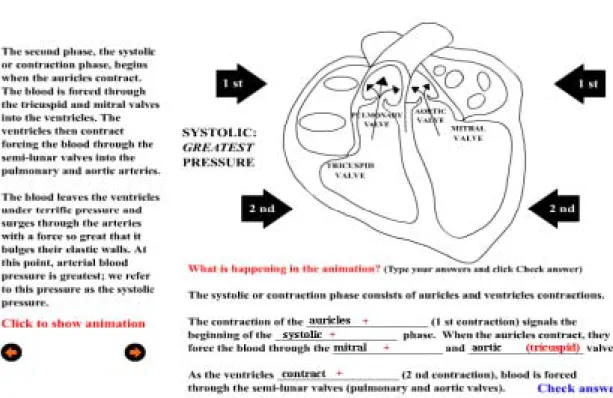
This treatment had the exact same animation as in the “animation only” treatment, and an added advance organizer appeared before the animation has been shown. This advance organizer described what was happening in the animation and was designed to help students better understanding the information provided by the animation. By reading the advance organizer, students were cued to the important information that animation was intended to provide. This would help students focus only on the important and neglect the trivial parts of the animation. Therefore only the important information would be encoded into students' long-term memory. A sample treatment is shown in sequence from Figure 3 to Figure 5.
Animation with Adjunct questions and feedback:
incorrect response, and the “go back” and “go forward” arrows appeared automatically. The students could view the animation and re-answer
adjunct question as long as they wanted before advancing to the next frame. This treatment used the same animation as in the “animation only” treatment, and added fill-in-the-blank adjunct questions after the animation had been shown once. These questions described what was happening in the animation and were designed to help students better understand the
information provided by the animation. Students were required to read the questions and also to overtly fill in their answers. Deeper mental thinking was elicited by this activity. In addition, by receiving feedback, students should have been able to correct their erroneous responses, which otherwise would be expected to persevere and interfere with future learning. A sample treatment is shown in sequence from Figure 6 to Figure 7.
Figure 1 A Sample of the Static Visual Treatment
Figure 3 A Sample of the Animation with Advance Organizer Treatment (First Screen)
Figure 5 A Sample of the Animation with Advance Organizer Treatment (Third Screen)
10. Pilot Study
In order to justify the implementation of a full-scale experiment, a pilot study was conducted using 43 Penn State students from Educational Psychology 14 class. Each of the 43 subjects was randomly assigned to one of the four treatment groups: 1) Control, 2) Animation only, 3) Animation with Advance Organizer, and 4)
Animation with Adjunct Questions and Feedback. Because each treatment group contained a small number of subjects (only 10 and 11 in each group), the results of this pilot study were not statistically analyzed. Only the mean scores from the total comprehension test were compared to see if there was an indication that one or more of the treatments appeared to be more or less effective in promoting learning.
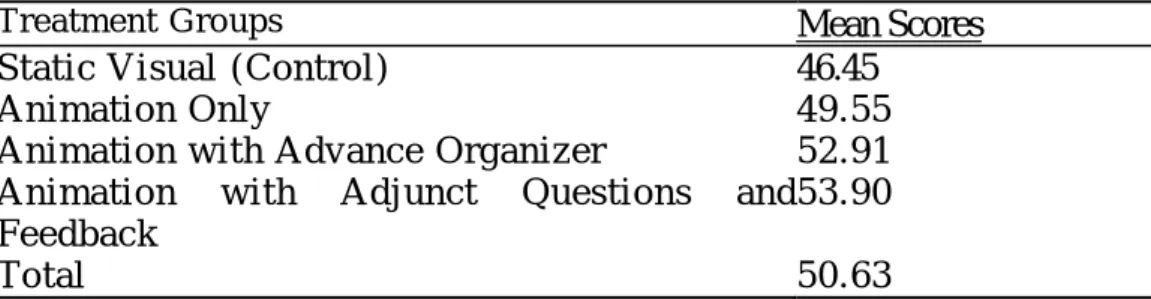
Table 5 Total Comprehension Test Mean Scores for Each Treatment Group in the Pilot Study (Highest possible score: 80)
Treatment Groups Mean Scores Static Visual (Control) 46.45
Animation Only 49.55
Animation with Advance Organizer 52.91 Animation with Adjunct Questions and
Feedback
53.90
Total 50.63
The mean scores for each treatment group are shown in Table 5. The scores indicate that while students who received the animated treatments produced higher mean scores than those in the control group, students in the animation with adjunct questions and feedback treatment group had the highest mean score (53.90).
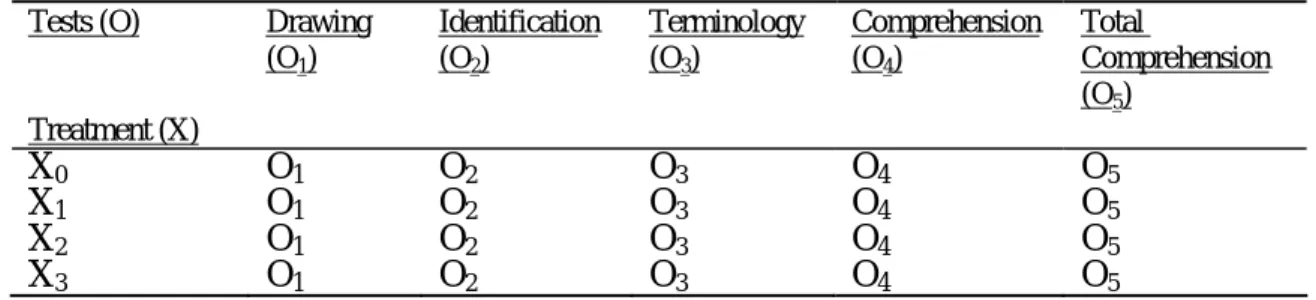
11. Experimental Design
A visual representation of the experimental design is shown in Table 3.6, which is similar to that used by Campbell and Stanley (1966), where X0 is the control group condition, X1 is the animation-only condition, X2 is the animation with advance organizer condition, X3 is the animation with adjunct questions and feedback condition. The post-tests or dependent measures are represented by O1, O2, O3, O4, O5 (drawing, identification, terminology, comprehension, and total
Table 6 Experimental Design Tests (O) Treatment (X) Drawing (O1) Identification (O2) Terminology (O3) Comprehension (O4) Total Comprehension (O5) X0 O1 O2 O3 O4 O5 X1 O1 O2 O3 O4 O5 X2 O1 O2 O3 O4 O5 X3 O1 O2 O3 O4 O5
12. Research Procedure
The instructional lesson was delivered to subjects in the computer lab, which had 30 working computers, in 202 Chambers Building at Penn State University. Each computer was labeled with a number from 1 to 30. All treatments were installed onto servers, so that they could be accessed easily for the purposes of random assignment.
Participants received a general explanation of the study at the time their
participation was scheduled. When they arrived for their scheduled participation, participants were randomly assigned to a computer which contained one of the four treatments (control, animation-only, animation with advance organizers, and animation with adjunct questions and feedback). The investigator explained their right of participation and had them sign the informed consent form. Only
participants who signed the informed consent form were allowed to participate in the study.
The investigator did an introduction to the participants about the study. During the introduction, the participants were informed about the testing procedure and about the approximate time it would take to complete the study. They were asked to place their complete focus on the learning at hand, and to participate as fully as possible in all aspects of the learning and testing.
Participants were asked to write down the computer number and follow the
After finishing the drawing test, participants handed it in, and then received a set of three tests – identification, terminology, and comprehension test. They completed the tests and handed them in to the investigator.
13. Statistical Analysis
The computer software Microsoft Excel and SPSS were used to perform statistical analyses on the data collected in this study. First, a check of the correlations between dependent variables was performed. When multiple dependent variables are correlated with each other doing separate tests for each dependent variable may result in increasing the chance that the results are due to chance (increased
experimentwise error). In this study, strong correlation between dependent
variables was set at the .7 level (Huch & Cormier, 1996). Therefore, if correlation coefficient is .7 or higher, Multivariate one-way ANOVA (one-way MANOVA) should be utilized. Otherwise, one-way analyses of variance (ANOVA) may be conducted separately on each dependent variable. If the overall MANOVA is significant, post hoc tests such as Scheffe or Tukey associated with ANOVA would be used to identify specifically where the differences exist. In the process of using MANOVA two assumptions were tested. First Box's M was checked to examine the assumption of equal covariance matrices. Second Levene's test was used to assess the equal error variance assumption. The results of those analyses are discussed in the following section.
RESULTS OF THE STUDY
The purpose of this chapter is to present the results of the quantitative analyses of the current study. The results are presented first by the descriptive statistics for the treatment groups followed by the analyses for the null hypotheses.
Table 7 Distribution of Subjects in Treatment Groups
Treatment Group Number of subjects Static Visual (Control) 22
Animation Only 24
Animation and Advanced Organizer 24 Animation with Adjunct Questions and Feedback
23
The data utilized in this study were compiled for the four dependent variable scores of those 93 students. Microsoft Excel and SPSS, were used to complete the necessary analysis of the data.
1. Test Reliabilities
Table 8 summarizes the Kuder-Richardson 20 reliability coefficients for the criterion measures. In all cases, the test reliabilities were satisfactory to allow meaningful discussion of the test results.
Table 8 Test Reliability Coefficients (N = 93)
Test # of Items K-R 20 Drawing 20 .90 Identification 20 .84 Terminology 20 .82 Comprehension 20 .82 Total Comprehension 80 .95
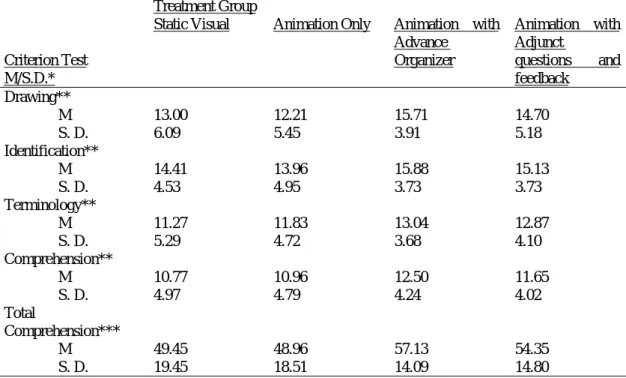
Table 9 Mean Score and Standard Deviation for Each Treatment Group on Each of the Criterion Tests Treatment Group
Criterion Test M/S.D.*
Static Visual Animation Only Animation with
* M stands for Mean; S. D. stands for Standard Deviation
** Highest possible score of test of drawing, identification, terminology, and comprehension is 20. *** Highest possible score of total comprehension test is 80.
2. Descriptive Statistics
Table 9 lists the mean scores and standard deviations for each treatment group on each of the criterion tests (namely, drawing test, identification test, terminology test, comprehension test, and total comprehension test). The highest possible score for the drawing, identification, terminology, and comprehension tests is 20 while the highest possible score for total is 80.
3. Analyses of Null Hypotheses
Ho1: There will be insignificant differences in achievement among students receiving varied animated treatments (Static Visual, Animation Only, Animation with Advance Organizers, and Animation with Adjunct Questions and Feedback) on tests designed to measure different educational objectives.
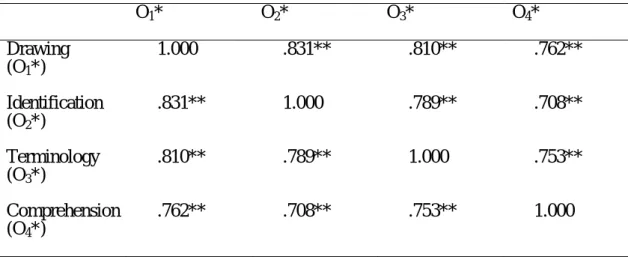
4. Correlations between Dependent Variables
Table 10 Correlations (Pearson Correlation) among Criterion Tests O1* O2* O3* O4* Drawing (O1*) 1.000 .831** .810** .762** Identification (O2*) .831** 1.000 .789** .708** Terminology (O3*) .810** .789** 1.000 .753** Comprehension (O4*) .762** .708** .753** 1.000 * O1 = D r a w i n g t e s t ; O2 = I d e n t i f i c a t i o n te s t ; O3 = T e r mi n o l o g y t e s t ; O4 = C o mp r e h en s i o n t e s t .
Table 11 Overall MANOVA Results (Pillai’s Trace F)
Pillai’s Trace Valve df F Sig
.117 12 .891 .556**
Based on the above MANOVA results, the analysis shows that there is no significant difference among treatments on any of the criterion tests (Sig = .556). Thus, this null hypothesis for this study cannot be rejected.
Ho2: There will be insignificant differences in achievement among students receiving varied animated treatments (Static Visual, Animation Only, Animation with Advance Organizers, and Animation with Adjunct questions and feedback) on test items identified as difficult items.
Table 12 The Means, and Standard Deviations of the Four Treatment Groups for the Thirty Question Criterion Posttest. (30 Difficult Items)
Group Treatment N Mean S. D.
1 Static Visual 22 15.05 7.17 2 Animation Only 24 15.54 6.39 3 Animation with Advance Organizer 24 17.42 5.79 4 Animation with Adjunct questions and feedback 23 16.69 5.19
Table 13 Results of the Analysis of Variance on the Thirty Difficult Items for the Four Treatment Groups (30 Items).
Sum of Squaresdf Mean Square F Sig. Between Groups 88.104 3 29.368 .772 .512 Within Groups 3383.703 89 38.019
Total 3471.806 92
No significant differences were found among the four treatment groups (F = .772 and p = .512). Therefore, the null hypothesis must be retained at the .05 level of significance. No follow-up tests were initiated. A discussion on these results will be provided in the next section.
IV. FINDINGS, CONCLUSIONS, AND
RECOMMENDATIONS
1. Findings
The statistical analyses reported in the previous section yielded the following results.
Findings: In the one-way multivariate analysis of variance (MANOVA), no
significant differences were found among the four treatment groups. Therefore, it was concluded that this null hypothesis cannot be rejected.
Ho2: There will be insignificant differences in achievement among students receiving varied animated treatments (Static Visual, Animation Only, Animation with Advance Organizer, and Animation with Adjunct Questions and Feedback) on test items identified as difficult items.
Findings: In the one-way analysis of variance (ANOVA), no significant differences were found among the four treatment groups. Therefore, it was concluded that this null hypothesis must be retained.
2. Discussion of Findings
Even though no statistically significant differences were found in the study, significant findings in practical ways will be discussed below.
The outcome of the criterion test scores showed that there were no significant differences among all of the four treatment groups (Static Visual, Animation Only, Animation with Advance Organizers, Animation with Adjunct Questions and Feedback). This finding has a significant implication for instructional designers. When designing instruction, instructional designers not only try to find ways to improve student learning but also consider some other factors. These factors include learning effectiveness, cost effectiveness (or cost benefit), and learning efficiency. The findings of this study did not show significant differences among the four treatment groups in the learning effectiveness category. However, if all four treatments were equally effective, the most economical one would be the best choice for instructional designers. Since developing animated treatments was far more time-consuming than building the static visual treatment, when taking cost factors into account, instructional designers should simply adopt static visuals rather than spend time to develop animated treatments. Furthermore, students in the static visual treatment spent 16 minutes on average to complete the lesson while students spent 18, 22, and 24 minutes in other animated treatment groups,
questions and feedback, respectively. In other words, in the area of learning efficiency, the static visual treatment was the most efficient.
The findings of insignificant differences in this study may contradict the theories found in the literature; however, they do support the findings of the studies
conducted by A. Caraballo (1985), J. Caraballo (1985), Chanlin (1999), Reed (1985), Rieber (1989), Rieber & Hannafin (1988), Torres (1990), and Wilson (1998). The above studies did not find any benefits of using animation against static visual treatments and concluded that computer animation might not significantly enhance the understanding of verbal materials. Nevertheless, there are several reasons that may influence the results of this current study.
The most likely reason for this study’s finding of no significant differences may be the subjects used. In this study, college-level students were used as subjects. Most college students are quite able to read from textbooks with static visuals. They probably can extract enough information from just reading text and looking at the static visuals. The functions of animation are to gain attention (Gagné, 1985) and/or to show motion (Rieber, 1990b). College students may be able to generate motion from their mental image by only reading the text description and looking at the static visuals. Similar results had been found in Wilson’s (1998) study that used the same content and had college students as the subjects. Wilson found no difference among his treatments and concluded that college students should learn as effectively if they were provided with static visuals. In addition, the functions of advance organizers and adjunct questions and feedback embedded in animation were to help students focus on and rehearse what the animation was intending to show. With the sophistication of college students, the additional help may not be necessary.
external instructional aids to comprehension” (p. 241). Rieber (1996) also suggests that novices are often unable to allocate attentional resources effectively, nor are they able to organize materials properly in order to construct meaning due to insufficient prior knowledge. In his study, Torres (1990) found that in the
animation treatment group, no significant differences were found in the mean scores between high and low prior knowledge levels for the Drawing and the Identification tests. He claimed that the animation treatment helped those students possessing low prior knowledge to perform up to the level of those students possessing high prior knowledge on the Drawing and Identification tests. Hence, “animation served as an attention-gaining device for the subjects with low prior knowledge as it focused their attention on critical learning characteristics, thus reducing the
differences in performance on the Drawing and the Identification tests” (Torres 1990, p. 69). In the current study, two treatments, the animation with advance organizers and the animation with adjunct questions and feedback, have produced a higher mean score and lower standard deviation than those found in all four criterion tests in the control group (see table 4.3). It is possible that these two treatments may have benefited some types of learners (i.e. low prior knowledge students). But the design of this study did not allow investigation of this. Future research is required to help clarify this issue.
Motivation could be a factor that affected the results of the present study. The subjects in this study were recruited with the incentive of some extra credit points; however, the extra credit points were awarded based on only participating in the experiment, not on the performance of the criterion tests. Therefore, students in this sample might have only shown up for the experiment but not tried their best on the tests. In addition, the content area of the study was not directly related to what they were learning in their class. Subjects may have had little interest in the content area.
Because of its highly developed, the content used in this study may affect the result. The content used in this study was adapted from paper-based text materials
motion, use of arrows in those images could serve the purpose of simulating motion. The main function of the use of the animation was to provide students motion. But if students could create motion by just studying the static visuals, it is possible that the use of the animation would not be more effective.
There are possible reasons for the animation with advance organizer treatment showing no significant difference from the other treatments. Theoretically, an advance organizer, while serving as an overview “emphasizes key concepts,
principles, and technical terms, as well as prepares students for the general structure or gestalt of the material to be mastered” (Hartley & Davies, 1976, p244).
However, the content used in this study contained a fair amount of text information and animation. Adding advance organizers with animation may cause students to be overloaded with information, which may add to the load in the short-term memory, which in turn may affect students' encoding of information into their long-term memory. Furthermore, advance organizers used in book chapters (e.g. lists of objectives) are not usually attended to by the readers. Students may not have paid attention to the advance organizers before they watched the animation, which would have caused the treatment to be ineffective.
Possible reasons the animation with adjunct questions and feedback treatment may have been ineffective are as follows. Since students know that the right answers will always be given after their responses, they may not pay full attention to the questions. They may simply type something without looking at the questions and click on the "check answer" button, then receive the right answers. No deep mental processing would occur if students were not actively engaged in answering the questions.
3. Conclusions
feedback embedded, the animation is not more effective. Given the conditions listed above, the static visual can be as effective as this array of animated treatments. For educators and instructional designers, these findings imply that, for the
population of college level students and content of this nature, it might not be worthwhile to spend time and effort to develop and program animation into computer-based instruction. Students in this population can acquire this type of information equally well when only static visuals are provided.
The results of this study provide some practical implications for designers and developers of instructional materials using animation. Designing a
computer-based learning environment involves much more than simply
incorporating dynamic product features such as animation into a lesson. Other factors may need to be considered before the use of animation. This study helps us to understand that care must be taken when incorporating animation into an
instructional lesson since animation does not always guarantee effective learning. More research in this area is required.
4. Recommendations for Future Research
Based on the findings of this study, on the discussion about the possible
explanations of why the results were not as expected, on the research process and the experience acquired by the investigator while conducting the experiment, some suggestions for future research are as follows:
1. Study the differential effects of these strategies on different content areas that are related to the interest of the students.
2. Study the differential effects of these strategies on younger populations. 3. Study the differential effects of these strategies on different learning
objectives, including problem solving.
4. Study the differential effects of animation in different learning domains rather than cognitive (e.g. affective and psychomotor).
6. Replicate this study with a larger sample of subjects. A power analysis could be conducted to determine the number of subjects needed in each group to increase the statistical power.
7. Develop different interactive strategies to complement animation other than those used in this study.
8. Use a visual instead of verbal posttest to see if it makes a difference in student performance.
9. Run this study with a series of delayed post-tests along with immediate tests. This would help to measure the long-term effect of different types of animated strategies.
V. REFERENCES
Anderson, R.C., & Biddle, W. B. (1975). On asking people questions about what they are reading. In G. Bower (Ed.), The psychology of learning and motivation (Vol. 9). New York: Academic Press.
Anderson, R. C., Kulhavy R. W., & Andre, T. (1971). Feedback procedures in programmed instruction. Journal of Educational Psychology, 62(2), 148-156. Anderson, R. C., Kulhavy R. W., & Andre, T. (1972). Conditions under which
feedback facilitates learning from programmed lessons. Journal of Educational
Psychology, 63(3), 186-188.
Andre, T. & Thieman, A. (1988). Level of adjunct question, type of feedback, and learning concepts by reading. Contemporary Educational Psychology, 13(3), 296-307.
Atkinson, R.C., & Shiffrin, R. M. (1968). Human memory: A proposed system and its control processes. In K. Spence and J. Spence (Eds.), The psychology of
learning and motivation (Vol. 2). New York: Academic Press.
Ausubel, D. P. (1963). The psychology of meaningful verbal leaning. New York: Grune & Stratton.
Ausubel, D. P. (1968). Educational psychology: a cognitive view. New York: Holt, Rinehart, and Winston.
Ausubel, D. P., Novak, J. D., & Hanesian, H. (1978). Educational psychology: a
Baek, Y. K. & Layne, B. (1988). Color, graphics, and animation in a
computer-assisted learning tutorial lesson. Journal of Compute-Based Instruction,
15(4), 131-135.
Barnes, B., & Clawson, E. U. (1975). Do advance organizers facilitate learning? Recommendations for further research based on the analysis of thirty-two studies.
Review of Educational Research, 45, 637-659.
Bork, A. (1981). Learning with computers. Billerica, MA: Digital Press.
Brown, J. (1958). Some test of the decay theory of immediate memory. Quarterly
Journal of Experimental Psychology, 10, 12-21.
Caraballo, A. (1985). An experimental study to investigate the effects of computer
animation on the understanding and retention of selected levels of learning outcomes. Unpublished doctoral dissertation, The Pennsylvania State University.
Caraballo, J. (1985). The effect of various visual display modes in computer-based
instruction and language background upon achievement of selected educational objectives. Unpublished doctoral dissertation, The Pennsylvania State University.
Chanlin, L. J. (1998). Students' cognitive styles and the need of visual control in animation. Journal Educational Computing Research, 19(4), 353-365.
Chanlin, L. J. (1999). Visual treatment for different prior knowledge. International
Journal of Instructional Media, 26(2), 213-219.
Childress M. D. (1995). Effects of three multimedia instructional presentation
formats containing animation and narration on recall and problem-solving performance. Unpublished doctoral dissertation, Virginia Polytechnic Institute
and State University.
Coulshed, V. (1993). Adult learning: implications for teaching in social work education. British Journal of Social Work, 23, 1-13.
Dempsey, J. V., Driscoll, M. P. & Swindell, L. K. (1993). Text-based feedback. In J. V. Dempsey & G. C. Sales, eds. Interactive instruction and feedback, 21-54. Englewood Cliffs, NJ: Educational Technology.
Driscoll, M. P. (1994). Psychology of learning for instruction. Boston: Allyn & Bacon.
Duchastel, P. C. & Nungester, R. J. (1984). Adjunct question effects with review.
Contemporary Educational Psychology, 9(2), 97-103.
Gall, M. D., Borg, W. R. & Gall, J. P. (1996). Educational research: An
introduction (6th ed.). New York: Longman publishers.
Gagné, R. M. (1977). Conditions of learning. New York: Macmillan Publishing Co. Gagné, R. M. (1985). The conditions of learning (4th edition). New York: Holt,
Rinehart, and Winston.
Glover, J. A. (1989). Improving readers' estimates of learning from text: the role of inserted questions. Reading Research and Instruction, 28(3), 68-75.
Grabowski, B. (1996). Generative learning: Past, present, and future. In D. H. Jonassen, ed. Handbook of research for educational communications and
technology, 897-918. New York, NY: Macmillan.
Hamaker, C. (1986). The effects of adjunct questions on prose learning. Review of
Educational Research, 56(2), 212-242.
Hannafin, M., & Peck, K. (1988). The design, development, and evaluation of
instructional software. New York: MacMillan.
Hartley, J., & Davies, I. K. (1976). Pre-instructional strategies: The role of pretests, behavioral objectives, overviews, and advance organizers. Review of Educational
Research, 46, 239-265.
Hays, T. A. (1996). Spatial abilities and the effects of computer animation on short-term and long-term comprehension. Journal of Educational Computing
Research, 14(2), 139-155.
Horton, D., & Turnage, T. (1976). Human learning. Englewood Cliff, NJ: Prentice-Hall.
Huch, S. W. & Cormier, W. H. (1996). Reading statistics and research. New York: HarperCollins publishers.
Johnson, D. W., & Johnson, R. T. (1993). Cooperative learning and feedback in technology-based instruction. In J. V. Dempsey & G. C. Sales, eds. Interactive
instruction and feedback, 133-157. Englewood Cliffs, NJ: Educational
Technology.
King, A. (1992). Comparison of self-questioning, summarizing, and
notetaking-review as strategies for learning from lecture. American Educational
Klatzky, R. (1980). Human memory: Structures and processes. San Francisco: W. A. Freeman.
Kulhavy, R. W. & Stock, W. A. (1989). Feedback in written instruction: the place of response certitude. Educational Psychology Review, 1(4), 279-308.
Kulhavy, R. W. & Wager, W. (1993). Feedback in programmed instruction:
historical context and implications for practice. In J. V. Dempsey & G. C. Sales, eds. Interactive instruction and feedback, 3-20. Englewood Cliffs, NJ:
Educational Technology.
Lalley, J. P. (1998). Comparison of text and video as forms of feedback during computer assisted learning. Journal of Computing Research, 18(4), 323-338. Lin, X., Hemlo, C., Kinzer, C. K., & Secules, T. J. (1999). Designing technology to
support reflection. Educational Technology Research and Development, 47(3), 43-62.
Mayer, R. E. (1979). Can advance organizers influence meaningful learning?
Review of Educational Research, 49, 371-383.
Mayer, R. E., & Anderson, R. B. (1991). Animations need narrations: An
experimental test of a dual-coding hypothesis. Journal of Educational Psychology,
83(4), 484-490.
Mayer, R. E., & Anderson, R. B. (1992). The instructive animation: Helping students build connections between words and pictures in multimedia learning.
Journal of Educational Psychology, 84(4), 444-452.
Mayer, R. E., & Moreno, R. (1998). A split attention effect in multimedia learning: Evidence for dual systems in working memory. Journal of Educational
Psychology, 90(2), 312-320.
Milheim, W. M. (1993). How to use animation in computer assisted learning. British
Journal of Educational Technology, 24(3), 171-178.
Miller, G. A. (1956). The magical number, seven, plus or minus two: Some limits on our capacity for processing information. In G. A. Miller (1967). Psychological
Review, 63, 81-97.
Moore, D. M., Burton, J. K., & Myers R. J. (1996). Multiple-channel
communication: The theoretical and research foundations of multimedia. In D. H. Jonassen, ed. Handbook of research for educational communications and
Paivio, A. (1971). Imagery and verbal processes. New York: Holt, Rinehart & Winston.
Paivio, A. (1986). Mental representations: A dual coding approach. New York: Oxford University Press.
Park, O. & Gittelman, S. S. (1992). Selective use of animation and feedback in computer-based instruction. Educational Technology Research and Development,
40(4), 27-38.
Peterson, L. R., & Perterson, M. (1959). Short-term retention of individual items.
Journal of Experimental Psychology, 58, 193-198.
Phye, G. D. (1979). The processing of informative feedback about multiple-choice test performance. Contemporary Educational Psychology, 4, 381-394.
Reed, S. (1985). Effect of computer graphics on improving estimates to algebra word problems. Journal of Educational Psychology, 77(3), 285-298.
Rieber, L. P. & Hannafin, M. (1988). The effects of textural and animated orienting activities and practice on learning from computer-based instruction. Computer in
the Schools, 5(1), 77-79.
Rieber, L. P. (1989). The effects of computer-elaborated animation strategies and practice on factual and application learning in an elementary science lesson.
Journal of Educational Computing Research, 5(4), 431-444.
Rieber, L. P. (1990a). Animation in a computer-based instruction. Educational
Technology Research and Development, 38(1), 77-86.
Rieber, L. P. (1990b). Using animation in science instruction with young children.
Journal of Educational Psychology, 82(1), 135-140.
Rieber, L. P. (1991a). Effects of visual grouping strategies of computer animated presentations on selective attention in science. Educational Technology Research
and Development, 39(4), 5-15.
Rieber, L. P. (1991b). Computer animation, incidental learning, and continuing motivation. Journal of Educational Psychology, 83(3), 318-328.
Rieber, L. P. (1996). Animation as feedback in a computer-based simulation: Representation matters. Educational Technology Research and Development,
44(1), 5-22.
Rieber, L. P. (1996). Animation as a distracter to learning. International Journal of
Sales, G. C. (1993). Adapted and adaptive feedback in technology-based instruction. In J. V. Dempsey & G. C. Sales, eds. Interactive instruction and feedback,
159-175. Englewood Cliffs, NJ: Educational Technology.
Shapiro, A. M. (1999). The relationship between prior knowledge and interactive overviews during hypermedia-aided learning. Journal of Educational Computing
Research, 20(2), 143-167.
Sutliff, R. (1986). Effect of adjunct postquestions on achievement. Journal of
Industrial Teacher Education, 23(3), 45-54.
Speelman, P. K. (1997). The effects of computer generated text slides with
animation on short-term retention of knowledge. Unpublished doctoral
dissertation, Wayne State University.
Spotts J. & Dwyer, F. (1996). The effect of computer-generated animation on student achievement of different types of educational objectives. International
Journal of Instructional Media, 23(4), 365-375.
Thompson, S. V. & Riding, R. J. (1990). The effect of animated diagrams on the understanding of a mathematical demonstration in 11-14 year old pupils. British
Journal of Educational Psychology, 60(1), 93-98.
Torres, J. (1990). The effect of three visual enhancement strategies on learners who
possess high and low prior knowledge on specific learning objectives when time on instruction is held constant. Unpublished doctoral dissertation, The
Pennsylvania State University.
Wager, W. & Wager, S. (1985). Presenting questions, processing responses, and providing feedback in CAI. Journal of Instructional Development, 8(4), 2-8. Wager, W. & Mory, E. H. (1993). The role of questions in learning. In J. V.
Dempsey & G. C. Sales, eds. Interactive instruction and feedback, 55-73. Englewood Cliffs, NJ: Educational Technology.
Wentling, T. L. (1973). Mastery versus nonmastery instruction with varying test item feedback treatments. Journal of Educational Psychology, 65(1), 50-58. West, C. K., Farmer, J. A., & Wolff, P. M. (1991). Instructional design:
Implications from cognitive science. Englewood Cliffs, NJ: Prentice Hall.
Williamson, V. M. (1995). The effects of computer animation on the particulate mental models of college chemistry students. Journal of Research in Science
Wilson, F. S. (1998). The effect of time and level of visual enhancement in
facilitating student achievement of different educational objectives. Unpublished
doctoral dissertation, The Pennsylvania State University.
Winn, W. (1993). An account of how readers search for information in diagrams.
Contemporary Educational Psychology, 18(2), 162-185.