The Relationship among Brand Equity, Customer Satisfaction, and Brand Resonance to Repurchase Intention of Cultural and Creative industries in Taiwan
This study used a successful example of cultural and creative industry, Pili Puppet Show, to explore the effect of brand equity, customer satisfaction, and brand resonance on repurchase intention. The results of this study are as follows: 1) the two dimensions of brand equity and customer satisfaction can both enhance consumer brand resonance for the product, and the effect of customer satisfaction on brand resonance is greater than that of brand equity; 2) the three dimensions of brand equity, customer satisfaction, and brand resonance all directly affect consumer repurchase intention; 3) brand resonance has a partial mediating effect in the influence of brand equity on repurchase intention, and brand resonance has a complete mediating effect on the influence of customer satisfaction on repurchase intention. The findings can serve as references to future studies and the marketing strategies of cultural and creative industry in Taiwan.
Key words: Brand equity, customer satisfaction, brand resonance, repurchase intention, Pili Puppet Show
Introduction
Many studies have discussed consumers’ brand resonance elicited by famous brands, but few have explored brands in cultural and creative industries in terms of the influence of brand resonance. Thus, this study uses a local industry, Pili Puppet Show, as the research subject, Pili Puppet Show Troupe was popular all over Taiwan in the 1980s, where there were Pili clubs in schools, many people renting videos from rental stores, related merchandise became popular symbols of passions among adolescents, and even political elections used characters for insinuations. During this period, even though “XiaoXiYuan,” “I Wan Jan” and other puppet troupes also received attention, Pili Puppet Show Troupe is the only one that continues to have a large fanbase. Keller (1993) emphasized that research on the effect of brand resonance must choose “famous” brands, because after consumers identify with the brand, they will further develop resonance for the product. Thus, in terms of the specific environment, among the puppet show industries in Taiwan, the “Pili” brand is certainly the most well known, thus this study uses it as the research subject.
The main purpose of this study is to use the local specialty industry, Pili Puppet Show, in attempt to understand the effect of brand equity and customer satisfaction of Pili Puppet Show fans on brand resonance, exploring the effect of brand equity, customer satisfaction, and
brand resonance theory on repurchase intention, to serve as a reference for future industries in establishing marketing strategies. Thus, the purposes of this study are as follows:
1.Explore the effect of brand equity and customer satisfaction on brand resonance.
2.Explore the effect of brand equity, customer satisfaction, and brand resonance on repurchase intention.
3.Explore whether brand resonance mediates the effect of brand equity and customer satisfaction on repurchase intention.
Literature review Brand equity
Tauber (1988) suggested that brand equity is the added value of a corporate brand’s market position that exceeds the physical assets. Farquhar (1990) also proposed similar views, believing that brand equity is the added value produced by the brand names or symbols for the physical products. Aaker (1991) indicated that brand equity is a combination of assets and liabilities of brand, brand name, and symbols, which may increase or decrease the product or service’s value for corporations or consumers, or change assets and liabilities. Kim et al.
(2009) argued that brand equity refers to brands can inspire a special combination of thinking, feeling, perceiving, and associating of people paying attention, in turn affecting purchase ability. Lassar et al. (1995) proposed that brand equity comes from consumers’ overall value association and perceptions toward a brand, believing that brand equity is not absolute, but comes from comparing with competitors. Tauber (1988) indicated that brand equity is the market position constructed by the brand; establishment of brand equity will bring added value of products that exceed the physical asset value. Keller (2001) pointed out that brand equity not only affects consumer purchase decisions, but is also an important source for corporations to obtain competitive advantages and profits, developing a consumer-based brand equity model (CBBE), which believed that brand equity includes brand significance, brand performance, brand image, brand determination, brand sense and brand resonance.
Customer satisfaction
Cardozo (1965) was the first scholar to propose the concept of customer satisfaction, believing that customer satisfaction would elevate customer repurchase behavior, and they would purchase other products. Howard and Sheth (1969) then defined customer satisfaction as whether they can reach a satisfied psychological state after comparing what they paid for they product and what they gained. Oliver (1981) suggested that customer satisfaction is determined by the extent to which customers expect product benefits will be realized, or the consistency between expected and actual results. Dovidow and Uttal (1989) also mentioned the gap between expected treatment and perceived treatment from customers. Kotler (1991) argued that customer satisfaction is a post-sale evaluation of product quality compared to expectation before purchase. Tzeng (2009) proposed that customer satisfaction is the gap between expected service standards and actually sensed service standards, and the emotional response produced based on this gap. The above research literature shows that, customer satisfaction is related to customer expectation; customer expectations include a company’s tangible service commitments, intangible service commitment, buzz, and past purchase experience, and these form the basis to form customer expectation standards. Parasuraman et al. (1993) mentioned that the gap between sensed services and expected services determine
customer satisfaction.
Brand resonance
In the customer-based brand equity (CBBE) model proposed by Keller (1993), the brand resonance was officially proposed. Later, Keller (2001) defined brand resonance as the relationship between consumers and brands, or the extent to which consumers sense the brands, and there are differences in the “potency” consumers’ emotional resonance with brands, which can be divded into four levels, which are attachment, behavioral loyalty, sense of community, and active engagement. Keller (1993) indicated that in order to resonate with a certain brand, consumers need to not only frequently use products of the brand, but also need to actively be concerned about information relating to the brand, forming a strong psychological attachment to the brand. Chang (2011) further explained brand resonance, believing that consumer loyalty caused by brand resonance can be expressed in two ways, which are behavioral loyalty and emotional loyalty. It was believed that emotional loyalty necessitated the existence of behavioral loyalty, but the vice versa may not be true.
Repurchase intention
According to Cronin and Morris (1989) and Cronin and Taylor (1992), repurpose intention refers to psychological commitment toward the product or service that arises after using them, resulting in the idea for consumption again. Jones and Sasser (1995) discovered that repurchase intention is very important for the profit and evaluation of stores. Seiders et al.
(2005) indicated repurchase intention refers to the extent to which consumers are willing to buy the product or service again, and is a simple, objective, and observable expected purchase behavior. Collier and Bienstock (2006) also pointed out that repurchase intention is not only the possible inclination of buying products, but may also include the intention to recommend it to relatives and friends.
Research Methods
Research structure
This study explored the correlations among variables of brand equity, customer satisfaction, brand resonance, andrepurchase intention, in turn developing the following research framework (Figure 1).
Research hypotheses
Among the six dimensions of the brand equity pyramid model proposed by Keller (2001), brand resonance is at the top of this pyramid, which means that when consumers identify with the brand, brand equity takes effect, resulting in brand resonance.
Lassar et al. (1995) suggested that brand equity makes customers increase perspective utility and benefits in their minds toward the brand, and the study also mentioned that the three main elements that affect the internal value assessment of customers not only include the non-specific cognition, value association of brand, and the position of the name. In order to form customer perceptions and concepts, other than buzz by other people’s promotions, the
feelings of usage experiences are necessary, so customer views toward this brand would affect the perception of brand equity, the formation of this view, especially the subjective image, has a close relationship with customer satisfaction.
Aaker (1991) argued that perceptive sources for brands come from objective elements that arise from the stimulus, as well as personal subjective psychological elements. Relative to brand equity that forms from the different choices in brand, satisfaction is more inclined toward the subjective identity of customers, and the effect of consumers’ personal expectations comprises the consumer feeling dimension in brand resonance.
Keller (1993) proposed that the effect of brand equity is that it can help consumers gain the effect of premium prices, or that consumers usually have greater product evalutation for brand products with high name recognition. Neal (1999) indicated that when decision-makers decide on purchase behavior, they generally consider maximization of brand traits and benefits that they can perceive. Thus, in terms of customer purchase intentions, brand value has a positive effect, and there would be greater purchase intention for products or services with better brand equity.
Oliver (1997) proposed that satisfactory shopping experiences can affect future purchase intention and attitudes, while unsatisfactory purchase experiences would reduce the repurchase intention for customers. Neal (1999) suggested that when decision-makers decide on purchase behavior, their internal brand preferences would be a reference for purchase.
Kotler (2010) emphasized that customer satisfaction would prompt customer willingness to repurchase, even overlooking advertisements of competing brands and not purchase products from other companies; this demonstrates the relationship between customer satisfaction and repurchase intention.
Keller’s (1993) focus in brand resonance is that the customers devote deep feeling to the brand, even seeing it as a life partner. Thus, when consumers purchase the brand, it expresses personal consciousness or style, and the creation of brand must be connected to the self-imag of consumers. Chang (2008) further explained that the effects of brand resonance are: more easily move consumers, high loyalty toward a brand, increase the number of supporters, easier development of surrounding products, and causing consumers to have more accommodation for the brand. Huang (2006) suggested that brand resonance would establish psychological attachment, in turn protecting behavioral loyalty, which affects purchase intention. Based on the research purpose, research framework, and relevant literature review, this study proposes the following research hypotheses:
H1: Brand equity has a significant positive effect on brand resonance.
H2: Brand equity has a significant positive effect on customer satisfaction.
H3: Customer satisfaction has a significant positive effect on brand resonance.
H4: Brand equity has a significant positive effect on repurchase intention.
H5: Customer satisfaction has a significant positive effect on repurchase intention.
H6: Brand resonance has a significant positive effect on repurchase intention.
H7: Brand resonance has a mediating effect in the relationship between brand equity and repurchase intention.
H8: Brand resonance has a mediating effect in the relationship between customer satisfaction and repurchase intentio.
Sampling
This study used snowball sampling, through the recommendations of homogeneous consumption groups for questionnaire surveys. Related consumption groups include the members of puppet theatre clubs in schools, members provided by the Pili Company, known aficionados of puppet theatre, and visitors to Huwei Puppet Museum as subjects of data collection. For the four types of data collection subjects, members of puppet theatre clubs in schools and members provided by the Pili Company used mailed questionnaire release and retrieval. This study released 420 questionnaires, 306 questionnaires were retrieved, after discarding 32 invalid questionnaires, there were a total of 274 valid questionnaires.
The male-female ratio of samples in this questionnaire is 186:88, approximately 2:1. In terms of age distribution, most are adolescents under 19 years old (30.7%), followed by the 25-29 age group (19.3%), which add up to 50%. If the 20-24 age group is also added (9.1%), it comprises of 59.1% of the age groups, which means the questionnaire can express the views and inclinations of the younger generation. Due to snowball sampling being started in Yunlin, Jiayi, and Tainan, most of the samples were accumulated in these areas, and 54.7% of the residences were in these areas. In terms of the relationship between subjects and Pili Company, among the survey samples, the ratio of members to non-members was 39: 61, approximately 1: 1.6. In terms of the consumption situation of the surveyed sample, most test subjects have not actually purchased (32.5%), and most of those who do spend only spend less than 600 NTD (67.9%). This study primarily presents the younger generation under 29 years of age, who are mostly geographically congregated in Yunlin, Jiayi, and Tainan, where Pili Company is located; most of the opinions expressed were from males.
Measurement of the Constructs
The questionnaire on brand equity in the study referred to Aaker (1991), after modification there were 22 questions. The questionnaire on customer satisfaction in referred to Anderson et al. (1994) with 12 questions, brand resonance in the study referred to Huang (2006), with 12 questions. In addition, repurchase intention referred to Tsai and Huang (2007) with 8 questions. All the questions in this study use the Likert 5-point scale for scoring. Cronbach's α reliability analysis was used to delete questions with poor reliability, the reliability values of the scales ranged 0.926-0.958, which means that the questionnaires in this study have good reliability.
DATA ANALYSIS
Liability
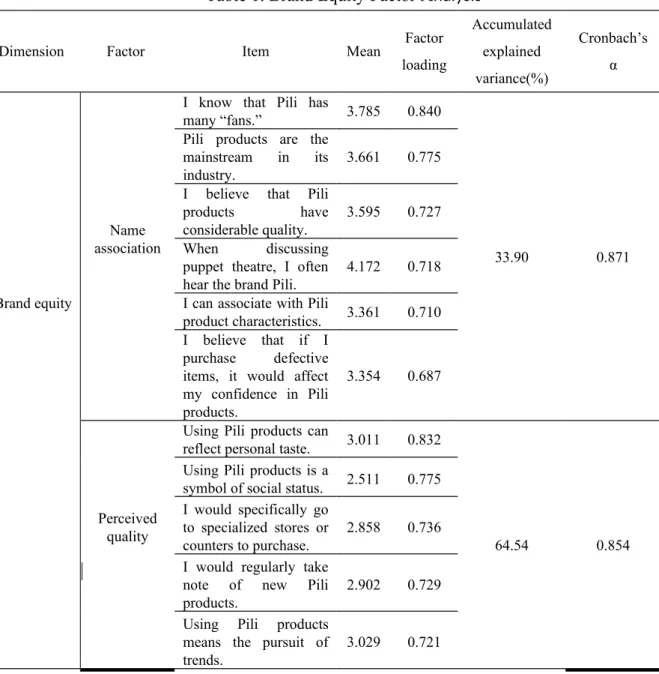
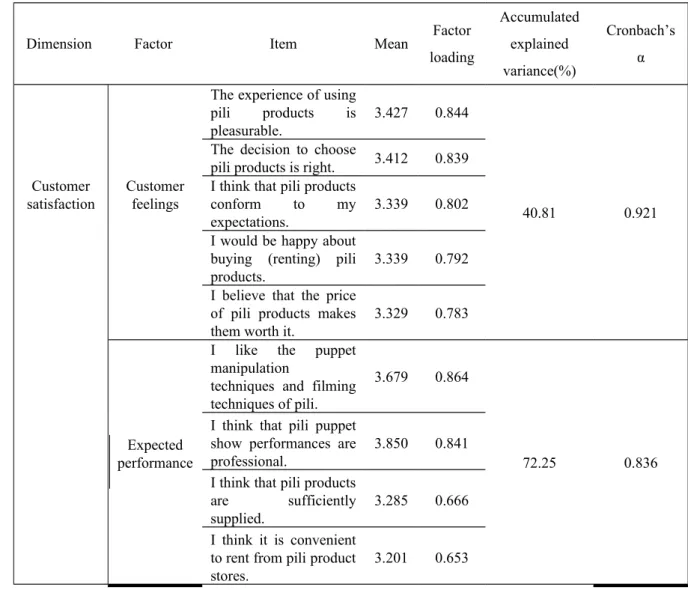
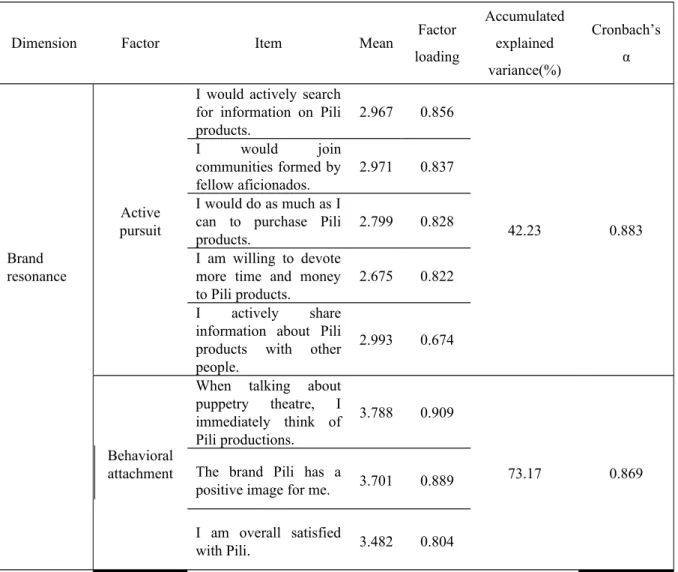
The factor analysis results show that in this study the dimensions’ KMO values are all greater than 0.8, and the Bartlett test of sphericity results are all smaller than 0.05, showing significant results. From Table 1, brand equity which after factor analysis derives the two principal factors of “name association” and “perceived quality,” which can explain 64.54% of this dimension, and the reliability tests for the Cronbach’s α of this two factors are all above 0.8. Hair et al. (2010) indicated that a satisfactory value of Cronbach’s α is required to be more than 0.70 for the scale to be reliable. Table 2 explains that in the customer satisfaction dimension, the principal factors are “customer feelings” and “expected performance,” which can explain 72.25% of this dimension, and the Cronbach’s α of the two factors are all above 0.8. Table 3 explains that in the “brand resonance” dimension, the principal factors are “active pursuit” and “behavioral attachment,” which can explain 73.17% of this dimension, and the Cronbach’s α of the two factors are all above 0.8. Table 4 explains that in the “repurchase
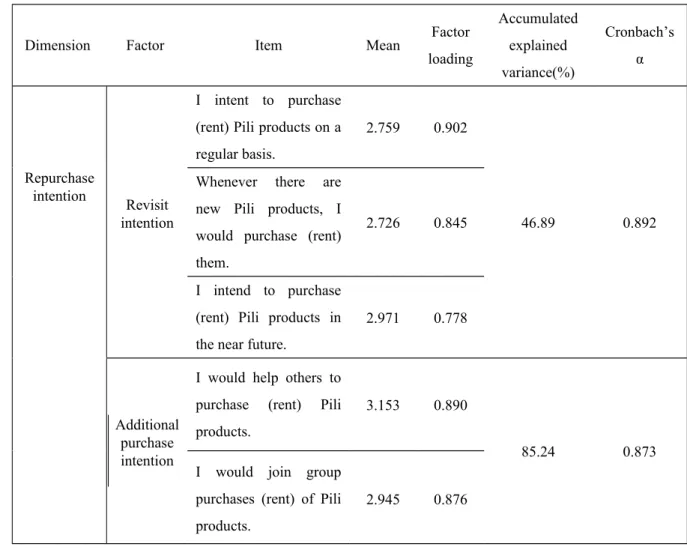
intention” dimension, the principal factors are “revisit intention” and “additional purchase intention,” which can explain 85.24% of this dimension, and the Cronbach’s α of the two factors are all above 0.8.
………Insert Table 1 about here ….………
………Insert Table 2 about here ….………
………Insert Table 3 about here ….………
………Insert Table 4 about here ….………
Regression Analysis
Regression analysis results in Table 5 show that brand equity has a significant positive effect on brand resonance (β=0.863, p < 0.001). In addition, customer satisfaction also has a significant positive effect on brand resonance (β=0.863, p < 0.001), thus hypotheses H1 and H3 are established. Next, the second regression analysis shows, brand equity has a significant positive effect on customer satisfaction (β=0.887, p < 0.001), thus hypothess H2 is established.
In addition, regression four and five show, the two dimensions brand equity (β=0.731, p <
0.001) and customer satisfaction (β=0.733, p < 0.001) both have significant positive effects on repurchase intention, thus hypotheses H4 and H5 are supported. Finally, regression six showsbrand resonance (β=0.731, p < 0.001) has a significant positive effect on repurchase intention, thus hypothesis H6 is established.
………Insert Table 5 about here ….………
Analysis of Mediating Effects
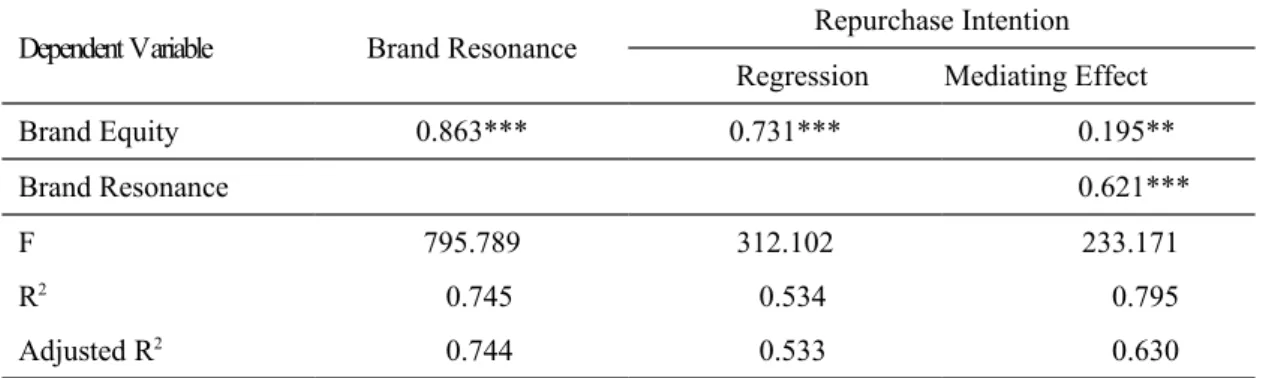
In order to confirm the mediating effect of brand resonance between brand equity and repurchase intention, this study uses the mediating effect confirmation model by Baron and Kenny (1986) to test whether brand resonance is the mediating variable between brand equity and repurchase intention. The following four conditions must be met: 1. brand equity must be significantly correlated with repurchase intention; 2. brand equity must be significantly correlated with brand resonance; 3. When brand equity and brand resonance are both predictive variables, and regression analysis is conducted forrepurchase intention, brand resonance must be significantly correlated with repurchase intention; 4. In the mediating variable model, the regression coefficient of brand equity must be smaller than the regression coefficient of the independent variable model. In addition, if the relationship between the independent variable and dependent variable would be weakened due to the existence of mediating variable, it is a partial mediation; and if the influence is insignificant and the coefficient is close to 0, there is full mediation.
As Table 6 shows, there is a significant positive relationship between brand equity and repurchase intention (β=0.731, p < 0.001), brand equity can explain repurchase intention 53.4% of variance. Second, there is a significant positive relationship between brand equity and brand resonance (β=0.863, p < 0.001), brand equity can explain brand resonance 74.5% of
variance. Third, when brand equity and brand resonance are both predictive variables, there is a significant relationship between brand resonance and repurchase intention (β=0.621, p <
0.001), the two predictive variables can explain repurchase intention 79.5% of variance.
Fourth, after adding the mediating variable (brand resonance), the relationship between brand equity and repurchase intention is weakened, the β value of brand equity is decreased from 0.731 to 0.195, but the explanatory ability increases from 0.534 to 0.795, and part of the effect is replaced by that of brand resonance. Thus, it conforms to the four standards for mediating variable testing, proving that brand equity can indeed produce a full mediating effect through brand resonance, to form a relationship with repurchase intention.
………Insert Table 6 about here ….………
As Table 7 shows, first, there is a significant positive relationship between customer satisfaction and repurchase intention (β=0.733, p < 0.001), customer satisfaction can explain repurchase intention 53.7% of variance. Second, there is a significant positive relationship between customer satisfaction and brand resonance (β=0.887, p < 0.001), customer satisfaction can explain brand resonance 78.7% of variance. Third, when brand equity and brand resonance are both predictive variables, there is a significant positive relationship between brand resonance and repurchase intention (β=0.653, p < 0.001), the two predictive variables can explain repurchase intention 62.8% of variance. Fourth, in the mediating variable model, after adding the mediating variable (brand resonance), the relationship between customer satisfaction and repurchase intention is weakened, the β value of brand equity is lowered from 0.733 to 0.153, but the explanatory ability increases from 0.537 to 0.628, and part of the effect is replaced by that of brand resonance. Thus, it conforms to the four standards for mediating variable testing, proving that customer satisfaction can indeed produce a full mediating effect through brand resonance, to form a relationship with repurchase intention.
………Insert Table 7 about here ….………
CONCLUSION AND SUGGESTIONS
Results of this study prove that the two dimensions of brand equity and customer satisfaction can both elevate the extent of consumer brand resonance, and the effect of customer satisfaction on brand resonance is greater than that of brand equity. Thus, the establishment of the Pili Puppet Show brand, and establishment of the “Pili Club” for fan members caused many fans of the “Pili Club” believe that pursuing such products can represent personal taste and trendiness, which greatly elevates brand equity for show fans. In addition, the professionalism, manipulation techniques, and filming methods in Pili Puppet Show performances have developed many Pili products to elevate the customer satisfaction of fans;
these are important factors. Furthermore, this study finds that when brand equity is better, customers would have greater satisfaction for the brand, which means that brand equity is an important antecedent variable that affects customer satisfaction. This is similar to the studies by Aaker (1991) and Schreuer (2000), proving that there is a significant positive relationship between brand equity and customer satisfaction.
The other important conclusion of this study is that the three dimensions of brand equity,
customer satisfaction, and brand resonance would directly affect customer repurchase intention; this result is consistent with that by Parasuraman et al. (1993), Jones and Sasser (1995), Aaker (1991) and Schreuer (2000). However, this study finds that brand resonance is the mediating variable of brand equity and repurchase intention, with partial mediating effects, or that brand equity would affect repurchase intention through brand resonance. In addition, brand resonance is the mediating variable between customer satisfaction and repurchase intention, with a full mediating effect, or that customer satisfaction would affect repurchase intention through brand resonance. This shows, for brand equity and customer satisfaction to have a positive effect on repurchase intention, brand resonance plays a very important mediting role. According to Keller’s (2001) assessment of brand resonance, the source of brand resonance is the consumers’ internal emotional attachment to the brand and external involvement of activities relating to the brand. Thus, an important issue is how to increase consumer brand resonance for the brand, in turn causing consumers to form deep connections to the brand psychologically. Thus, it is important to let Pili Puppet Show fans actively participate in relevant communities or share information on Pili products to others, and if they form attachment and brand resonance for the brand, Pili Puppet Show fans would purchase (or rent) Pili products.
The sample of this study is set to the Pili Puppet Show fans, thus it is not possible to be conducted through random sampling. Also, because Yunlin is the origin of puppet theatre, most subjects live in Yunlin, thus limiting the ability of results of this study to be generalized.
Figure 1. Research Framework
Brand equity Brand equity
Customer satisfaction Customer satisfaction
Brand resonance Brand resonance
Repurchase intention Repurchase intention
H1 H2
H4
H5
H6 H3
Table 1. Brand Equity Factor Analysis
Dimension Factor Item Mean Factor
loading
Accumulated explained variance(%)
Cronbach’s α
Name association
I know that Pili has
many “fans.” 3.785 0.840
33.90 0.871
Pili products are the mainstream in its industry.
3.661 0.775 I believe that Pili
products have
considerable quality.
3.595 0.727 When discussing
puppet theatre, I often hear the brand Pili.
4.172 0.718 Brand equity I can associate with Pili
product characteristics. 3.361 0.710 I believe that if I
purchase defective items, it would affect my confidence in Pili products.
3.354 0.687
Perceived quality
Using Pili products can
reflect personal taste. 3.011 0.832
64.54 0.854
Using Pili products is a
symbol of social status. 2.511 0.775 I would specifically go
to specialized stores or counters to purchase.
2.858 0.736 I would regularly take
note of new Pili products.
2.902 0.729 Using Pili products
means the pursuit of trends.
3.029 0.721
Table 2. Customer Satisfaction Factor Analysis
Dimension Factor Item Mean Factor
loading
Accumulated explained variance(%)
Cronbach’s α
Customer feelings
The experience of using pili products is pleasurable.
3.427 0.844
40.81 0.921
The decision to choose
pili products is right. 3.412 0.839 Customer
satisfaction
I think that pili products conform to my expectations.
3.339 0.802 I would be happy about
buying (renting) pili products.
3.339 0.792 I believe that the price
of pili products makes them worth it.
3.329 0.783
Expected performance
I like the puppet manipulation
techniques and filming techniques of pili.
3.679 0.864
72.25 0.836
I think that pili puppet show performances are professional.
3.850 0.841 I think that pili products
are sufficiently supplied.
3.285 0.666 I think it is convenient
to rent from pili product stores.
3.201 0.653
Table 3. Brand Resonance Factor Analysis
Dimension Factor Item Mean Factor
loading
Accumulated explained variance(%)
Cronbach’s α
Active pursuit
I would actively search for information on Pili products.
2.967 0.856
42.23 0.883
I would join
communities formed by fellow aficionados.
2.971 0.837 I would do as much as I
can to purchase Pili products.
2.799 0.828 Brand
resonance
I am willing to devote more time and money to Pili products.
2.675 0.822 I actively share
information about Pili products with other people.
2.993 0.674
Behavioral attachment
When talking about puppetry theatre, I immediately think of Pili productions.
3.788 0.909
73.17 0.869
The brand Pili has a
positive image for me. 3.701 0.889 I am overall satisfied
with Pili. 3.482 0.804
Table 4. Repurchase Intention Factor Analysis
Dimension Factor Item Mean Factor
loading
Accumulated explained variance(%)
Cronbach’s α
Revisit intention
I intent to purchase (rent) Pili products on a regular basis.
2.759 0.902
46.89 0.892
Repurchase
intention Whenever there are new Pili products, I would purchase (rent) them.
2.726 0.845
I intend to purchase (rent) Pili products in the near future.
2.971 0.778
Additional purchase intention
I would help others to purchase (rent) Pili products.
3.153 0.890
85.24 0.873
I would join group purchases (rent) of Pili products.
2.945 0.876
Table 5. Regression Analysis Results
Regression Srandard
β
Adjusted
R2 F Hypothesis
Regression 1
Brand etuity→Brand resonance 0.863*** 0.744 795.789 H1
Regression 2
Brand etuity→Consumer satisfaction 0.847*** 0.716 687.688 H2
Regression 3
Consumer satisfaction→Brand resonance 0.887*** 0.786 1005.448 H3 Regression 4
Brand etuity→Repurchase intention 0.731*** 0.533 312.102 H4
Regression 5
Consumer satisfaction→Repurchase intention 0.733*** 0.535 315.316 H5 Regression 6
Brand resonance→Repurchase intention 0.789*** 0.621 449.016 H6
*p<0.05, **p<0.01, ***p<0.001
Table 6. The Mediating Effect of Brand Resonance between
Brand Equity and Repurchase Intention
Dependent Variable Brand Resonance Repurchase Intention Regression Mediating Effect
Brand Equity 0.863*** 0.731*** 0.195**
Brand Resonance 0.621***
F 795.789 312.102 233.171
R2 0.745 0.534 0.795
Adjusted R2 0.744 0.533 0.630
*P<0.05;**P<0.01;***P<0.001
Table 7. The Mediating Effect of Brand Resonance between Consumer Satisfaction and Repurchase Intention
Dependent Variable Brand Resonance Repurchase Intention Regression Mediating Effect
Consumer Satisfaction 0.887*** 0.733*** 0.153
Brand Resonance 0.653***
F 1005.448 315.316 228.501
R2 0.787 0.537 0.628
Adjusted R2 0.786 0.535 0.625
*P<0.05;**P<0.01;***P<0.001
References
Aaker, D. A. (1991). Managing brand equity: Capitalizing on the value of a brand name.
New York: Free Press.
Anderson, E. W., Fornell, C., & Lehmann, D. R. (1994). Customer satisfaction, market share and profitability: Findings from Sweden. Journal of Marketing, 58(3), 53-66.
Baron, R. M., & Kenny, D. A. (1986). The moderator-mediator variable distinction in social psychological research: Conceptual, strategic, and statistical consideration. Journal of Personality and Social Psychology, 51(6), 1173-1182.
Cardozo, R. N. (1965). An experimental study of customer effort, expectation, and satisfaction. Journal of Marketing Research, 2(3), 244-249.
Chang, Y. (2008). Brand resonance: the important path toward brand loyalty. Airiti Library, 1, 194-196.
Chang, C. (2011). Deep differentialization comes from compatible resonance. Business School, 81(5), 214-219.
Chen, L. T. (1991). Huang Junxiong television puppetry. Master's thesis, unpublished, College of Arts, Chinese Culture University.
Collier, J. E., & Bienstock, C. C. (2006). Measuring service quality in e-retailing. Journal of Service Research, 8(3), 260-275.
Cronin, J. J., & Morris, M. H. (1989). Satisfying customer expectation : The effect on conflict and repurchase intentions in industrial marketing chanuels. Journal of the Academy of Marketing Science, 17(1), 41-49.
Cronin, J. J., & Taylor, S. A. (1992). Measuring service quality: A reexamination and extension. Journal of Marketing, 56(3), 55-68.
Dovidow, W. H., & Uttal, B. (1989). Service companies: Focus or falter. Harvard Business Review, 67(4), 77-86.
Farquhar, P. H. (1990). Managing brand equity. Journal of Advertising Research, 30(4), 7-12.
Feng, S. R. (2007). Pili Puppet Show industrial chain developmental indicators. Master's thesis, unpublished, Graduate Institute of Architecture and Urban Design, Chaoyang University of Technology.
Hair, J. F., Black, W. C., Babin, B. J., & Anderson, R. E. (2010). Multivariate Data Analysis.
New Jersey: Pearson Education.
Howard, J. A., & Sheth, J. N. (1969). The theory of buyer behavior. New York: John Wiley &
Sons.
Huang, D. W. (2006). Correlation of brand image, brand equity, customer satisfaction, involvement, and brand resonance of technological products–electronics products as case study. Master's thesis, unpublished, Graduate Institute of Management Science Research, Nanhua University.
Jones, T. O., & Sasser, W. E. (1995). Why satisfied customers defect. Harvard Business Review, 73(6), 88-99.
Keller, K. L. (2001). Building customer-based brand equity: A blueprint for creating strong brands. Marketing Science Institute, Report No.001-107.
Keller, K. L. (1993). Conceptualizing, measuring, and managing customer-based brand equity. Journal of Marketing, 57(1), 1-22.
Kim, J., Jin, B., & Swinney, J. L. (2009). The role of etail quality, e-satisfaction and e-trust in online loyalty development process. Journal of Retailing & Consumer Services, 16 (4), 239-247.
Kotler, P. (2010). Marketing management. 13th ed. Prentice Hall International Inc.
Kotler, P. (1991). Presentation at the trustees. Meeting of the Marketing Science In Institute in November 1990, Boston.
Lassar, W., Banwari, M., & Arun, S. (1995). Meansuring customer-based brand equity.
Journal of Comsumer Marketing, 12(4), 11-19.
Neal, W. D. (1999). Satisfaction is nice, but value drives loyalty. Marketing Research, 11(2), 20-23.
Oliver, R. L. (1981). Measurement and evaluation of satisfaction processes in retailing setting. Journal of Retailing, 57(3), 495-507.
OliVer, R. L. (1997). Satisfaction: A behavior perspective on the consumer. New York : McGraw-Hill.
Parasuraman, A., Zeithaml, V. A., & Berry, L. L. (1993). Thenature and determinants of customer expectations of service. Journal of the Acdemy of Marketing Science, 21 (1), 1- 12.
Schreuer, R. (2000). To build brand equity, marketing alone is not enough. Strategy and Leadership, 28(4), 16-20.
Seiders, K., Voss, G. B., Grewal, D., & Godfrey A. L. (2005). Do satisfied customers buy more? Examining moderating influences in a retailing context. Journal of Marketing, 69(4), 26-43.
Tauber, E. M. (1988). Brand leverage: strategy for growth in a cost control world. Journal of Advertising Research, August/September, 26-30.
Tsai, H. T., & Huang, H. C. (2007). Determinants of e-repurchase intentions: An integrative model of quadruple retention drivers. Information & Management, 44(3), 231-239.
Tzeng, G. H. (2009). Service industry marketing and management – quality elevation and value creation. Taipei City: Chan Chen cultures.